SlideShare a Scribd company logo
1 of 5
Ocean buoys collect data
over many years – changes
in the atmosphere and
ocean over many years
provide clues to climate
variability.
We need to look at the
ANOMALIES to identify
variability.
Anomaly: Difference from
normal (or difference from
the average conditions)
Climate of Change – Unit 2: Deciphering Climate Variability
NOAA Image
The TAO/TRITON buoys are in an area of the Pacific where there are
few islands or ships to collect weather data. Japan maintains 15 of
the buoys (labeled TRITON below). The other 55 are maintained by
the United States, through the National Data Buoy Center, which is a
division of NOAA.
Climate of Change – Unit 2: Deciphering Climate Variability
NOAA Image
Instruments on the
TAO/TRITON buoys
measure sea-surface
temperature, wind speed
and direction, relative
humidity, air temperature,
and subsurface
temperatures in the upper
500 meters of the ocean.
The buoys are moored in
place with an anchor.
Climate of Change – Unit 2: Deciphering Climate Variability
NOAA Image
Six to eight times a year, scientists and technicians go out on the
NOAA ship Ka’imimoana to repair and replace buoys along
different sections of the array.
Climate of Change – Unit 2: Deciphering Climate Variability
NOAA Image
(Averages)
Arrows depict
wind strength
and direction
(longer arrow
= stronger
wind)
TAO/TRITON Monthly Sea Surface Temp (SST) in °C and Winds (m/s2)
Long arrows
indicate wind
is stronger
than average
(and in same
direction)
Short arrows
indicate wind
is similar to
the long-term
average
Climate of Change – Unit 2: Deciphering Climate Variability

More Related Content

Similar to Unit 2 Introductory PPT Slides

Mercator Ocean newsletter 26
Mercator Ocean newsletter 26Mercator Ocean newsletter 26
Mercator Ocean newsletter 26
Mercator Ocean International
 
Mercator Ocean newsletter 33
Mercator Ocean newsletter 33Mercator Ocean newsletter 33
Mercator Ocean newsletter 33
Mercator Ocean International
 
Ramón Margalef Ship and its robot Rov Liropus 2.000
Ramón Margalef Ship and its robot Rov Liropus 2.000 Ramón Margalef Ship and its robot Rov Liropus 2.000
Ramón Margalef Ship and its robot Rov Liropus 2.000
e-twinning
 
Ramón margalef ship_and_its_robot_rov_liropus_2.000
Ramón margalef ship_and_its_robot_rov_liropus_2.000Ramón margalef ship_and_its_robot_rov_liropus_2.000
Ramón margalef ship_and_its_robot_rov_liropus_2.000
e-twinning
 
Mercator Ocean newsletter 44
Mercator Ocean newsletter 44Mercator Ocean newsletter 44
Mercator Ocean newsletter 44
Mercator Ocean International
 
Mercator Ocean newsletter 50
Mercator Ocean newsletter 50Mercator Ocean newsletter 50
Mercator Ocean newsletter 50
Mercator Ocean International
 
Rising Ocean Temps and Coral
Rising Ocean Temps and CoralRising Ocean Temps and Coral
Rising Ocean Temps and Coral
Michelle Jones
 
Chapter11ccimpactonwaterresources 130630061102-phpapp01
Chapter11ccimpactonwaterresources 130630061102-phpapp01Chapter11ccimpactonwaterresources 130630061102-phpapp01
Chapter11ccimpactonwaterresources 130630061102-phpapp01
Cleophas Rwemera
 

Similar to Unit 2 Introductory PPT Slides (20)

Mercator Ocean newsletter 26
Mercator Ocean newsletter 26Mercator Ocean newsletter 26
Mercator Ocean newsletter 26
 
Mercator Ocean newsletter 33
Mercator Ocean newsletter 33Mercator Ocean newsletter 33
Mercator Ocean newsletter 33
 
Ramón Margalef Ship and its robot Rov Liropus 2.000
Ramón Margalef Ship and its robot Rov Liropus 2.000 Ramón Margalef Ship and its robot Rov Liropus 2.000
Ramón Margalef Ship and its robot Rov Liropus 2.000
 
El nino and la nina
El nino and la ninaEl nino and la nina
El nino and la nina
 
Climate Change Past Present Future
Climate Change Past Present FutureClimate Change Past Present Future
Climate Change Past Present Future
 
QUOVADIS_NUM5_AMJ_2011
QUOVADIS_NUM5_AMJ_2011QUOVADIS_NUM5_AMJ_2011
QUOVADIS_NUM5_AMJ_2011
 
hydrometeorological-hazard-t. kris..pptx
hydrometeorological-hazard-t. kris..pptxhydrometeorological-hazard-t. kris..pptx
hydrometeorological-hazard-t. kris..pptx
 
PNG coastal upwelling, ENSO, SPICE, R/V Mirai observation: UPNG presentation ...
PNG coastal upwelling, ENSO, SPICE, R/V Mirai observation: UPNG presentation ...PNG coastal upwelling, ENSO, SPICE, R/V Mirai observation: UPNG presentation ...
PNG coastal upwelling, ENSO, SPICE, R/V Mirai observation: UPNG presentation ...
 
Ramón margalef ship_and_its_robot_rov_liropus_2.000
Ramón margalef ship_and_its_robot_rov_liropus_2.000Ramón margalef ship_and_its_robot_rov_liropus_2.000
Ramón margalef ship_and_its_robot_rov_liropus_2.000
 
Physical oceanography
Physical oceanographyPhysical oceanography
Physical oceanography
 
Mercator Ocean newsletter 05
Mercator Ocean newsletter 05Mercator Ocean newsletter 05
Mercator Ocean newsletter 05
 
Some Climate Factors
Some Climate FactorsSome Climate Factors
Some Climate Factors
 
Saildrone Antarctica Mission
Saildrone Antarctica MissionSaildrone Antarctica Mission
Saildrone Antarctica Mission
 
Ocean circulation
Ocean circulationOcean circulation
Ocean circulation
 
Mercator Ocean newsletter 44
Mercator Ocean newsletter 44Mercator Ocean newsletter 44
Mercator Ocean newsletter 44
 
Mercator Ocean newsletter 50
Mercator Ocean newsletter 50Mercator Ocean newsletter 50
Mercator Ocean newsletter 50
 
noaa_16266_DS4.ppt
noaa_16266_DS4.pptnoaa_16266_DS4.ppt
noaa_16266_DS4.ppt
 
Rising Ocean Temps and Coral
Rising Ocean Temps and CoralRising Ocean Temps and Coral
Rising Ocean Temps and Coral
 
Climate resilient and environmentally sound agriculture - Module 2
Climate resilient and environmentally sound agriculture - Module 2Climate resilient and environmentally sound agriculture - Module 2
Climate resilient and environmentally sound agriculture - Module 2
 
Chapter11ccimpactonwaterresources 130630061102-phpapp01
Chapter11ccimpactonwaterresources 130630061102-phpapp01Chapter11ccimpactonwaterresources 130630061102-phpapp01
Chapter11ccimpactonwaterresources 130630061102-phpapp01
 

More from SERC at Carleton College

StatVignette03_Sig.Figs_v04_07_15_2020.pptx
StatVignette03_Sig.Figs_v04_07_15_2020.pptxStatVignette03_Sig.Figs_v04_07_15_2020.pptx
StatVignette03_Sig.Figs_v04_07_15_2020.pptx
SERC at Carleton College
 
Cretaceous Coatlines and Modern Voting Patterns Presentation
Cretaceous Coatlines and Modern Voting Patterns PresentationCretaceous Coatlines and Modern Voting Patterns Presentation
Cretaceous Coatlines and Modern Voting Patterns Presentation
SERC at Carleton College
 
Presentation: Unit 1 Introduction to the hydrological cycle
Presentation: Unit 1 Introduction to the hydrological cyclePresentation: Unit 1 Introduction to the hydrological cycle
Presentation: Unit 1 Introduction to the hydrological cycle
SERC at Carleton College
 
KSKL_Chapter 4_ Chem Properties of Soils.pptx
KSKL_Chapter 4_ Chem Properties of Soils.pptxKSKL_Chapter 4_ Chem Properties of Soils.pptx
KSKL_Chapter 4_ Chem Properties of Soils.pptx
SERC at Carleton College
 

More from SERC at Carleton College (20)

StatVignette03_Sig.Figs_v04_07_15_2020.pptx
StatVignette03_Sig.Figs_v04_07_15_2020.pptxStatVignette03_Sig.Figs_v04_07_15_2020.pptx
StatVignette03_Sig.Figs_v04_07_15_2020.pptx
 
StatVignette06_HypTesting.pptx
StatVignette06_HypTesting.pptxStatVignette06_HypTesting.pptx
StatVignette06_HypTesting.pptx
 
Unit 1 (optional slides)
Unit 1 (optional slides)Unit 1 (optional slides)
Unit 1 (optional slides)
 
Cretaceous Coatlines and Modern Voting Patterns Presentation
Cretaceous Coatlines and Modern Voting Patterns PresentationCretaceous Coatlines and Modern Voting Patterns Presentation
Cretaceous Coatlines and Modern Voting Patterns Presentation
 
Climate and Biomes PPT 2
Climate and Biomes PPT 2Climate and Biomes PPT 2
Climate and Biomes PPT 2
 
weather tracking ppt
weather tracking pptweather tracking ppt
weather tracking ppt
 
Presentation: Unit 1 Introduction to the hydrological cycle
Presentation: Unit 1 Introduction to the hydrological cyclePresentation: Unit 1 Introduction to the hydrological cycle
Presentation: Unit 1 Introduction to the hydrological cycle
 
StatVignette05_M3_v02_10_21_2020.pptx
StatVignette05_M3_v02_10_21_2020.pptxStatVignette05_M3_v02_10_21_2020.pptx
StatVignette05_M3_v02_10_21_2020.pptx
 
KSKL chapter 8 PPT
KSKL chapter 8 PPTKSKL chapter 8 PPT
KSKL chapter 8 PPT
 
KSKL chap 5 PPT
KSKL chap 5 PPTKSKL chap 5 PPT
KSKL chap 5 PPT
 
KSKL_Chapter 4_ Chem Properties of Soils.pptx
KSKL_Chapter 4_ Chem Properties of Soils.pptxKSKL_Chapter 4_ Chem Properties of Soils.pptx
KSKL_Chapter 4_ Chem Properties of Soils.pptx
 
Degraded Soil Images.pptx
Degraded Soil Images.pptxDegraded Soil Images.pptx
Degraded Soil Images.pptx
 
Educators PPT file chapter 7
Educators PPT file chapter 7Educators PPT file chapter 7
Educators PPT file chapter 7
 
Educators PPT file chapter 2
Educators PPT file chapter 2Educators PPT file chapter 2
Educators PPT file chapter 2
 
Educators PPT file chapter 6
Educators PPT file chapter 6Educators PPT file chapter 6
Educators PPT file chapter 6
 
Educators PPT chapter 3
Educators PPT chapter 3Educators PPT chapter 3
Educators PPT chapter 3
 
Unit 4 background presentation
Unit 4 background presentationUnit 4 background presentation
Unit 4 background presentation
 
Presentation: Unit 3 background information
Presentation: Unit 3 background informationPresentation: Unit 3 background information
Presentation: Unit 3 background information
 
Presentation: Unit 2 Measuring Groundwater Background Information
Presentation: Unit 2 Measuring Groundwater Background InformationPresentation: Unit 2 Measuring Groundwater Background Information
Presentation: Unit 2 Measuring Groundwater Background Information
 
Introduction to GPS presentation
Introduction to GPS presentationIntroduction to GPS presentation
Introduction to GPS presentation
 

Unit 2 Introductory PPT Slides

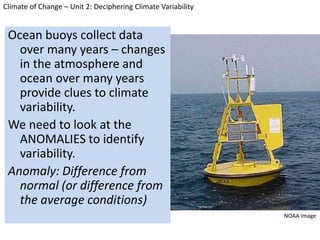
  • 1. Ocean buoys collect data over many years – changes in the atmosphere and ocean over many years provide clues to climate variability. We need to look at the ANOMALIES to identify variability. Anomaly: Difference from normal (or difference from the average conditions) Climate of Change – Unit 2: Deciphering Climate Variability NOAA Image
  • 2. The TAO/TRITON buoys are in an area of the Pacific where there are few islands or ships to collect weather data. Japan maintains 15 of the buoys (labeled TRITON below). The other 55 are maintained by the United States, through the National Data Buoy Center, which is a division of NOAA. Climate of Change – Unit 2: Deciphering Climate Variability NOAA Image
  • 3. Instruments on the TAO/TRITON buoys measure sea-surface temperature, wind speed and direction, relative humidity, air temperature, and subsurface temperatures in the upper 500 meters of the ocean. The buoys are moored in place with an anchor. Climate of Change – Unit 2: Deciphering Climate Variability NOAA Image
  • 4. Six to eight times a year, scientists and technicians go out on the NOAA ship Ka’imimoana to repair and replace buoys along different sections of the array. Climate of Change – Unit 2: Deciphering Climate Variability NOAA Image
  • 5. (Averages) Arrows depict wind strength and direction (longer arrow = stronger wind) TAO/TRITON Monthly Sea Surface Temp (SST) in °C and Winds (m/s2) Long arrows indicate wind is stronger than average (and in same direction) Short arrows indicate wind is similar to the long-term average Climate of Change – Unit 2: Deciphering Climate Variability

Editor's Notes

  1. About seventy TAO/TRITON buoys collect meteorological data in the equatorial Pacific Ocean between the Galapagos Islands and New Guinea. Scientists retrieve the data in real time via satellite.
  2. Use this slide to introduce students to the type of data they will be looking at. The most difficult aspects of interpreting these maps lie in understanding wind anomalies. Without going into the definition of a vector, indicate to students that they should understand that the length of the wind anomaly error tells us about the size of the anomaly, and that the direction of the anomaly arrow tells us how the wind direction is different from normal or average.