Correlations about random_walks
•Download as PPTX, PDF•
3 likes•1,013 views

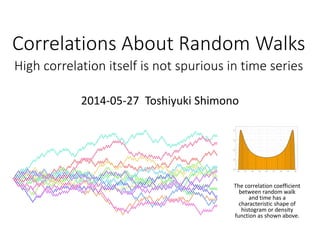
The correlation coefficient between random walk and time has a characteristic shape of histogram or density function. Some findings has been revealed and it is desirable to be investigated more.

Recommended
More Related Content
Viewers also liked
Viewers also liked (19)
Similar to Correlations about random_walks
Similar to Correlations about random_walks (20)
More from Toshiyuki Shimono
More from Toshiyuki Shimono (20)
Recently uploaded
Recently uploaded (20)
Correlations about random_walks
- 1. Correlations About Random Walks A (single) corr. coef. > .8 or .9 unnecessary means high degree of relationship in time series 2014-06-06 Toshiyuki Shimono The correlation coefficient between two independt random walks has a characteristic shape of histogram or density function as shown above. A random walk is defined as its each increment at each time step is +1 or -1 with each probability 50%.
- 2. Random walks are various. And their correlation coefficients have a broad distribution even if they are just chosen `randomly’.
- 3. Remarks for time series analysis • Very often, random walks have very high correlation coefficients ρ such as > 0.8 or 0.9. • Thus, unless you know well about how numerals moves (such as economic indexes), do not take ρ as some relation degree. • High correlations in multiple may mean significant deviation from just a random chance, but some rigid methodology to detect that significance is desirable.
- 4. § Numerical Calculations To investigate the distributions of correlation coefficients (1) between random walks and time, and also (2) between two independent random walks, Monte Carlo approach was employed and trillions of random variables are yielded from Mersenne Twister.
- 5. The density functions for (1) corr. coef. of random walk and time (2) corr. coef. of two independent random walks • Mersenne Twister produced trillions of random variables to calculate billions of random walks here. • Each of vertical segments inside indicates 1.25% percentiles. 0.3099.. 1.018..1.018.. 0.6054..
- 6. Main stats. • The two distributions seems to have the modes at ±0.910.. and 0, respectively. • The two distributions have the variances of 0.4341..=0.659..2 and 0.2405.. =0.490..2, respectively. • When only their positive parts are considered, the two distributions have the medians of 0.6613.. and 0.4136.., respectively. • For 0 < ε << 1, the density functions seems to be approximated as exp(negative const. ÷ ε2).
- 7. Probabilities, percentiles For the correlation coefficients btw. r.w. and time : The probability being over 0.6 is 0.2823.. ≈ sin(0.6)/2 The probability being over 0.8 is 0.1582.. ≈ 1/401/2 The probability being over 0.81 is 0.1501.. The probability being over 0.8669.. ( ≈ π -1/8 ) is 0.1 For the correlation coefficients btw. two r.w. : The prob. being over 0.4529 or below -0.4529 is 0.4529.. The 99.5 percentile is 0.9051.. The 99.95 percentile is 0.9481.. The 99.995 percentile is 0.9670.. The 99.9995 percentile is 0.9771.. The density function at 0 is 0.6055.. ≈ π -1/6 /2
- 8. Conclusions and summary • The correlation coefficients above have wide distributions and their shapes are characteristic, which may have grave concerns about time series analysis. • The convergence behavior depends also on the length L of random walks, and L=512, 1024, 2048 are used to analyze the convergence, which is not well presented in this document. • Quadrillions (1015) of random numbers are desirable to determine more digits. Then we can easily compare discovered numerals and some meaningful mathematical numbers. • Mathematical analysis is desirable to determine the density functions of the distributions — as a matter of course! — and for establishing some new hypothesis tests.
- 9. Appendix. • Raw data from calculations are presented here for the further analysis in the future.
- 10. Percentile Tables Percentile tables of the absolute value of the correlation coefficients (1) between random walk and time (2) between two independent random walks +0% +1% +2% +3% +4% +5% +6% +7% +8% +9% 0% 0.00000 0.01613 0.03224 0.04834 0.06441 0.08044 0.09643 0.11234 0.12820 0.14400 10% 0.15971 0.17533 0.19085 0.20626 0.22156 0.23674 0.25178 0.26670 0.28148 0.29611 20% 0.31059 0.32491 0.33907 0.35307 0.36686 0.38053 0.39401 0.40731 0.42043 0.43335 30% 0.44610 0.45865 0.47101 0.48319 0.49518 0.50698 0.51858 0.53000 0.54123 0.55220 40% 0.56307 0.57371 0.58418 0.59445 0.60455 0.61446 0.62419 0.63374 0.64312 0.65232 50% 0.66135 0.67021 0.67891 0.68742 0.69580 0.70400 0.71209 0.71997 0.72772 0.73533 60% 0.74279 0.75011 0.75729 0.76434 0.77126 0.77805 0.78471 0.79126 0.79769 0.80400 70% 0.81020 0.81629 0.82228 0.82817 0.83396 0.83966 0.84528 0.85080 0.85625 0.86161 80% 0.86691 0.87213 0.87727 0.88239 0.88745 0.89245 0.89742 0.90236 0.90729 0.91222 90% 0.91713 0.92207 0.92707 0.93211 0.93732 0.94268 0.94834 0.95437 0.96114 0.96960 +0% +1% +2% +3% +4% +5% +6% +7% +8% +9% 0% 0.00000 0.00826 0.01652 0.02477 0.03303 0.04129 0.04955 0.05781 0.06607 0.07432 10% 0.08258 0.09084 0.09910 0.10736 0.11562 0.12387 0.13213 0.14039 0.14865 0.15691 20% 0.16516 0.17342 0.18168 0.18994 0.19820 0.20647 0.21475 0.22297 0.23125 0.23951 30% 0.24778 0.25605 0.26431 0.27258 0.28085 0.28913 0.29740 0.30568 0.31396 0.32225 40% 0.33053 0.33882 0.34712 0.35541 0.36372 0.37202 0.38034 0.38865 0.39699 0.40530 50% 0.41364 0.42199 0.43034 0.43870 0.44707 0.45545 0.46384 0.47225 0.48067 0.48910 60% 0.49755 0.50596 0.51444 0.52294 0.53147 0.54001 0.54858 0.55717 0.56578 0.57443 70% 0.58310 0.59181 0.60057 0.60936 0.61820 0.62708 0.63602 0.64502 0.65408 0.66321 80% 0.67243 0.68171 0.69113 0.70064 0.71025 0.72001 0.72991 0.73999 0.75026 0.76080 90% 0.77159 0.78270 0.79419 0.80615 0.81872 0.83208 0.84649 0.86252 0.88111 0.90511
- 11. (1) Frequency distribution table of the absolute value of the correlation coefficient between random walks with the length 2048 and time. 1019620 1018456 1019738 1019155 1019477 1018350 1017541 1018397 1019744 1019610 1020347 1019912 1019809 1019366 1020079 1018360 1018681 1019116 1019079 1019001 1019518 1019547 1020546 1021081 1019455 1019470 1020458 1021345 1020650 1019621 1019112 1019295 1020733 1019688 1022002 1021391 1020548 1021067 1021078 1022718 1021095 1020390 1019218 1021225 1021311 1020060 1021508 1020667 1020830 1021836 1021070 1021211 1022527 1021645 1023239 1023166 1021930 1022523 1023502 1024473 1024305 1022056 1023056 1022534 1023513 1023531 1024793 1026272 1026001 1022309 1026272 1023789 1025114 1025317 1024976 1026933 1025946 1026098 1025811 1026435 1025826 1026637 1029633 1028261 1028735 1027057 1027797 1026614 1029649 1028241 1027701 1029665 1030240 1027753 1028782 1030491 1030782 1030562 1028729 1031417 1033709 1030921 1031445 1033754 1032794 1031375 1032197 1032499 1032132 1031421 1032555 1033543 1033550 1034419 1034122 1032093 1034654 1035163 1033929 1037131 1036494 1034059 1036326 1037575 1038153 1037274 1036146 1036807 1037303 1038107 1039338 1040173 1040556 1040382 1039625 1040280 1040100 1041068 1041691 1043562 1042532 1042069 1042436 1042148 1043099 1042086 1044459 1046082 1044850 1044888 1047343 1046047 1048240 1047091 1045741 1048560 1047772 1047058 1048822 1050309 1048703 1050823 1051253 1049533 1052499 1052546 1053606 1053034 1052275 1051661 1056236 1052759 1053434 1054605 1054334 1054020 1056833 1057423 1058973 1057032 1058056 1058963 1059421 1058578 1060704 1059608 1059539 1061166 1061685 1061159 1062106 1063769 1063745 1065263 1064796 1065495 1066731 1067584 1065760 1066769 1068070 1068484 1069055 1068024 1070818 1070352 1070109 1070013 1072269 1071028 1073649 1072594 1072980 1074294 1075129 1075806 1075019 1076992 1078148 1077343 1078951 1078516 1080848 1079582 1080749 1081447 1081551 1082712 1083700 1083152 1084803 1085095 1082925 1085504 1085283 1086378 1088155 1088424 1089137 1090628 1090799 1089186 1091221 1091906 1091694 1092715 1092893 1094858 1095747 1096318 1097490 1096154 1098707 1097288 1097382 1099086 1100040 1100519 1099518 1101054 1102503 1103333 1103658 1103856 1105156 1106132 1105660 1109061 1108467 1109499 1110872 1110847 1111557 1112162 1112556 1114053 1114101 1113925 1115736 1116481 1118224 1116995 1117900 1119752 1119585 1119042 1122251 1122137 1123300 1124318 1125160 1123681 1126525 1127324 1126790 1129528 1130610 1130738 1129987 1133291 1131982 1131725 1133912 1135644 1135481 1137945 1136920 1139356 1140525 1139470 1142254 1141403 1142360 1143298 1145012 1146459 1148298 1147724 1149591 1148753 1149575 1152581 1151617 1154869 1155118 1156084 1155695 1155700 1158834 1157880 1158968 1160671 1163644 1162596 1162512 1164970 1164132 1165949 1168239 1166459 1168200 1171821 1170300 1171059 1175069 1175622 1174738 1175520 1177481 1178685 1178487 1179504 1181312 1182041 1184233 1183005 1186438 1188274 1188039 1188596 1188338 1188686 1192499 1193059 1193681 1193040 1196011 1197845 1198278 1200140 1200867 1201048 1201823 1201061 1206944 1204999 1207545 1208653 1209357 1210887 1214353 1213387 1213720 1215466 1216799 1219687 1219443 1219734 1221558 1222195 1223611 1226210 1228193 1227654 1228528 1228497 1231377 1231343 1233294 1235682 1237632 1236926 1241212 1239849 1241362 1241302 1243785 1246767 1247260 1247620 1252068 1250845 1249784 1252288 1253650 1255576 1254233 1258708 1262308 1260610 1261835 1264601 1264239 1266931 1267729 1267969 1271352 1272267 1273516 1276337 1277413 1276835 1279130 1281166 1281580 1282391 1284378 1286542 1288096 1289425 1291206 1291932 1293670 1297836 1294697 1299593 1300400 1303067 1304431 1305987 1305997 1307128 1309985 1310938 1311981 1314540 1315581 1315918 1318525 1321221 1323456 1325671 1323388 1327085 1330222 1328215 1332475 1333722 1334190 1338571 1341374 1342023 1342593 1344016 1346613 1347995 1350556 1350784 1352793 1354471 1353940 1359186 1359342 1362516 1363632 1365313 1367202 1369560 1371489 1373800 1374657 1376567 1376506 1380355 1379439 1384565 1386517 1388170 1386861 1390212 1392875 1394336 1394963 1399760 1400844 1402633 1405954 1405364 1410066 1409573 1411195 1414103 1415658 1417761 1420225 1421699 1423842 1426929 1429367 1427795 1432786 1433991 1436107 1437767 1441500 1442971 1445129 1448170 1450159 1451211 1456817 1457598 1459439 1457458 1462304 1463576 1468024 1470885 1471180 1473615 1477202 1479343 1480004 1481983 1487173 1489321 1489809 1492525 1493309 1497054 1499010 1500525 1504545 1506445 1509187 1511675 1517664 1513692 1517139 1521545 1524736 1528130 1528361 1530110 1535045 1536858 1539719 1540392 1543855 1546674 1550009 1550232 1554783 1557929 1559440 1562551 1563919 1566408 1570831 1573716 1575769 1577835 1580930 1583800 1587090 1589652 1592727 1595346 1596346 1600392 1602019 1604271 1609929 1610592 1614406 1617392 1621755 1622898 1624370 1630182 1630647 1632966 1639154 1639340 1644156 1647112 1650309 1651082 1654411 1659027 1660057 1663337 1666945 1672059 1673767 1676320 1678428 1682378 1687219 1690133 1694202 1696372 1697631 1702335 1705914 1711574 1710433 1717408 1717416 1723086 1727496 1729179 1733666 1733956 1740377 1743970 1749002 1748886 1752711 1755717 1761419 1763717 1768700 1772192 1775050 1777931 1781245 1784183 1790027 1792050 1797049 1801796 1804006 1808202 1811984 1817446 1821268 1824696 1824392 1831186 1835037 1838804 1841845 1845645 1848759 1853458 1857762 1862511 1866573 1871983 1874851 1876137 1881559 1886773 1890268 1894677 1900680 1904709 1908236 1913211 1913034 1920603 1924798 1927620 1930594 1937425 1938352 1945097 1954048 1955831 1958948 1962521 1967907 1971442 1975260 1980885 1987707 1990078 1994118 2000055 2003072 2009842 2014837 2020844 2022598 2028430 2034602 2041426 2044923 2049009 2051383 2060246 2060582 2068024 2071934 2078105 2083224 2087368 2091707 2100935 2102252 2111137 2114104 2115165 2121472 2126778 2134825 2139363 2145140 2149979 2154203 2162879 2164330 2171650 2177662 2182964 2187868 2196966 2199655 2206118 2212028 2218123 2222203 2229697 2234665 2242511 2245926 2252731 2258276 2262731 2266241 2276098 2281441 2286438 2293722 2299938 2308226 2310105 2317941 2327877 2331710 2337445 2343040 2348811 2354375 2359217 2364165 2372552 2379400 2385423 2393273 2399144 2407579 2413328 2422613 2426746 2432245 2440084 2446358 2453091 2460162 2466987 2475121 2482196 2488553 2495182 2502213 2510799 2512703 2523662 2528847 2534397 2546192 2550425 2556314 2566965 2569673 2581276 2587941 2595668 2602372 2608327 2616313 2620660 2633008 2637000 2646622 2654005 2660152 2668314 2677096 2684334 2692197 2699336 2708523 2713880 2723233 2729795 2740056 2749073 2753503 2760238 2770334 2779281 2788502 2797588 2805028 2810968 2819312 2827186 2834632 2847298 2849975 2858001 2865241 2873872 2881612 2891364 2897316 2906051 2915662 2925039 2931468 2938221 2946368 2954909 2964535 2976417 2981853 2989354 3000342 3004735 3012420 3022217 3027646 3038428 3048836 3056418 3058399 3071327 3075200 3083495 3094143 3104300 3110429 3117596 3124921 3132622 3140672 3149001 3159129 3163757 3171908 3178414 3183536 3192464 3202692 3204999 3211302 3220440 3224716 3234436 3240862 3248559 3253107 3256734 3266232 3269553 3276791 3281574 3284820 3291998 3299230 3301777 3306552 3311355 3316281 3319520 3324962 3327553 3330382 3331092 3338454 3336112 3343407 3341872 3345542 3344519 3344062 3344898 3345962 3344181 3346576 3345864 3345186 3340937 3337262 3334591 3329499 3325985 3318835 3317818 3309915 3303608 3296835 3288824 3276803 3271487 3257238 3248364 3233763 3223480 3206270 3191316 3179456 3158888 3141222 3124000 3103848 3080106 3057122 3034750 3009903 2981071 2949014 2925134 2889476 2859045 2823399 2787136 2750366 2710319 2668410 2623400 2580513 2534892 2483823 2434780 2377697 2323529 2266577 2206739 2144049 2076274 2013411 1943951 1873649 1796018 1723241 1642958 1567465 1487130 1401459 1317890 1233507 1146685 1056530 970443 883803 794925 710598 623934 543759 464832 390442 320485 256043 198816 147822 104250 69854 42988 23419 11265 4186 1136 190 12 0 0 Each of the integer part of the value times 1000 which ranges from 0 to 999 are counted. The counted number are arranged from left to right then top to bottom in 25x40 table form. The whole number is 1,644,000,000.
- 12. (2) Frequency distribution table of the absolute value of the correlation coefficient between two independent random walks with the lengths 2048. 2670506 2667800 2669087 2670212 2671105 2671604 2669255 2667542 2668964 2669612 2671668 2674404 2670966 2669501 2667456 2669375 2668526 2668789 2671883 2667989 2664272 2668323 2665721 2667733 2668242 2669600 2670119 2668185 2666356 2668084 2670759 2669235 2663748 2666588 2667300 2667838 2672344 2669755 2672154 2667782 2667574 2672602 2669717 2672871 2667977 2667807 2670580 2668612 2667639 2667654 2665703 2666537 2668696 2666316 2668744 2669663 2667864 2667257 2669367 2665722 2665675 2672237 2668861 2666813 2668482 2669814 2667583 2667192 2667804 2669969 2667400 2671099 2668821 2669170 2668805 2668996 2668855 2669799 2671140 2668060 2669786 2670402 2665861 2666843 2669024 2667830 2669509 2667474 2668825 2669659 2666548 2670933 2667597 2670690 2666825 2666655 2669251 2668134 2667791 2665317 2671228 2667345 2667821 2671365 2667693 2669223 2670530 2667892 2669356 2669464 2668098 2667187 2669406 2669545 2671074 2671960 2668665 2667095 2667287 2668990 2669127 2668833 2666344 2669438 2665977 2668023 2670216 2667733 2669556 2670605 2670257 2670989 2668403 2666887 2667441 2669254 2667197 2670650 2668912 2669237 2669784 2666284 2665103 2668031 2668143 2669750 2670035 2667108 2667273 2665861 2665997 2669987 2668834 2669384 2667305 2667018 2669692 2670671 2669546 2670981 2668321 2668669 2667932 2668568 2667106 2666871 2668206 2669172 2666022 2668120 2669285 2668254 2667619 2667437 2665593 2668940 2666796 2671563 2667115 2671315 2668899 2666276 2665629 2672164 2671898 2669476 2668780 2662913 2670192 2668711 2667894 2667855 2665698 2667488 2670859 2666162 2668303 2668693 2665854 2667268 2663158 2668152 2668592 2667789 2665316 2668965 2665940 2665478 2666167 2667792 2668793 2668771 2666986 2665089 2666246 2665129 2666909 2666149 2668703 2664621 2666500 2667837 2665853 2668269 2665902 2666131 2669083 2669591 2665613 2665281 2664040 2666104 2667910 2664571 2665049 2665734 2667456 2667315 2665556 2667001 2667254 2663699 2667389 2666057 2669624 2665998 2663742 2663551 2665320 2664534 2665950 2664989 2663181 2665859 2665906 2665214 2666618 2668358 2662840 2665280 2664423 2664085 2667451 2666584 2664202 2664721 2663286 2666740 2664189 2665478 2666045 2660116 2663621 2664242 2666120 2666580 2666502 2665022 2665407 2669646 2665131 2667472 2664593 2664114 2661951 2662716 2664505 2665096 2662288 2663382 2663173 2662939 2662324 2661233 2661708 2661007 2661097 2661996 2660775 2662808 2661876 2660149 2661492 2661318 2663391 2659810 2661059 2661063 2659404 2664101 2663154 2658797 2664068 2662179 2657954 2659171 2663464 2660778 2658459 2657364 2659906 2658314 2661466 2657176 2656840 2656970 2660899 2659135 2661254 2657358 2657425 2657098 2658181 2656905 2656942 2658409 2656690 2660136 2655405 2656178 2656994 2658707 2655752 2659946 2656527 2659380 2657614 2657129 2654391 2656803 2657256 2657853 2654387 2655920 2655363 2653698 2659302 2651485 2654862 2652439 2652125 2652099 2656718 2653945 2655723 2651139 2655066 2652894 2653305 2654695 2652338 2650916 2652020 2650271 2653118 2652719 2652371 2650986 2649077 2650740 2648679 2652060 2651974 2651978 2649555 2649492 2650468 2649585 2646179 2645337 2650280 2648815 2646437 2648314 2647809 2650440 2650515 2646686 2645995 2648438 2647877 2645887 2647546 2643208 2644879 2647318 2642381 2645152 2642179 2643155 2644566 2643189 2641815 2643996 2642635 2643447 2644538 2641788 2645302 2642536 2638800 2641313 2638941 2642417 2642051 2639671 2638615 2639095 2640825 2637872 2633845 2636863 2637290 2634461 2639375 2637471 2636895 2634194 2635154 2633566 2631998 2635428 2631380 2631751 2632640 2632802 2632199 2631878 2632496 2628487 2630080 2627997 2630518 2626783 2629735 2627790 2626441 2629195 2626593 2627912 2624219 2626579 2626068 2623560 2625326 2622655 2621401 2619802 2623467 2625114 2619823 2620282 2621685 2621251 2618827 2621568 2620764 2621609 2619817 2616483 2617983 2618030 2614415 2614465 2613538 2614232 2614784 2614190 2612332 2610562 2611745 2609407 2611607 2609352 2612786 2607859 2610710 2606156 2603763 2606445 2606861 2603995 2605296 2604920 2601267 2605866 2601444 2601780 2599149 2601184 2599248 2598806 2596743 2600273 2598459 2594348 2592653 2591766 2594943 2593889 2590293 2591324 2589280 2594115 2590170 2589805 2585785 2586355 2589032 2584785 2586582 2585200 2582173 2582526 2579754 2581052 2580202 2581259 2576912 2578090 2576927 2577939 2578071 2576703 2573529 2572748 2570149 2573616 2571402 2574087 2567918 2570019 2569651 2564989 2563725 2567089 2562480 2564833 2560292 2558489 2557719 2560964 2561180 2558558 2554498 2553545 2554627 2553401 2553108 2551721 2549655 2547557 2545353 2542800 2543668 2540577 2544667 2538353 2540532 2537605 2540702 2538967 2536198 2530461 2535777 2534187 2533661 2530646 2530418 2527894 2527099 2526272 2523830 2522072 2521937 2521583 2521729 2519298 2516312 2514485 2512201 2513777 2510648 2510624 2505796 2506975 2504434 2503835 2500077 2501634 2500968 2498910 2496831 2494260 2492218 2491705 2491318 2487914 2487604 2484993 2482436 2480616 2480837 2478771 2478692 2475445 2476513 2472403 2472216 2472583 2467095 2465696 2462663 2461993 2459273 2457074 2455621 2454629 2455062 2451887 2450259 2452017 2445645 2443228 2443120 2438633 2437276 2437667 2436242 2431242 2430466 2428301 2425498 2421714 2423616 2421030 2417315 2413585 2413045 2408720 2407958 2408040 2405240 2401138 2399493 2399540 2394467 2391988 2390715 2387817 2386763 2386239 2381935 2376248 2377612 2374968 2368455 2370800 2367525 2367235 2360439 2359677 2357213 2351608 2349480 2349545 2344973 2343766 2338880 2334861 2336912 2334397 2330775 2326693 2323688 2319830 2317820 2313950 2312664 2310808 2307511 2304535 2299462 2294820 2297540 2291189 2286959 2283922 2281104 2280729 2273435 2269812 2268737 2262064 2260671 2259422 2254243 2251741 2247436 2245851 2240314 2234477 2232739 2231139 2224386 2223080 2216480 2217824 2211294 2207481 2201639 2199879 2195212 2193448 2187206 2181879 2180163 2174582 2172585 2168280 2163794 2158451 2154792 2150967 2147494 2146296 2137218 2131981 2128891 2123638 2120560 2117445 2109866 2104700 2100048 2097783 2092168 2085302 2081641 2080296 2073302 2067951 2061723 2057345 2053581 2048858 2042222 2036133 2030608 2025894 2020826 2014195 2011389 2004646 2000201 1995002 1989127 1979622 1977689 1971478 1967473 1961388 1954379 1949811 1941506 1932891 1930389 1922986 1921722 1910083 1907424 1901199 1893551 1886629 1882157 1873622 1869000 1861504 1852338 1847080 1839329 1833010 1823988 1818271 1809887 1808857 1797928 1790935 1783114 1775976 1768085 1762200 1752206 1746471 1739495 1732281 1723723 1716785 1707760 1699628 1691554 1683811 1673125 1668560 1658173 1649934 1643920 1634828 1625016 1617211 1609113 1601067 1590880 1581066 1571606 1565245 1553902 1542654 1536457 1525198 1517525 1509891 1496975 1487894 1479854 1467829 1457218 1450267 1436824 1428719 1419234 1408649 1399939 1389480 1378329 1367001 1359596 1348065 1336936 1324817 1314191 1304867 1291096 1282243 1272258 1260605 1248442 1235685 1224077 1214842 1200217 1190741 1176515 1167320 1155080 1140278 1129850 1118126 1107184 1093695 1080206 1066121 1055857 1044963 1030714 1016494 1005667 993463 980620 967607 952577 940039 926759 914242 902386 889650 874066 860195 846871 833427 818575 807486 793371 778810 765201 751795 736937 723201 708986 696152 681654 669400 654521 639953 626091 612201 595431 583741 570819 556296 542086 528511 515773 500883 485506 472182 459136 444646 431718 418309 405069 390986 377260 363800 351054 337609 325743 313019 300552 288760 275771 263457 251740 240493 227610 216254 205722 195900 184421 172445 163942 152964 143630 134076 125921 116736 107618 99371 91782 83988 76500 69782 63494 56948 50720 45805 40651 35715 31110 26602 23525 20039 17030 14092 11767 9544 7672 6095 4724 3607 2678 1950 1390 939 606 421 206 101 61 27 13 2 1 0 0 0 0 0 0 0 Each of the integer part of the value times 1000 which ranges from 0 to 999 are counted. The counted number are arranged from left to right then top to bottom in 25x40 table form. The whole number is 2,204,000,000.