Saltar al contenido principal
1
2
Denise Morrison
President & Chief Executive Officer
Campbell Soup Company
2015
CAGNY
Presentation
3
CHANGES
UNDERWAY
Far reaching implications
4
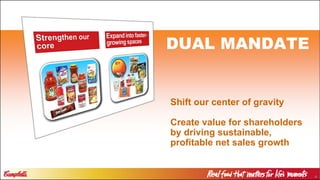
Shift our center of gravity
Create value for shareholders
by driving sustainable,
profitable net sales growth
DUAL MANDATE
5
TRENDS AND
DYNAMICS IN FOOD
6
Redefining the framework
of our relationships with
our customers and consumers
SEISMIC SOCIAL
SHIFTS
7
REVOLUTIONARY CHANGES
IN THE DEFINITION AND
COMPOSITION OF THE
FAMILY
Increasing diversity,
new economic realities and
powerful social transformations
8
CONSUMER PREFERENCES
AND PRIORITIES WITH
RESPECT TO FOOD
9
IMPACT OF DIGITAL
TECHNOLOGIES AND
E-COMMERCE
10
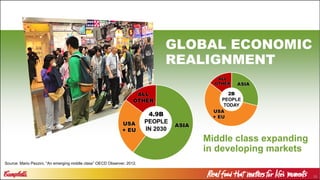
Middle class expanding
in developing markets
GLOBAL ECONOMIC
REALIGNMENT
ASIA
USA
+ EU
2B
PEOPLE
TODAY
ALL
OTHER
ASIAUSA
+ EU
4.9B
PEOPLE
IN 2030
ALL
OTHER
Source: Mario Pezzini, “An emerging middle class” OECD Observer, 2012.
11
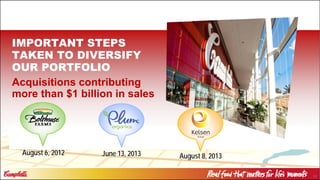
IMPORTANT STEPS
TAKEN TO DIVERSIFY
OUR PORTFOLIO
Acquisitions contributing
more than $1 billion in sales
August 6, 2012 June 13, 2013 August 8, 2013
12
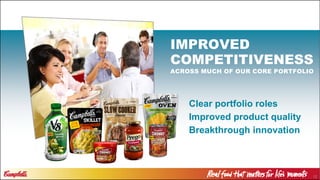
Clear portfolio roles
Improved product quality
Breakthrough innovation
IMPROVED
COMPETITIVENESS
ACROSS MUCH OF OUR CORE PORTFOLIO
13
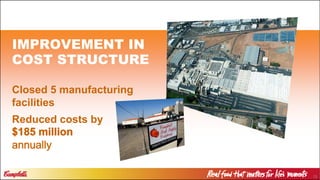
Closed 5 manufacturing
facilities
Reduced costs by
IMPROVEMENT IN
COST STRUCTURE
1414
15
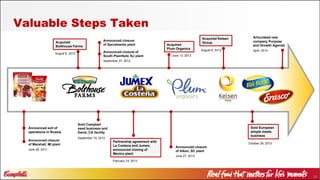
Valuable Steps Taken
Announced closure
of Marshall, MI plant
Announced exit of
operations in Russia
Sold Campbell
seed business and
Davis, CA facility
Announced closure of
South Plainfield, NJ plant
Partnership agreement with
La Costena and Jumex;
announced closing of
Mexico plant
Acquired
Plum Organics
Acquired
Bolthouse Farms
Announced closure
of Aiken, SC plant
Acquired Kelsen
Group
Articulated new
company Purpose
and Growth Agenda
Sold European
simple meals
business
Announced closure
of Sacramento plant
June 28, 2011
August 6, 2012
September 27, 2012
June 13, 2013
April, 2014
October 28, 2013
August 8, 2013
June 27, 2013
February 14, 2013
September 19, 2012
16
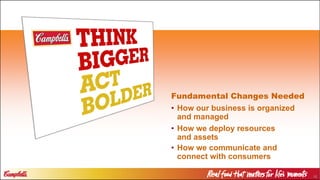
Fundamental Changes Needed
• How our business is organized
and managed
• How we deploy resources
and assets
• How we communicate and
connect with consumers
17
A game-changing
development in Campbell’s evolution
HOW OUR BUSINESS
IS ORGANIZED AND
MANAGED
18
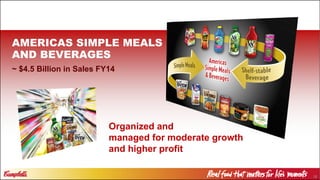
Organized and
managed for moderate growth
and higher profit
AMERICAS SIMPLE MEALS
AND BEVERAGES
~ $4.5 Billion in Sales FY14
19
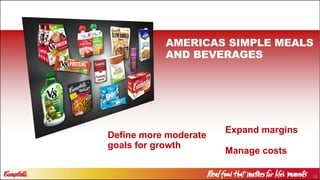
AMERICAS SIMPLE MEALS
AND BEVERAGES
Define more moderate
goals for growth
Expand margins
Manage costs
20
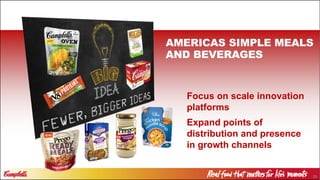
Focus on scale innovation
platforms
Expand points of
distribution and presence
in growth channels
AMERICAS SIMPLE MEALS
AND BEVERAGES
21
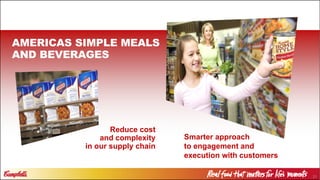
AMERICAS SIMPLE MEALS
AND BEVERAGES
Smarter approach
to engagement and
execution with customers
Reduce cost
and complexity
in our supply chain
22
Pivotal change
in our structure
GLOBAL BISCUITS
AND SNACKS
~ $2.8 Billion in Sales FY14
23
Unlock potential
Leverage portfolio scale
GLOBAL BISCUITS
AND SNACKS
24
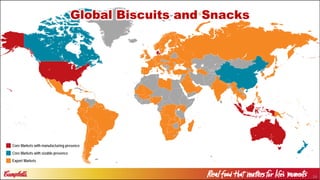
Global Biscuits and Snacks
Core Markets with sizable presence
Export Markets
Core Markets with manufacturing presence
25
PACKAGED FRESH
~ $1 Billion in Sales FY14
CONTINUE TO DELIVER ROBUST SALES
PERFORMANCE IN BOLTHOUSE FARMS
26
Super-premium
cold pressed beverages
PACKAGED FRESH
27
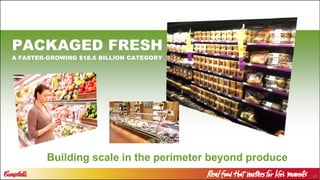
Building scale in the perimeter beyond produce
PACKAGED FRESH
A FASTER-GROWING $18.6 BILLION CATEGORY
28
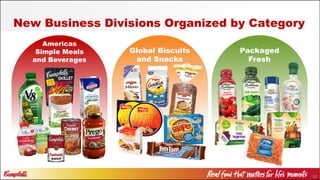
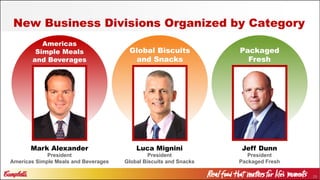
New Business Divisions Organized by Category
Americas
Simple Meals
and Beverages
Global Biscuits
and Snacks
Packaged
Fresh
29
New Business Divisions Organized by Category
Mark Alexander
President
Americas Simple Meals and Beverages
Luca Mignini
President
Global Biscuits and Snacks
Jeff Dunn
President
Packaged Fresh
Americas
Simple Meals
and Beverages
Global Biscuits
and Snacks
Packaged
Fresh
30
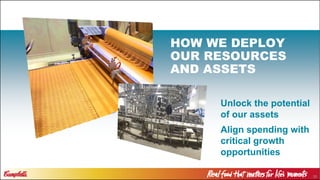
Unlock the potential
of our assets
Align spending with
critical growth
opportunities
HOW WE DEPLOY
OUR RESOURCES
AND ASSETS
31
Clean sheet of paper
Unlock funds for growth
REEXAMINING
OUR COSTS
32
UNLOCK THE POWER OF OUR
HUMAN RESOURCES & ASSETS
33
CONNECT
WITH
CONSUMERS
34
GAME CHANGING
DEVELOPMENTS
FOR CAMPBELL
35
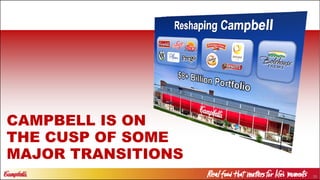
CAMPBELL IS ON
THE CUSP OF SOME
MAJOR TRANSITIONS
36
Anthony DiSilvestro
Senior Vice President – Chief Financial Officer
Campbell Soup Company
2015
CAGNY
Presentation
37
• Fiscal 2015 guidance
• Enabling our strategies
– Three new divisions
– Cost-reduction program
• Priorities for uses of cash
Agenda
38
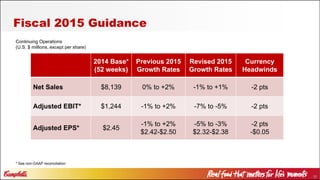
Fiscal 2015 Guidance
* See non-GAAP reconciliation
2014 Base*
(52 weeks)
Previous 2015
Growth Rates
Revised 2015
Growth Rates
Currency
Headwinds
Net Sales $8,139 0% to +2% -1% to +1% -2 pts
Adjusted EBIT* $1,244 -1% to +2% -7% to -5% -2 pts
Adjusted EPS* $2.45
-1% to +2%
$2.42-$2.50
-5% to -3%
$2.32-$2.38
-2 pts
-$0.05
Continuing Operations
(U.S. $ millions, except per share)
39
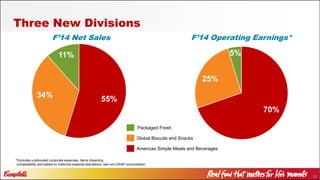
Three New Divisions
55%34%
11%
F’14 Net Sales
70%
25%
5%
F’14 Operating Earnings*
*Excludes unallocated corporate expenses, items impacting
comparability and based on historical expense allocations; see non-GAAP reconciliation
Americas Simple Meals and Beverages
Global Biscuits and Snacks
Packaged Fresh
40
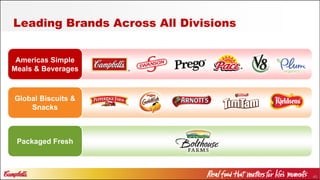
Americas Simple
Meals & Beverages
Global Biscuits &
Snacks
Packaged Fresh
Leading Brands Across All Divisions
41
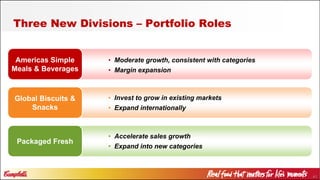
Americas Simple
Meals & Beverages
Global Biscuits &
Snacks
Packaged Fresh
Three New Divisions – Portfolio Roles
• Moderate growth, consistent with categories
• Margin expansion
• Accelerate sales growth
• Expand into new categories
• Invest to grow in existing markets
• Expand internationally
42
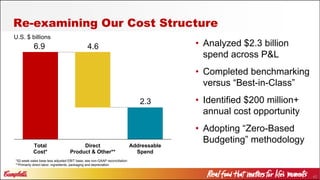
Re-examining Our Cost Structure
6.9 4.6
2.3
Total
Cost*
Direct
Product & Other**
Addressable
Spend
• Analyzed $2.3 billion
spend across P&L
• Completed benchmarking
versus “Best-in-Class”
• Identified $200 million+
annual cost opportunity
• Adopting “Zero-Based
Budgeting” methodology
*52-week sales base less adjusted EBIT base; see non-GAAP reconciliation
**Primarily direct labor, ingredients, packaging and depreciation
U.S. $ billions
43
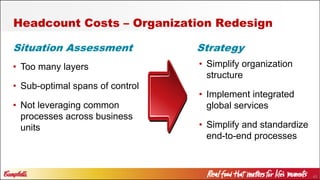
Headcount Costs – Organization Redesign
Strategy
• Simplify organization
structure
• Implement integrated
global services
• Simplify and standardize
end-to-end processes
• Too many layers
• Sub-optimal spans of control
• Not leveraging common
processes across business
units
Situation Assessment
44
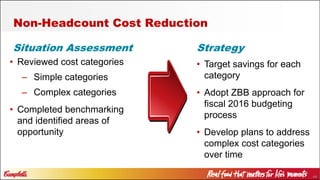
Non-Headcount Cost Reduction
Strategy
• Target savings for each
category
• Adopt ZBB approach for
fiscal 2016 budgeting
process
• Develop plans to address
complex cost categories
over time
• Reviewed cost categories
– Simple categories
– Complex categories
• Completed benchmarking
and identified areas of
opportunity
Situation Assessment
45
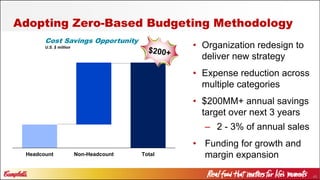
Headcount Non-Headcount Total
Adopting Zero-Based Budgeting Methodology
• Organization redesign to
deliver new strategy
• Expense reduction across
multiple categories
• $200MM+ annual savings
target over next 3 years
– 2 - 3% of annual sales
• Funding for growth and
margin expansion
Cost Savings Opportunity
U.S. $ million
46
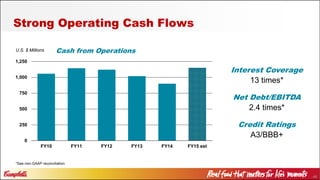
Strong Operating Cash Flows
0
250
500
750
1,000
1,250
FY10 FY11 FY12 FY13 FY14 FY15 est
Cash from Operations
Interest Coverage
13 times*
Net Debt/EBITDA
2.4 times*
Credit Ratings
A3/BBB+
U.S. $ Millions
*See non-GAAP reconciliation
47
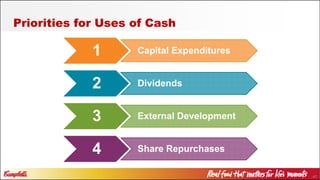
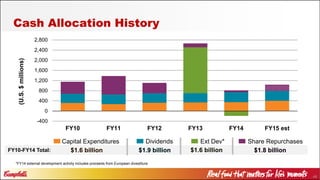
Priorities for Uses of Cash
1 Capital Expenditures
2 Dividends
3 External Development
4 Share Repurchases
48
-400
0
400
800
1,200
1,600
2,000
2,400
2,800
FY10 FY11 FY12 FY13 FY14 FY15 est
Cash Allocation History(U.S.$millions)
Capital Expenditures Dividends
FY10-FY14 Total:
Ext Dev* Share Repurchases
*FY14 external development activity includes proceeds from European divestiture
49
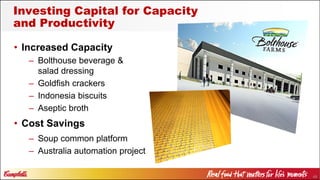
• Increased Capacity
– Bolthouse beverage &
salad dressing
– Goldfish crackers
– Indonesia biscuits
– Aseptic broth
• Cost Savings
– Soup common platform
– Australia automation project
Investing Capital for Capacity
and Productivity
50
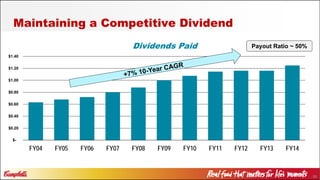
Maintaining a Competitive Dividend
$-
$0.20
$0.40
$0.60
$0.80
$1.00
$1.20
$1.40
FY04 FY05 FY06 FY07 FY08 FY09 FY10 FY11 FY12 FY13 FY14
Dividends Paid Payout Ratio ~ 50%
51
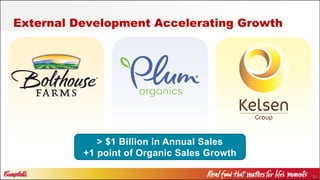
> $1 Billion in Annual Sales
+1 point of Organic Sales Growth
External Development Accelerating Growth
52
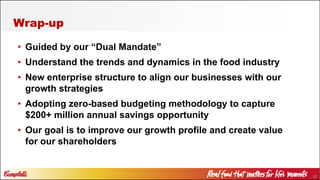
• Guided by our “Dual Mandate”
• Understand the trends and dynamics in the food industry
• New enterprise structure to align our businesses with our
growth strategies
• Adopting zero-based budgeting methodology to capture
$200+ million annual savings opportunity
• Our goal is to improve our growth profile and create value
for our shareholders
Wrap-up
53
Forward-looking Statements
This presentation contains “forward-looking statements.” Forward-looking statements can be identified by
words such as “anticipates,” “intends,” “plans,” “believes,” “estimates,” “expects” and similar references to
future periods. Examples of forward-looking statements include, but are not limited to, statements we
make on guidance for 2015, on our cost-saving initiatives, on our new enterprise and management
structure, on our ability to execute our new business strategies successfully, and on our expectations that
we can accelerate innovation across our portfolio, integrate acquisitions and expand our international
footprint. Forward-looking statements are based on our current expectations and assumptions regarding
our business, our industry and other future conditions. Forward-looking statements are subject to inherent
uncertainties, risks and changes in circumstances that are difficult to predict. Our actual results may differ
materially from those contemplated by the forward-looking statements due to factors such as our ability to
manage organizational change effectively; our ability to realize projected benefits and cost savings from
the new structure and our cost-saving initiatives; the impact of strong competitive responses to our
marketing strategies; risks associated with trade and consumer acceptance of our new and improved
products; the effectiveness of our promotional programs; the impact of portfolio changes, and the other
factors described in “Risk Factors” in the company’s most recent Form 10-K and in subsequent SEC
filings. We undertake no obligation to update these statements to reflect new information or future events.
54
Non-GAAP Measures
This presentation includes certain “non-GAAP” measures as defined
by SEC rules. We have provided a reconciliation of those measures
to the most directly comparable GAAP measures, which is posted on
our investor Web site, which can be found at
investor.campbellsoupcompany.com.
5555
56
Appendix
57
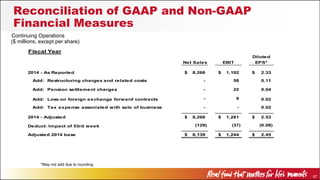
Reconciliation of GAAP and Non-GAAP
Financial Measures
($ millions, except per share)
Fiscal Year
Diluted
Net Sales EBIT EPS*
2014 - As Reported 8,268$ 1,192$ 2.33$
Add: Restructuring charges and related costs - 58 0.11
Add: Pension settlement charges - 22 0.04
Add: Loss on foreign exchange forward contracts - 9 0.02
Add: Tax expense associated with sale of business - - 0.02
2014 - Adjusted 8,268$ 1,281$ 2.53$
Deduct: Impact of 53rd week (129) (37) (0.08)
Adjusted 2014 base 8,139$ 1,244$ 2.45$
*May not add due to rounding
Continuing Operations
58
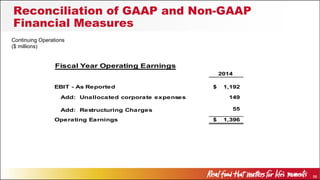
Reconciliation of GAAP and Non-GAAP
Financial Measures
Fiscal Year Operating Earnings
2014
EBIT - As Reported 1,192$
Add: Unallocated corporate expenses 149
Add: Restructuring Charges 55
Operating Earnings 1,396$
($ millions)
Continuing Operations
59
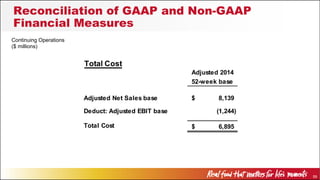
Reconciliation of GAAP and Non-GAAP
Financial Measures
($ millions)
Continuing Operations
Total Cost
Adjusted 2014
52-week base
Adjusted Net Sales base 8,139$
Deduct: Adjusted EBIT base (1,244)
Total Cost 6,895$
60
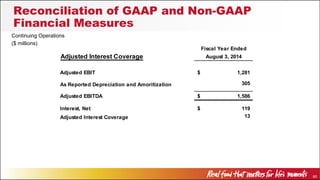
Reconciliation of GAAP and Non-GAAP
Financial Measures
($ millions)
Fiscal Year Ended
Adjusted Interest Coverage August 3, 2014
Adjusted EBIT 1,281$
As Reported Depreciation and Amoritization 305
Adjusted EBITDA 1,586$
Interest, Net 119$
Adjusted Interest Coverage 13
Continuing Operations
61

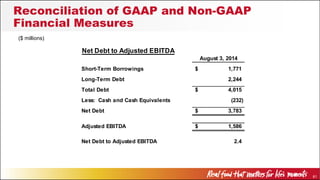
($ millions)
Reconciliation of GAAP and Non-GAAP
Financial Measures
Net Debt to Adjusted EBITDA
August 3, 2014
Short-Term Borrowings 1,771$
Long-Term Debt 2,244
Total Debt 4,015$
Less: Cash and Cash Equivalents (232)
Net Debt 3,783$
Adjusted EBITDA 1,586$
Net Debt to Adjusted EBITDA 2.4