Saltar al contenido principal
PepsiCo
By: Ashley Cleary, Sylvia LaBrie, Andrea Baril, Marie-
                 Michele Lachance
Overview

∗   Company Overview                        ∗   Strategy Formulation
∗   History of Pepsi                        ∗   SWOT Matrix
                                            ∗   Grand Strategy Matrix
∗   Growth                                  ∗   BCG
∗   2009 Events and Issues                  ∗   Space Matrix Data
∗   Existing Mission and Vision statement   ∗   Space Matrix
∗   New Mission and Vision Statement        ∗   IE Matrix
∗   SWOT Analysis                           ∗   Matrix Analysis
∗                                           ∗   QSPM Matrix
    External Assessment
                                            ∗   Strategic Plan
∗   CPM                                     ∗   Strategy
∗   EFE                                     ∗   Objectives
∗   Positioning Map                         ∗   Recommendations
∗   Internal Assessment                     ∗   Assumptions
∗   Organizational Chart                    ∗   Implementation
                                            ∗   EPS/EBIT
∗   Income Statement
                                            ∗   Projected Financials
∗   Balance Sheet                           ∗   Evaluation
∗   Financial ratios                        ∗   Balanced Scorecard
∗   IFE Matrix                              ∗   Key Future Ratios
History
∗ In 1965: PepsiCo, Inc. is founded by Donald M. Kendall, President and CEO
  of Pepsi-Cola and Herman W. Lay, Chairman and CEO of Frito-Lay, through
  the merger:
∗ 1. Pepsi-Cola In 1898: Caleb Bradham, a New Bern, North Carolina,
  pharmacist, created "Brad's Drink," a carbonated soft drink he created to
  serve his drugstore's fountain customers.
∗ 2. Frito Company
∗
∗ 3. H. W. Lay Company
∗
∗ The Major products of the companies are:
∗ Pepsi-Cola Company
∗ Fritos brand corn chips, Lay's brand potato chips, Cheetos brand cheese
  flavored snacks, Ruffles brand potato chips, Rold Gold brand pretzels.
∗ Mountain Dew
Growth

1966:
Doritos is introduced
Pepsi enters Japan and Eastern Europe.

1970:
PepsiCo moves from New York City to new world headquarters in Purchase, N.Y
Pepsi is the first company to respond to consumer preference with lightweight, recyclable, plastic
bottles.

1977:
PepsiCo acquires Pizza Hut, Inc

1978:
Taco Bell

1980:
PepsiCo Food Service International (PFSI) is formed to focus on overseas development of restaurants.
Growth Cont.

 1982:
Pepsi Free and Diet Pepsi Free, the first major brand caffeine-free colas, are introduced.
Inauguration of the first Pepsi-Cola operation in China.

1985:
PepsiCo is now the largest company in the beverage industry. The company has revenues of
more than $7.5 billion, more than 137,000 employees.
Pepsi-Cola products are available in nearly 150 countries and territories around the world. Snack
food operations are in 10 international markets.

1986:
PepsiCo purchases 7Up International, the third largest franchise soft drink operation outside the
United States.

1993:
Pepsi-Cola introduces Aquafina bottled water into test market.

1996:
Pepsi-Cola launches Pepsi World at www.pepsiworld.com
Global


∗ Pepsi products are in almost 200 countries
  throughout the world
∗ There are 22 different brand lines that account for at
  least $1 billion per year per brand
2009


∗ Celebrated 75 years in Canada
∗ Was on the “Best Food for Women” list in Women’s
  Health magazine
∗ Began a partnership with the NFL
∗ Won U.S. EPA SmartWay Environmental Excellence
  award
∗ Became official beverage of Norwegian Cruise Lines
Mission Statement


∗ Our mission is to be the world's premier consumer
  products company focused on convenient foods and
  beverages. We seek to produce financial rewards to
  investors as we provide opportunities for growth and
  enrichment to our employees, our business partners
  and the communities in which we operate. And in
  everything we do, we strive for honesty, fairness and
  integrity.
Vision Statement


PepsiCo's responsibility is to continually improve all
aspects of the world in which we operate -
environment, social, economic - creating a better
tomorrow than today."
Our vision is put into action through programs and a
focus on environmental stewardship, activities to
benefit society, and a commitment to build shareholder
value by making PepsiCo a truly sustainable company.
Proposed Mission
∗ Our mission is to be the world's premier consumer products company
  focused on convenient foods and beverages through stores as well as
  our website. (1,2.3,4) We seek to produce financial rewards to investors
  as we provide opportunities for growth and enrichment to our
  employees, our business partners and the communities in which we
  operate. (5,8,9) And in everything we do, we strive for honesty, fairness
  and integrity. (6,7)

        1.   Customer
        2.   Products or Services
        3.   Markets
        4.   Technology
        5.   Concern for survival, profitability, and growth
        6.   Philosophy
        7.   Self-Concept
        8.   Concern for public image
        9.   Concern for employees
Proposed Vision


∗ PepsiCo, in association with smaller brands, offers a
  wide variety of products from beverages to snacks at
  low cost.
External Assessment
Opportunities


1. Opening in market for less costly products
2. Growth opportunities in developed countries as well as
international nonestablished countries
3. Pepsi recently reacquired ownership of its two largest bottlers,
Pepsi Bottling Group (PBG) and PepsiAmericas (PAS)
4. Compete in more than one industry (non-alcoholic beverage
industry, the salty or savory snack food industry, and the breakfast
food industry)
5. Growth in the carbonated drink market is the largest in Asia and
Europe
6. The world's demand is experiencing a growth with the sports
drinks, bottled water, and energy drinks
Threats


1. Fierce competition from Coca-Cola, which owns the largest piece
of the market share
2. The downturn in economy, which lead customers to shift away
from bottles of water to tap water.
3. Because of the recession, customers are finding cheaper
alternatives to the national brands.
4. Customers are getting more conscious and concerned about
their eating habits and general health.
5. Campaign against plastic containers has impacted the sale of
bottled beverages
6. Highly dependent on supplies of clean water, to prevent
contamination
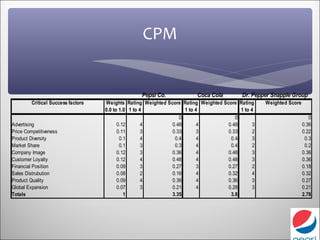
CPM


                                                  Pepsi Co.              Coca Cola        Dr. Pepper Snapple Group
         Critical Success factors   Weights Rating Weighted Score Rating Weighted Score Rating     Weighted Score
                                    0.0 to 1.0 1 to 4              1 to 4                1 to 4
                                                                 0                     0                               0
Advertising                               0.12       4        0.48       4          0.48       3                    0.36
Price Competitiveness                     0.11       3        0.33       3          0.33       2                    0.22
Product Diversity                          0.1       4         0.4       4           0.4       3                     0.3
Market Share                               0.1       3         0.3       4           0.4       2                     0.2
Company Image                             0.12       3        0.36       4          0.48       3                    0.36
Customer Loyalty                          0.12       4        0.48       4          0.48       3                    0.36
Financial Position                        0.09       3        0.27       3          0.27       2                    0.18
Sales Distrubution                        0.08       2        0.16       4          0.32       4                    0.32
Product Quality                           0.09       4        0.36       4          0.36       3                    0.27
Global Expansion                          0.07       3        0.21       4          0.28       3                    0.21
Totals                                       1                3.35                   3.8                            2.78
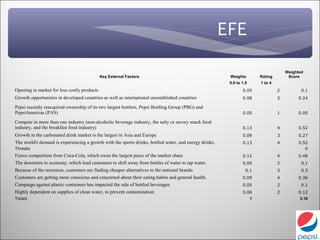
EFE
                                                                                                                                              Weighted
                                             Key External Factors                                           Weights              Rating        Score
                                                                                                            0.0 to 1.0           1 to 4
Opening in market for less costly products                                                                         0.05                   2          0.1
Growth opportunities in developed countries as well as international unestablished countries                       0.08                   3         0.24

Pepsi recently reacquired ownership of its two largest bottlers, Pepsi Bottling Group (PBG) and
PepsiAmericas (PAS)                                                                                                0.05                   1         0.05

Compete in more than one industry (non-alcoholic beverage industry, the salty or savory snack food
industry, and the breakfast food industry)                                                                         0.13                   4         0.52
Growth in the carbonated drink market is the largest in Asia and Europe                                            0.09                   3         0.27
The world's demand is experiencing a growth with the sports drinks, bottled water, and energy drinks.              0.13                   4         0.52
Threats                                                                                                                                                0
Fierce competition from Coca-Cola, which owns the largest piece of the market share                                0.12                   4         0.48
The downturn in economy, which lead customers to shift away from bottles of water to tap water.                    0.05                   2          0.1
Because of the recession, customers are finding cheaper alternatives to the national brands.                         0.1                  3          0.3
Customers are getting more conscious and concerned about their eating habits and general health.                   0.09                   4         0.36
Campaign against plastic containers has impacted the sale of bottled beverages                                     0.05                   2          0.1
Highly dependent on supplies of clean water, to prevent contamination                                              0.06                   2         0.12
Totals                                                                                                                   1                          3.16
Positioning Map
                           High Prices


Limited                                                       Diverse
Products                                                     Products

             Dr. Pepper              Coca Cola   Pepsi Co.
           Snapple Group


                           Low Prices
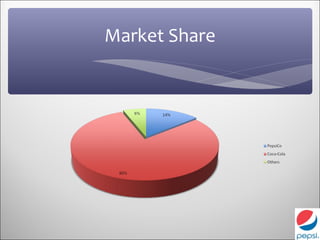
Market Share
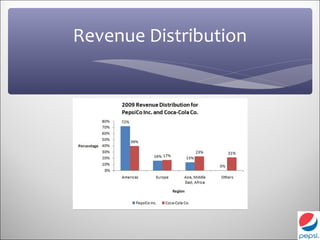
Revenue Distribution
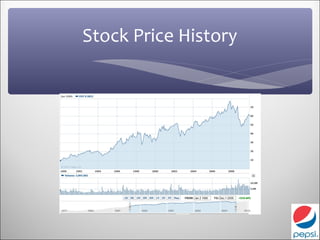
Stock Price History
Internal Assessment
Strengths


1. Strong brand equity
2. Well-known worldwide
3. Innovating company
4. Ethical, socially responsible, and sustainable company
5. Strong advertising company with more than 40 slogans
and songs
6. PepsiCo as the largest part of the market share after Coca-
Cola
7. PepsiCo owns a wide variety of smaller brands which able
them to offer a large product range from beverages to
snacks
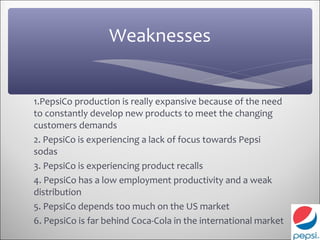
Weaknesses


1.PepsiCo production is really expansive because of the need
to constantly develop new products to meet the changing
customers demands
2. PepsiCo is experiencing a lack of focus towards Pepsi
sodas
3. PepsiCo is experiencing product recalls
4. PepsiCo has a low employment productivity and a weak
distribution
5. PepsiCo depends too much on the US market
6. PepsiCo is far behind Coca-Cola in the international market
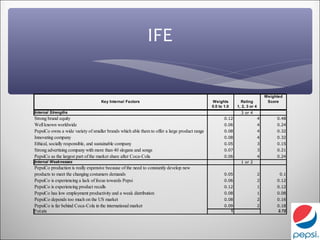
IFE

                                                                                                                                Weighted
                                    Key Internal Factors                                       Weights         Rating            Score
                                                                                               0.0 to 1.0    1, 2, 3 or 4
Internal Strengths                                                                                             3 or 4
Strong brand equity                                                                                   0.12                  4        0.48
Well known worldwide                                                                                  0.06                  4        0.24
PepsiCo owns a wide variety of smaller brands which able them to offer a large product range          0.08                  4        0.32
Innovating company                                                                                    0.08                  4        0.32
Ethical, socially responsible, and sustainable company                                                0.05                  3        0.15
Strong advertising company with more than 40 slogans and songs                                        0.07                  3        0.21
PepsiCo as the largest part of the market share after Coca-Cola                                       0.06                  4        0.24
Internal Weaknesses                                                                                            1 or 2
PepsiCo production is really expensive because of the need to constantly develop new
products to meet the changing costumers demands                                                       0.05                  2         0.1
PepsiCo is experiencing a lack of focus towards Pepsi                                                 0.06                  2        0.12
PepsiCo is experiencing product recalls                                                               0.12                  1        0.12
PepsiCo has low employment productivity and a weak distribution                                       0.08                  1        0.08
PepsiCo depends too much on the US market                                                             0.08                  2        0.16
PepsiCo is far behind Coca-Cola in the international market                                           0.09                  2        0.18
Totals                                                                                                   1                            2.72
Income Statement
(in millions except per share amounts)                  2009
Net Revenue                                       $43,232.00
Cost of sales                                     $20,099.00
Selling, general and administrative expenses      $15,026.00
Amortization of intangible assets                     $63.00
Operating Profit                                   $8,044.00
Bottling equity income                               $365.00
Interest expense                                   ($397.00)
Interest income                                       $67.00
Income before Income Taxes                         $8,079.00
Provision for Income Taxes                         $2,100.00
Net Income                                         $5,979.00
Less: Net income attributable to noncontrolling
interests                                             $33.00
Net Income Attributable to PepsiCo                 $5,946.00
Net Income Attributable to PepsiCo per Common
Share
  Basic                                               $3.81
  Diluted                                             $3.77
(In millions except per share amounts)           2009
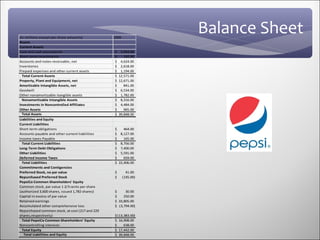
                                                                   Balance Sheet
Assets
Current Assets
Cash and cash equivalents                        $    3,943.00
Short-term investments                           $      192.00
Accounts and notes receivable, net               $    4,624.00
Inventories                                      $    2,618.00
Prepaid expenses and other current assets        $    1,194.00
  Total Current Assets                           $   12,571.00
Property, Plant and Equipment, net               $   12,671.00
Amortizable Intangible Assets, net               $      841.00
Goodwill                                         $    6,534.00
Other nonamortizable itangible assets            $    1,782.00
  Nonamortizable Intangible Assets               $    8,316.00
Investments in Noncontrolled Affiliates          $    4,484.00
Other Assets                                     $      965.00
  Total Assets                                   $   39,848.00
Liabilities and Equity
Current Liabilities
Short-term obligations                           $      464.00
Accounts payable and other current liabilities   $    8,127.00
Income taxes Payable                             $      165.00
  Total Current Liabilities                      $    8,756.00
Long-Term Debt Obligations                       $    7,400.00
Other Liabilities                                $    5,591.00
Deferred Income Taxes                            $      659.00
  Total Liabilities                              $   22,406.00
Commitments and Contigencies
Preferred Stock, no par value                    $        41.00
Repurchased Preferred Stock                      $      (145.00)
PepsiCo Common Shareholders' Equity
Common stock, par value 1 2/3 cents per share
(authorized 3,600 shares, issued 1,782 shares)   $     30.00
Capital in excess of par value                   $    250.00
Retained earnings                                $ 33,805.00
Accumulated other comprehensive loss             $ (3,794.00)
Repurchased common stock, at cost (217 and 229
shares,respectively)                             $ (13,383.00)
  Total PepsiCo Common Shareholders' Equity      $ 16,908.00
Noncontrolling interests                         $     638.00
  Total Equity                                   $ 17,442.00
   Total Liabilities and Equity                  $ 39,848.00
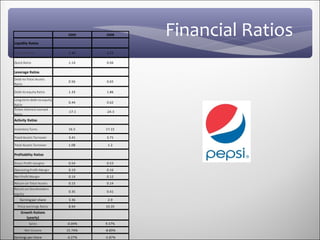
Liquidity Ratios
                            2009    2008     Financial Ratios
Current Ratio               1.44    1.23

Quick Ratio                 1.14    0.94

Leverage Ratios
Debt-to-Total Assets
                            0.56    0.65
Ratio

Debt-to-equity Ratio        1.33    1.86

Long-term debt-to-equity
                            0.44    0.62
Ratio
Times-Interest-earned
                            -17.1   -24.3
Ratio
Activity Ratios

Inventory Turns             16.5    17.15

Fixed Assets Turnover       3.41    3.71

Total Assets Turnover       1.08     1.2

Profitability Ratios

Gross Profit margins        0.54    0.53
Operating Profit Margin     0.19    0.16
Net Profit Margin           0.14    0.12
Return on Total Assets      0.15    0.14
Return on Stockholders
                            0.35    0.41
equity
   Earning per share        3.36     2.9
  Price-earnings Ratio      8.94    10.35
    Growth Rations
       (yearly)
          Sales            -0.04%   9.57%
      Net Income           15.74%   -8.89%
Earnings per share         -0.27%   -5.87%
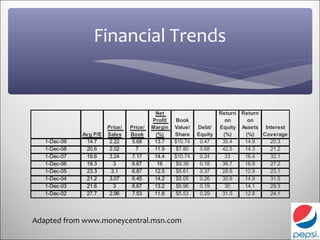
Financial Trends


                                           Net                       Return Return
                                          Profit    Book               on     on
                        Price/   Price/   Margin   Value/   Debt/    Equity Assets Interest
              Avg P/E   Sales    Book      (%)     Share    Equity    (%)    (%)   Coverage
   1-Dec-09    14.7      2.22     5.68     13.7    $10.74    0.47     35.4   14.9    20.3
   1-Dec-08    20.6      2.02       7      11.9     $7.80    0.68     42.5   14.3    21.2
   1-Dec-07    19.6      3.24     7.17     14.4    $10.74    0.24      33    16.4    32.1
   1-Dec-06    18.3        3      6.67      16      $9.38    0.18     36.7   18.9    27.2
   1-Dec-05    23.3       3.1     6.87     12.5     $8.61    0.37     28.6   12.9    23.1
   1-Dec-04    21.2      3.07     6.45     14.2     $8.05    0.26     30.9   14.9    31.5
   1-Dec-03    21.6        3      6.67     13.2     $6.96    0.19      30    14.1    29.3
   1-Dec-02    27.7      2.96     7.53     11.8     $5.53    0.29     31.5   12.8    24.1


Adapted from www.moneycentral.msn.com
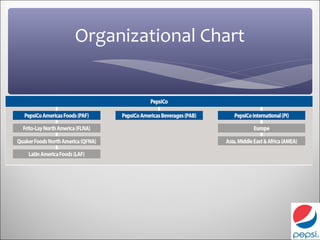
Organizational Chart
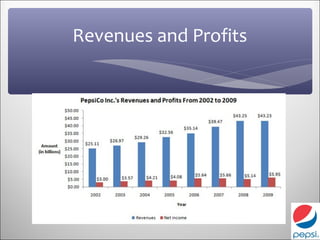
Revenues and Profits
Strategy Formulation
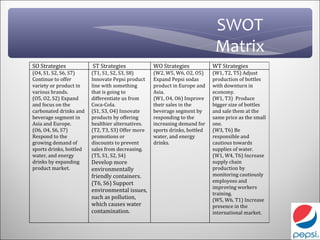
SWOT
                                                                             Matrix
SO Strategies            ST Strategies             WO Strategies            WT Strategies
(O4, S1, S2, S6, S7)     (T1, S1, S2, S3, S8)      (W2, W5, W6, O2, O5)     (W1, T2, T5) Adjust
Continue to offer        Innovate Pepsi product    Expand Pepsi sodas       production of bottles
variety or product in    line with something       product in Europe and    with downturn in
various brands.          that is going to          Asia.                    economy.
(O5, O2, S2) Expand      differentiate us from     (W1, O4, O6) Improve     (W1, T3) Produce
and focus on the         Coca-Cola.                their sales in the       bigger size of bottles
carbonated drinks and    (S1, S3, O4) Innovate     beverage segment by      and sale them at the
beverage segment in      products by offering      responding to the        same price as the small
Asia and Europe.         healthier alternatives.   increasing demand for    one.
(O6, O4, S6, S7)         (T2, T3, S3) Offer more   sports drinks, bottled   (W3, T6) Be
Respond to the           promotions or             water, and energy        responsible and
growing demand of        discounts to prevent      drinks.                  cautious towards
sports drinks, bottled   sales from decreasing.                             supplies of water.
water, and energy        (T5, S1, S2, S4)                                   (W1, W4, T6) Increase
drinks by expanding      Develop more                                       supply chain
product market.          environmentally                                    production by
                         friendly containers.                               monitoring cautiously
                         (T6, S6) Support                                   employees and
                                                                            improving workers
                         environmental issues,
                                                                            training.
                         such as pollution,                                 (W5, W6, T1) Increase
                         which causes water                                 presence in the
                         contamination.                                     international market.
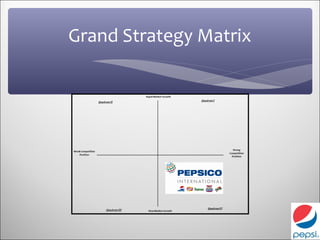
Grand Strategy Matrix
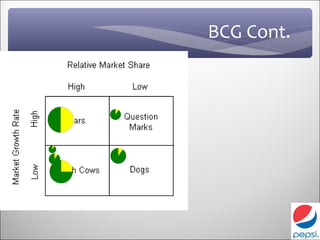
BCG


Division                     Revenue       % Revenue      Profit       Profit %        Market Share         Market Growth

Frito-Lay North America      $ 13,224.00           31% $ 3,258.00             38%                      1              5.42%

Quaker Foods North America   $ 1,884.00                4% $   628.00              7%                   1             -0.95%

Latin America Foods          $ 5,703.00            13% $      904.00          10%                      1             -3.26%

PepsiCo Americas Beverages   $ 10,116.00           23% $ 2,172.00             25%                     0.8            -7.51%

Europe                       $ 6,727.00            16% $      932.00          11%                     0.4            -2.38%

Asia, Middle East & Africa   $ 5,578.00            13% $      716.00              8%                  0.3             8.97%

Total                        $ 43,232.00          100% $ 8,610.00            100%
BCG Cont.
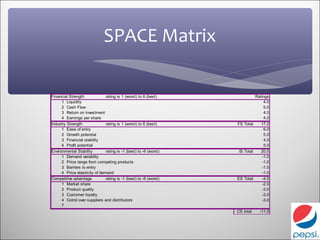
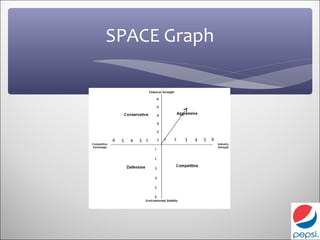
SPACE Matrix

Financial Strength             rating is 1 (worst) to 6 (best)               Ratings
      1 Liquidity                                                                 4.0
      2 Cash Flow                                                                 5.0
      3 Return on investment                                                      4.0
      4 Earnings per share                                                        4.0
Industry Strength              rating is 1 (worst) to 6 (best)     FS Total     17.0
      1 Ease of entry                                                             6.0
      2 Growth potential                                                          5.0
      3 Financial stability                                                       4.0
      4 Profit potential                                                          5.0
Environmental Stability        rating is -1 (best) to -6 (worst)    IS Total    20.0
      1 Demand variablity                                                        -1.0
      2 Price range from competing products                                      -1.0
      3 Barriers to entry                                                        -1.0
      4 Price elasticity of demand                                               -1.0
Competitive advantage          rating is -1 (best) to -6 (worst)   ES Total      -4.0
      1 Market share                                                             -2.0
      2 Product quality                                                          -3.0
      3 Customer loyalty                                                         -3.0
      4 Cotrol over suppliers and distributors                                   -3.0
      7
                                                                   CS total    -11.0
SPACE Graph


6   5   4   3 2       1   2   3   4   5   6
                  1

                  2

                  3

                  4

                  5

                  6
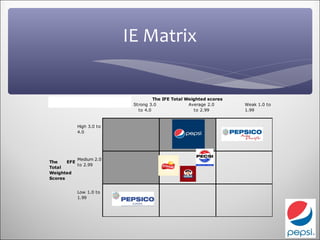
IE Matrix


                                    The IFE Total Weighted scores
                           Strong 3.0              Average 2.0      Weak 1.0 to 
                             to 4.0                  to 2.99        1.99


           High 3.0 to 
           4.0
                                           PepsiCo

           Medium 2.0 
The    EFE
           to 2.99
Total
Weighted
Scores


           Low 1.0 to 
           1.99
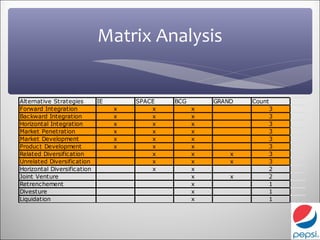
Matrix Analysis


Alternative Strategies     IE       SPACE   BCG       GRAND   Count
Forward Integration             x       x         x                   3
Backward Integration            x       x         x                   3
Horizontal Integration          x       x         x                   3
Market Penetration              x       x         x                   3
Market Development              x       x         x                   3
Product Development             x       x         x                   3
Related Diversific ation                x         x       x           3
Unrelated Diversification               x         x       x           3
Horizontal Diversification              x         x                   2
Joint Venture                                     x       x           2
Retrenchement                                     x                   1
Divesture                                         x                   1
Liquidation                                       x                   1
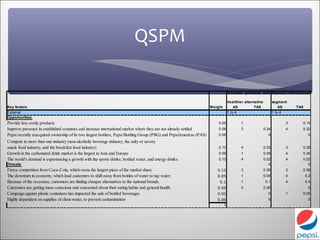
QSPM

                                                                                                                                 Innovate products with Improve international

                                                                                                                                 healthier alternative          segment
Key factors                                                                                                           Weight         AS          TAS                AS    TAS
External                                                                                                                         1 to 4                         1 to 4
Opportunities:
Provide less costly products                                                                                              0.05           1                            3     0.15
Improve presence in established countries and increase international market where they are not already settled            0.08           3               0.24         4     0.32
Pepsi recently reacquired ownership of its two largest bottlers, Pepsi Bottling Group (PBG) and PepsiAmericas (PAS)       0.05                             0                     0
Compete in more than one industry (non-alcoholic beverage industry, the salty or savory
snack food industry, and the breakfast food industry)                                                                     0.13           4               0.52         3     0.39
Growth in the carbonated drink market is the largest in Asia and Europe                                                   0.09           1               0.09         4     0.36
The world's demand is experiencing a growth with the sports drinks, bottled water, and energy drinks.                     0.13           4               0.52         4     0.52
Threats:                                                                                                                                                    0                  0
Fierce competition from Coca-Cola, which owns the largest piece of the market share                                      0.12            3               0.36         3     0.36
The downturn in economy, which lead customers to shift away from bottles of water to tap water.                          0.05            1               0.05         4         0.2
Because of the recession, customers are finding cheaper alternatives to the national brands.                              0.1            1                0.1         4         0.4
Customers are getting more conscious and concerned about their eating habits and general health.                         0.09            4               0.36                    0
Campaign against plastic containers has impacted the sale of bottled beverages                                           0.05                              0          1     0.05
Highly dependent on supplies of clean water, to prevent contamination                                                    0.06                              0                     0
                                                                                                                            1
QSPM Cont.

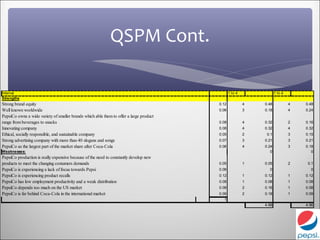
Internal                                                                                        1 to 4              1 to 4
Strengths
Strong brand equity                                                                      0.12            4   0.48            4   0.48
Well known worldwide                                                                     0.06            3   0.18            4   0.24
PepsiCo owns a wide variety of smaller brands which able them to offer a large product
range from beverages to snacks                                                           0.08            4   0.32            2   0.16
Innovating company                                                                       0.08            4   0.32            4   0.32
Ethical, socially responsible, and sustainable company                                   0.05            2    0.1            3   0.15
Strong advertising company with more than 40 slogans and songs                           0.07            3   0.21            3   0.21
PepsiCo as the largest part of the market share after Coca-Cola                          0.06            4   0.24            3   0.18
Weaknesses:                                                                                                     0                   0
PepsiCo production is really expensive because of the need to constantly develop new
products to meet the changing costumers demands                                          0.05            1   0.05            2    0.1
PepsiCo is experiencing a lack of focus towards Pepsi                                    0.06                  0                   0
PepsiCo is experiencing product recalls                                                  0.12            1   0.12            1   0.12
PepsiCo has low employment productivity and a weak distribution                          0.08            1   0.08            1   0.08
PepsiCo depends too much on the US market                                                0.08            2   0.16            1   0.08
PepsiCo is far behind Coca-Cola in the international market                              0.09            2   0.18            1   0.09
                                                                                           1
                                                                                                             4.68                4.96
Strategic Plan
Strategy


∗ Market development is a strategy that PepsiCo should
  apply by expanding in countries that not already
  established
∗ Use forward integration to acquire smaller companies
  in foreign markets to increase their market share
∗ Product development and related diversification
  should also be considered while trying to produce and
  distribute healthier products
Recommendations


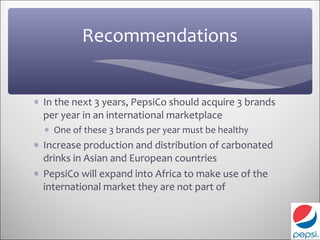
∗ In the next 3 years, PepsiCo should acquire 3 brands
  per year in an international marketplace
  ∗ One of these 3 brands per year must be healthy
∗ Increase production and distribution of carbonated
  drinks in Asian and European countries
∗ PepsiCo will expand into Africa to make use of the
  international market they are not part of
Objectives


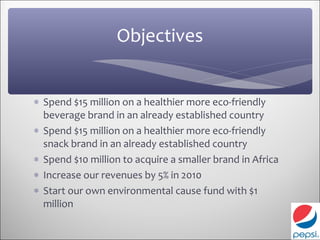
∗ Spend $15 million on a healthier more eco-friendly
  beverage brand in an already established country
∗ Spend $15 million on a healthier more eco-friendly
  snack brand in an already established country
∗ Spend $10 million to acquire a smaller brand in Africa
∗ Increase our revenues by 5% in 2010
∗ Start our own environmental cause fund with $1
  million
Assumptions


∗ Spend $40 million to acquire new brands
∗ Spend $1 million to start an environmental cause
  group
∗ Revenue increase of 5%
∗ Decrease short-term and long-term debt by using
  some of our cash and cash equivalents as well as
  retained earnings
Implementation
Projected Income Statement

(in millions except per share amounts)                  2009          2010
Net Revenue                                       $43,232.00   $ 45,393.60 5% increase
Cost of sales                                     $20,099.00   $ 21,549.09 Based on previous years %
Selling, general and administrative expenses      $15,026.00   $ 15,476.78 3% increase based on new brands/territories
Amortization of intangible assets                     $63.00   $     63.00
Operating Profit                                   $8,044.00   $ 8,304.73
Bottling equity income                               $365.00   $ 365.00
Interest expense                                   ($397.00)   $ (397.00)
Interest income                                       $67.00   $     67.00
Income before Income Taxes                         $8,079.00   $ 8,339.73
Provision for Income Taxes                         $2,100.00   $ 2,100.00
Net Income                                         $5,979.00   $ 6,239.73
Less: Net income attributable to noncontrolling
interests                                             $33.00 $    33.00
Net Income Attributable to PepsiCo                 $5,946.00 $ 6,206.73
Net Income Attributable to PepsiCo per Common
Share
  Basic                                               $3.81 $        3.98
  Diluted                                             $3.77 $        3.94
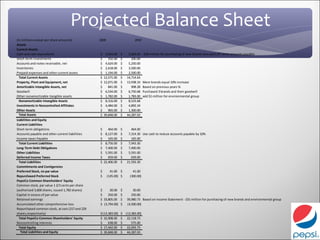
Projected Balance Sheet
(In millions except per share amounts)           2009                     2010
Assets
Current Assets
Cash and cash equivalents                        $    3,943.00   $    3,264.63    -$10 million for purchasing of new brands also paid off some accounts payable
Short-term investments                           $      192.00   $      200.00
Accounts and notes receivable, net               $    4,624.00   $    5,250.00
Inventories                                      $    2,618.00   $    3,500.00
Prepaid expenses and other current assets        $    1,194.00   $    2,500.00
  Total Current Assets                           $   12,571.00   $   14,714.63
Property, Plant and Equipment, net               $   12,671.00   $   13,938.10    More brands equal 10% increase
Amortizable Intangible Assets, net               $      841.00   $      908.28    Based on previous years %
Goodwill                                         $    6,534.00   $    6,750.68    Purchased 3 brands and their goodwill
Other nonamortizable itangible assets            $    1,782.00   $    1,783.00    add $1 million for environmental group
  Nonamortizable Intangible Assets               $    8,316.00   $    8,533.68
Investments in Noncontrolled Affiliates          $    4,484.00   $    4,892.34
Other Assets                                     $      965.00   $    1,300.00
  Total Assets                                   $   39,848.00   $   44,287.03
Liabilities and Equity
Current Liabilities
Short-term obligations                           $      464.00   $      464.00
Accounts payable and other current liabilities   $    8,127.00   $    7,314.30 Use cash to reduce accounts payable by 10%
Income taxes Payable                             $      165.00   $      165.00
  Total Current Liabilities                      $    8,756.00   $    7,943.30
Long-Term Debt Obligations                       $    7,400.00   $    7,400.00
Other Liabilities                                $    5,591.00   $    5,591.00
Deferred Income Taxes                            $      659.00   $      659.00
  Total Liabilities                              $   22,406.00   $   21,593.30
Commitments and Contigencies
Preferred Stock, no par value                    $        41.00 $        41.00
Repurchased Preferred Stock                      $      (145.00) $     (300.00)
PepsiCo Common Shareholders' Equity
Common stock, par value 1 2/3 cents per share
(authorized 3,600 shares, issued 1,782 shares)   $     30.00 $           30.00
Capital in excess of par value                   $    250.00 $          250.00
Retained earnings                                $ 33,805.00 $       39,980.73 Based on Income Statement - $31 million for purchasing of new brands and environmental group
Accumulated other comprehensive loss             $ (3,794.00) $      (4,500.00)
Repurchased common stock, at cost (217 and 229
shares,respectively)                             $ (13,383.00)   $ (13,383.00)
  Total PepsiCo Common Shareholders' Equity      $ 16,908.00     $ 22,118.73
Noncontrolling interests                         $     638.00    $     575.00
  Total Equity                                   $ 17,442.00     $ 22,693.73
   Total Liabilities and Equity                  $ 39,848.00     $ 44,287.03
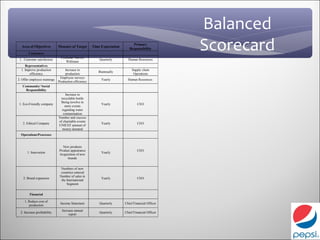
Evaluation
Balanced
  Area of Objectives
        Customers
                              Measure of Target


                                Costumer Survey
                                                      Time Expectation
                                                                              Primary
                                                                            Responsibility         Scorecard
 1. Customer satisfaction                                 Quarterly        Human Resources
                                   Webinars
     Representatives
  1. Improve production           Increase in                                 Supply chain
                                                         Biannually
        efficiency                 production                                  Operations
                               Employee surveys
2. Offer employee trainings                                Yearly          Human Resources
                              Production efficiency
   Community/ Social
     Responsibility
                                  Increase in
                               recyclable bottle
                               Being involve in
 1. Eco-Friendly company                                   Yearly                 CEO
                                  more events
                                regarding water
                                 contamination
                              Number and success
                              of charitable events
   2. Ethical Company                                      Yearly                 CEO
                              UNICEF amount of
                                money donated
  Operations/Processes


                                New products
                              Product appearance                                  CEO
       1. Innovation                                       Yearly
                              Acquisition of new
                                   brands


                                Numbers of new
                                countries entered
                               Number of sales in
    2. Brand expansion                                     Yearly                 CEO
                                the International
                                    Segment


         Financial

     1. Reduce cost of
                               Income Statement           Quarterly      Chief Financial Officer
        production
                                Increase annual
  2. Increase profitability                               Quarterly      Chief Financial Officer
                                     report
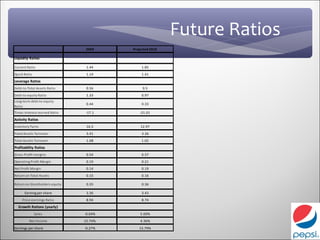
Future Ratios
                                 2009    Projected 2010

Liquidity Ratios

Current Ratio                    1.44         1.85
Quick Ratio                      1.14         1.41
Leverage Ratios
Debt-to-Total Assets Ratio       0.56         0.5
Debt-to-equity Ratio             1.33         0.97
Long-term debt-to-equity
                                 0.44         0.33
Ratio
Times-Interest-earned Ratio      -17.1       -21.01
Activity Ratios
Inventory Turns                  16.5        12.97
Fixed Assets Turnover            3.41         3.26
Total Assets Turnover            1.08         1.02
Profitability Ratios
Gross Profit margins             0.54         0.57
Operating Profit Margin          0.19         0.21
Net Profit Margin                0.14         0.19
Return on Total Assets           0.15         0.16

Return on Stockholders equity    0.35         0.36

      Earning per share          3.36         3.43
     Price-earnings Ratio        8.94         8.74
  Growth Rations (yearly)
              Sales             -0.04%       5.00%
         Net Income             15.74%       4.36%

Earnings per share              -0.27%      15.79%
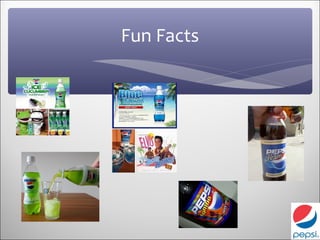
Fun Facts
Pepsi/Coke Rivalry


∗ http://www.buzzfeed.com/pepsi/the-10-most-iconic-pepsi-com
Questions?
Sources
∗   "2010 Will be Changing for PepsiCo." Medill Reports Chicago. N.p., n.d. Web. 20 Apr. 2012.
    <news.medill.northwestern.edu/chicago/news.aspx?id=157896 >.
∗   "Coke vs Pepsi." Coke vs Pepsi. N.p., n.d. Web. 25 Apr. 2012. <http://cokevspepsi.net/>.
∗   " Google Image Result for http://41minds.files.wordpress.com/2011/04/bcggrowthsharematrix.png."Google. N.p., n.d.
    Web. 22 Apr. 2012. <http://www.google.com/imgres?
    hl=en&sa=X&rlz=1C1LENN_enUS472US472&biw=1366&bih=677&tbm=isch&prmd=imvnsa&tbnid=VtCOuMODso-
    oZM:&imgrefurl=http://41minds.com/tag/bcg-matrix/&docid=JDNK6PE50NlOOM&imgur
∗   "Key financial ratios: Financial results - MSN Money ." Money: Personal finance, investing news & advice - MSN
    Money. N.p., n.d. Web. 25 Apr. 2012. <http://investing.money.msn.com/investments/key-ratios?
    symbol=PEP&page=TenYearSummary>.
∗   "PEP: Summary for Pepsico, Inc. Common Stock- Yahoo! Finance." Yahoo! Finance - Business Finance, Stock Market,
    Quotes, News. N.p., n.d. Web. 25 Apr. 2012. <http://finance.yahoo.com/q?s=PEP>.
∗   "Pepsi History." Sirpepsi. N.p., n.d. Web. 25 Apr. 2012. <http://www.sirpepsi.com/pepsi11.htm>.
∗   "PepsiCo 2009 annual report." PepsiCo. N.p., n.d. Web. 19 Apr. 2012.
    <www.pepsico.com/Download/PEPSICO_AR.pdf>.
∗   "PepsiCo Brands | PepsiCo.com." PepsiCo Home | PepsiCo.com. N.p., n.d. Web. 24 Apr. 2012.
    <http://www.pepsico.com/Brands.html>.
∗   "PepsiCo Investors | PepsiCo.com." PepsiCo Home | PepsiCo.com. N.p., n.d. Web. 25 Apr. 2012.
    <http://www.pepsico.com/Investors.html>.
∗   "PepsiCo MORE | PepsiCo.com." PepsiCo Home | PepsiCo.com. N.p., n.d. Web. 25 Apr. 2012.
    <http://www.pepsico.com/Global-Sites/More.html>.
∗   Reppo, Ilya, and Michelle Yan. "PepsiCo Valuation." Leeds-faculty Colorado. N.p., n.d. Web. 14 Apr. 2012. <leeds-
    faculty.colorado.edu/madigan/4820/Presentations%202010/PepsiCo%20Report.pdf>.
∗   segment. "PepsiCo Valuation." Google. N.p., n.d. Web. 23 Apr. 2012.
    <http://webcache.googleusercontent.com/search?q=cache:egHCTRx43AYJ:leeds-
    faculty.colorado.edu/madigan/4820/Presentations%25202010/PepsiCo
    %2520Report.pdf+PepsiCo+net+revenue+comparative+2007-2009&hl=en&gl=us>
∗   Steve. " Global Cola: 10 Pepsi-Cola Flavors You Can’t Get Here | WebUrbanist ." WebUrbanist | From Urban Art & 3D
    Graffiti to Abandoned Cities . N.p., n.d. Web. 25 Apr. 2012. <http://weburbanist.com/2010/05/02/global-cola-10-pepsi-
    cola-flavors-you-cant-get-here/>.