Saltar al contenido principal
🔎
Thank you for attending the
session 🚀
The End!
Gotcha!
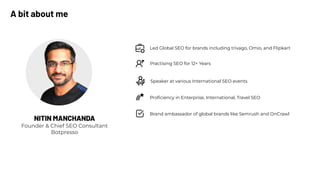
Practising SEO for 12+ Years
Speaker at various International SEO events
Led Global SEO for brands including trivago, Omio, and Flipkart
Proficiency in Enterprise, International, Travel SEO
Brand ambassador of global brands like Semrush and OnCrawl
NITIN MANCHANDA
Founder & Chief SEO Consultant
Botpresso
A bit about me
NITIN MANCHANDA
Founder & Chief SEO Consultant
Botpresso
A bit about me
Every marketer/brand craves certainty.
However, every marketer/brand must understand that
traffic forecasting can never be 100% accurate.
We Surveyed 450 SEOs and their experience
with forecasting, here’s what the polls say.
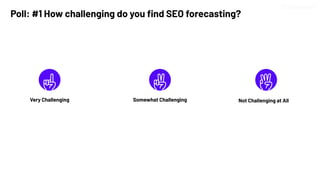
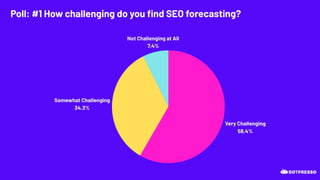
Poll: #1 How challenging do you find SEO forecasting?
Very Challenging Not Challenging at All
Somewhat Challenging
Poll: #1 How challenging do you find SEO forecasting?
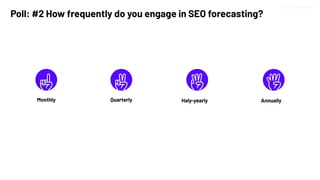
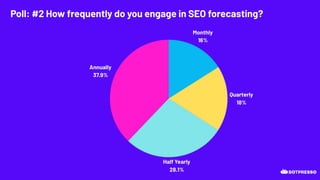
Poll: #2 How frequently do you engage in SEO forecasting?
Monthly Annually
Quarterly Haly-yearly
Poll: #2 How frequently do you engage in SEO forecasting?
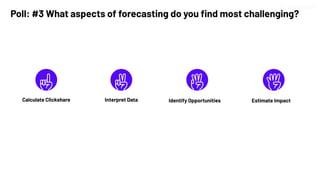
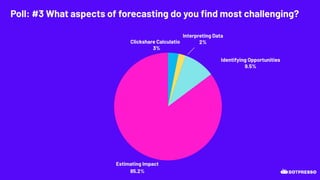
Poll: #3 What aspects of forecasting do you find most challenging?
Calculate Clickshare Estimate Impact
Interpret Data Identify Opportunities
Poll: #3 What aspects of forecasting do you find most challenging?
Clickshare Calculation
3%
Identifying Opportunities
9.5%
Interpreting Data
2%
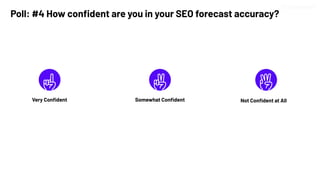
Poll: #4 How confident are you in your SEO forecast accuracy?
Very Confident Not Confident at All
Somewhat Confident
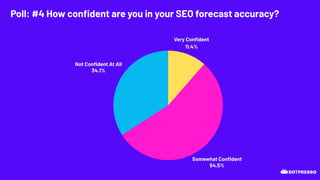
Poll: #4 How confident are you in your SEO forecast accuracy?
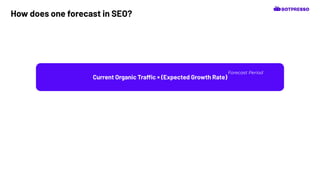
Current Organic Traffic × (Expected Growth Rate)
How does one forecast in SEO?
Forecast Period
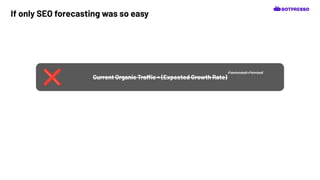
Current Organic Traffic × (Expected Growth Rate)
If only SEO forecasting was so easy
Forecast Period
❌
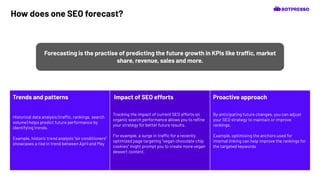
Historical data analysis (traffic, rankings, search
volume) helps predict future performance by
identifying trends.
Example, historic trend analysis “air conditioners”
showcases a rise in trend between April and May
Tracking the impact of current SEO efforts on
organic search performance allows you to refine
your strategy for better future results.
For example, a surge in traffic for a recently
optimized page targeting "vegan chocolate chip
cookies" might prompt you to create more vegan
dessert content.
By anticipating future changes, you can adjust
your SEO strategy to maintain or improve
rankings.
Example, optimising the anchors used for
internal linking can help improve the rankings for
the targeted keywords
Forecasting is the practise of predicting the future growth in KPIs like traffic, market
share, revenue, sales and more.
How does one SEO forecast?
Trends and patterns Impact of SEO efforts Proactive approach
Yet, your calculations wouldn’t be accurate 😔
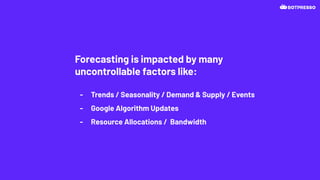
Forecasting is impacted by many
uncontrollable factors like:
- Trends / Seasonality / Demand & Supply / Events
- Google Algorithm Updates
- Resource Allocations / Bandwidth
Forecasting is a challenging job
with a lot of uncertainties 😔
Trends Insights Everything nice
What if we could use…
Let’s find out!
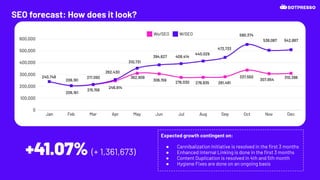
Here’s our attempt to
forecast growth
Expected growth contingent on:
● Cannibalization Initiative is resolved in the first 3 months
● Enhanced Internal Linking is done in the first 3 months
● Content Duplication is resolved in 4th and 5th month
● Hygiene Fixes are done on an ongoing basis
SEO forecast: How does it look?
+41.07% (+ 1,361,673)
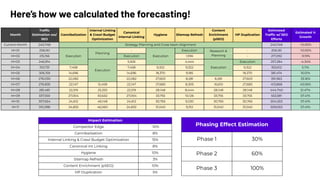
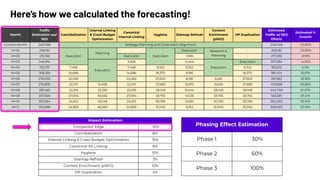
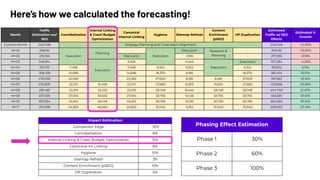
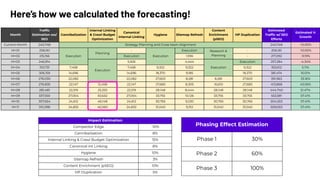
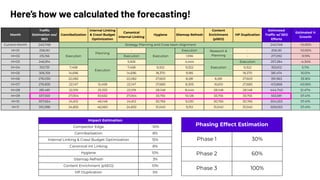
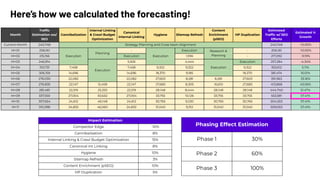
Here’s how we calculated the forecasting!
Phasing Effect Estimation
Phase 1 30%
Phase 2 60%
Phase 3 100%
Impact Estimation
Competitor Edge -10%
Cannibalization 8%
Internal Linking & Crawl Budget Optimization 15%
Canonical Int Linking 8%
Hygiene 10%
Sitemap Refresh 3%
Content Enrichment (pSEO) 10%
HP Duplication 5%
Month
Traffic
Estimation wo/
SEO
Cannibalization
Internal Linking
& Crawl Budget
Optimization
Canonical
Internal Linking
Hygiene Sitemap Refresh
Content
Enrichment
(pSEO)
HP Duplication
Estimated
Traffic w/ SEO
Efforts
Estimated %
Growth
Current Month 240,748 Strategy Planning and Cross-team Alignment 240,748 -10.00%
M+01 206,161
Execution
Planning
-
Execution
Execution Research &
Planning
- 206,161 -10.00%
M+02 215,156 Execution 1,936 - 217,092 -9.19%
M+03 246,914
Execution
5,926 4,444
Execution
Execution 257,284 -4.34%
M+04 310,731 7,458 7,458 9,322 9,322 9,322 353,612 5.11%
M+05 306,159 14,696 14,696 18,370 9,185 18,370 381,474 16.01%
M+06 276,030 22,082 22,082 27,603 8,281 8,281 27,603 391,963 33.16%
M+07 276,835 22,147 12,458 22,147 27,683 8,305 16,610 27,683 413,868 43.06%
M+08 281,481 22,519 25,333 22,519 28,148 8,444 28,148 28,148 444,740 51.47%
M+09 337,550 27,004 50,632 27,004 33,755 10,126 33,755 33,755 553,581 57.41%
M+10 307,654 24,612 46,148 24,612 30,765 9,230 30,765 30,765 504,553 57.41%
M+11 310,398 24,832 46,560 24,832 31,040 9,312 31,040 31,040 509,053 57.41%
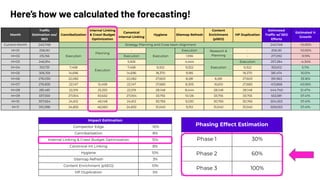
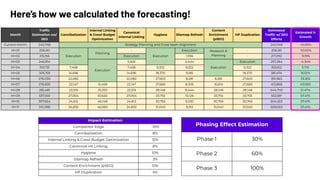
Here’s how we calculated the forecasting!
Phasing Effect Estimation
Phase 1 30%
Phase 2 60%
Phase 3 100%
Impact Estimation
Competitor Edge -10%
Cannibalization 8%
Internal Linking & Crawl Budget Optimization 15%
Canonical Int Linking 8%
Hygiene 10%
Sitemap Refresh 3%
Content Enrichment (pSEO) 10%
HP Duplication 5%
Month
Traffic
Estimation wo/
SEO
Cannibalization
Internal Linking
& Crawl Budget
Optimization
Canonical
Internal Linking
Hygiene Sitemap Refresh
Content
Enrichment
(pSEO)
HP Duplication
Estimated
Traffic w/ SEO
Efforts
Estimated %
Growth
Current Month 240,748 Strategy Planning and Cross-team Alignment 240,748 -10.00%
M+01 206,161
Execution
Planning
-
Execution
Execution Research &
Planning
- 206,161 -10.00%
M+02 215,156 Execution 1,936 - 217,092 -9.19%
M+03 246,914
Execution
5,926 4,444
Execution
Execution 257,284 -4.34%
M+04 310,731 7,458 7,458 9,322 9,322 9,322 353,612 5.11%
M+05 306,159 14,696 14,696 18,370 9,185 18,370 381,474 16.01%
M+06 276,030 22,082 22,082 27,603 8,281 8,281 27,603 391,963 33.16%
M+07 276,835 22,147 12,458 22,147 27,683 8,305 16,610 27,683 413,868 43.06%
M+08 281,481 22,519 25,333 22,519 28,148 8,444 28,148 28,148 444,740 51.47%
M+09 337,550 27,004 50,632 27,004 33,755 10,126 33,755 33,755 553,581 57.41%
M+10 307,654 24,612 46,148 24,612 30,765 9,230 30,765 30,765 504,553 57.41%
M+11 310,398 24,832 46,560 24,832 31,040 9,312 31,040 31,040 509,053 57.41%
No historical data?
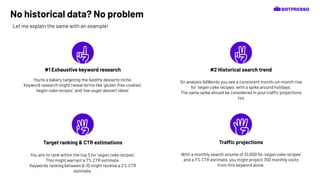
#1 Exhaustive keyword research
You're a bakery targeting the healthy desserts niche.
Keyword research might reveal terms like ‘gluten-free cookies’,
‘vegan cake recipes’, and ‘low-sugar dessert ideas’.
#2 Historical search trend
On analysis AdWords you see a consistent month-on-month rise
for ‘vegan cake recipes’, with a spike around holidays.
The same spike should be considered in your traffic projections
too
Target ranking & CTR estimations
You aim to rank within the top 3 for ‘vegan cake recipes’.
This might warrant a 7% CTR estimate.
Keywords ranking between 6-10 might receive a 2% CTR
estimate.
Traffic projections
With a monthly search volume of 10,000 for ‘vegan cake recipes’
and a 7% CTR estimate, you might project 700 monthly visits
from this keyword alone.
No historical data? No problem
Let me explain the same with an example!
Complicated
Full of assumptions
Why is SEO forecasting
so important?
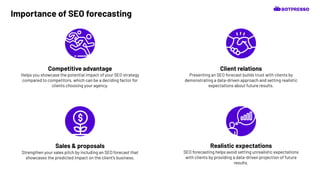
Importance of SEO forecasting
Competitive advantage
Helps you showcase the potential impact of your SEO strategy
compared to competitors, which can be a deciding factor for
clients choosing your agency.
Client relations
Presenting an SEO forecast builds trust with clients by
demonstrating a data-driven approach and setting realistic
expectations about future results.
Sales & proposals
Strengthen your sales pitch by including an SEO forecast that
showcases the predicted impact on the client's business.
Realistic expectations
SEO forecasting helps avoid setting unrealistic expectations
with clients by providing a data-driven projection of future
results.
What are the key
components of SEO
forecasting?
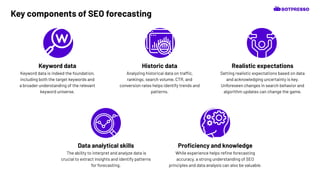
Data analytical skills
The ability to interpret and analyze data is
crucial to extract insights and identify patterns
for forecasting.
Keyword data
Keyword data is indeed the foundation,
including both the target keywords and
a broader understanding of the relevant
keyword universe.
”
Realistic expectations
Setting realistic expectations based on data
and acknowledging uncertainty is key.
Unforeseen changes in search behavior and
algorithm updates can change the game.
Historic data
Analyzing historical data on traffic,
rankings, search volume, CTR, and
conversion rates helps identify trends and
patterns.
Proficiency and knowledge
While experience helps refine forecasting
accuracy, a strong understanding of SEO
principles and data analysis can also be valuable.
Key components of SEO forecasting
What SEO forecasting
helps with?
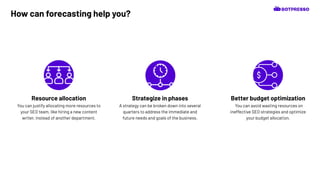
How can forecasting help you?
Better budget optimization
You can avoid wasting resources on
ineffective SEO strategies and optimize
your budget allocation.
Resource allocation
You can justify allocating more resources to
your SEO team, like hiring a new content
writer, instead of another department.
Strategize in phases
A strategy can be broken down into several
quarters to address the immediate and
future needs and goals of the business.
Things to consider
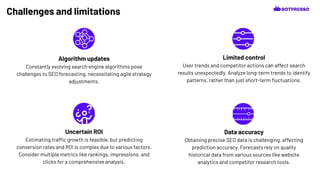
Challenges and limitations
Data accuracy
Obtaining precise SEO data is challenging, affecting
prediction accuracy. Forecasts rely on quality
historical data from various sources like website
analytics and competitor research tools.
Algorithm updates
Constantly evolving search engine algorithms pose
challenges to SEO forecasting, necessitating agile strategy
adjustments.
Limited control
User trends and competitor actions can affect search
results unexpectedly. Analyze long-term trends to identify
patterns, rather than just short-term fluctuations.
Uncertain ROI
Estimating traffic growth is feasible, but predicting
conversion rates and ROI is complex due to various factors.
Consider multiple metrics like rankings, impressions, and
clicks for a comprehensive analysis.
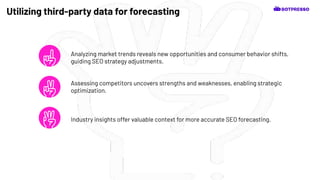
Analyzing market trends reveals new opportunities and consumer behavior shifts,
guiding SEO strategy adjustments.
Utilizing third-party data for forecasting
Assessing competitors uncovers strengths and weaknesses, enabling strategic
optimization.
Industry insights offer valuable context for more accurate SEO forecasting.
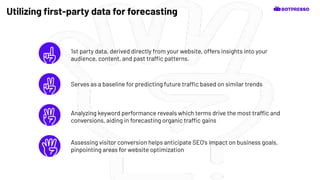
1st party data, derived directly from your website, offers insights into your
audience, content, and past traffic patterns.
Utilizing first-party data for forecasting
Serves as a baseline for predicting future traffic based on similar trends
Analyzing keyword performance reveals which terms drive the most traffic and
conversions, aiding in forecasting organic traffic gains
Assessing visitor conversion helps anticipate SEO's impact on business goals,
pinpointing areas for website optimization
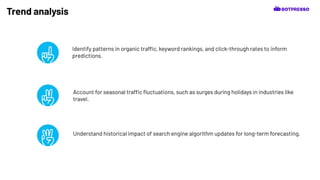
Trend analysis
Identify patterns in organic traffic, keyword rankings, and click-through rates to inform
predictions.
Understand historical impact of search engine algorithm updates for long-term forecasting.
Account for seasonal traffic fluctuations, such as surges during holidays in industries like
travel.
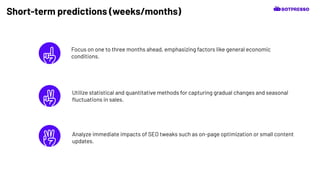
Short-term predictions (weeks/months)
Focus on one to three months ahead, emphasizing factors like general economic
conditions.
Analyze immediate impacts of SEO tweaks such as on-page optimization or small content
updates.
Utilize statistical and quantitative methods for capturing gradual changes and seasonal
fluctuations in sales.
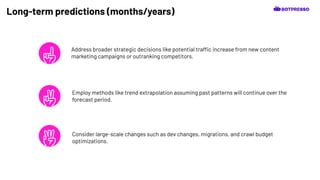
Long-term predictions (months/years)
Address broader strategic decisions like potential traffic increase from new content
marketing campaigns or outranking competitors.
Consider large-scale changes such as dev changes, migrations, and crawl budget
optimizations.
Employ methods like trend extrapolation assuming past patterns will continue over the
forecast period.
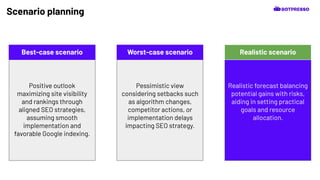
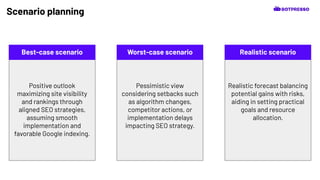
Scenario planning
Scenario planning
Pessimistic view
considering setbacks such
as algorithm changes,
competitor actions, or
implementation delays
impacting SEO strategy.
Positive outlook
maximizing site visibility
and rankings through
aligned SEO strategies,
assuming smooth
implementation and
favorable Google indexing.
Realistic forecast balancing
potential gains with risks,
aiding in setting practical
goals and resource
allocation.
Best-case scenario Worst-case scenario Realistic scenario
DO’s and DONT’s of SEO
forecasting
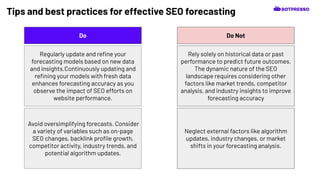
Tips and best practices for effective SEO forecasting
Regularly update and refine your
forecasting models based on new data
and insights.Continuously updating and
refining your models with fresh data
enhances forecasting accuracy as you
observe the impact of SEO efforts on
website performance.
Avoid oversimplifying forecasts. Consider
a variety of variables such as on-page
SEO changes, backlink profile growth,
competitor activity, industry trends, and
potential algorithm updates.
Rely solely on historical data or past
performance to predict future outcomes.
The dynamic nature of the SEO
landscape requires considering other
factors like market trends, competitor
analysis, and industry insights to improve
forecasting accuracy
Neglect external factors like algorithm
updates, industry changes, or market
shifts in your forecasting analysis.
Do Do Not
One last tip:
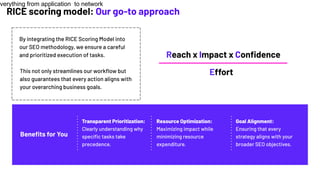
How should one prioritise tasks
By integrating the RICE Scoring Model into
our SEO methodology, we ensure a careful
and prioritized execution of tasks.
This not only streamlines our workflow but
also guarantees that every action aligns with
your overarching business goals.
Transparent Prioritization:
Clearly understanding why
specific tasks take
precedence.
Resource Optimization:
Maximizing impact while
minimizing resource
expenditure.
Goal Alignment:
Ensuring that every
strategy aligns with your
broader SEO objectives.
Benefits for You
Reach x Impact x Confidence
verything from application to network
Effort
RICE scoring model: Our go-to approach
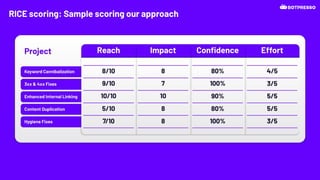
RICE scoring: Sample scoring our approach
Thank You 🚀