Saltar al contenido principal
THE WYCKOFF METHODOLOGY IN DEPTH
HOW TO TRADE FINANCIAL MARKETS
LOGICALLY
RUBÉN VILLAHERMOSA CHAVES
All rights reserved. No part of this work may be reproduced, incorporated into a computer system or
transmitted in any form or by any means (electronic, mechanical, photocopying, recording or
otherwise) without the prior written permission of the copyright holders. Infringement of these rights
may constitute a crime against intellectual property.
© Rubén Villahermosa, 2019
Independently published
CONTENTS
RICHARD WYCKOFF
PART 1 - HOW MARKETS MOVE
Chapter 1 - Waves
Chapter 2 - The price cycle
Chapter 3 - Trends
Types of trends
Chapter 4 - Assessing trends
Strength/weakness analysis
Lines
Chapter 5 – Trading Ranges
PART 2 - THE WYCKOFF METHOD
Chapter 6 - Wyckoff Methodology Structures
Basic accumulation Structure #1
Basic accumulation Structure #2
Basic distribution Structure #1
Basic distribution Structure #2
PART 3 - THE THREE FUNDAMENTAL LAWS
Chapter 7 - The law of supply and demand
Theory
Price shift
Chapter 8 - The Law of Cause and Effect
Elements to bear in mind
Point and Figure Graphics
Technical analysis for projection of objectives
Chapter 9 - The Law of Effort and Result
The importance of volume
Harmony and divergence
Analysis table
Effort/Result in Trends
Lack of interest
PART 4 - THE PROCESSES OF ACCUMULATION AND DISTRIBUTION
Chapter 10 - Accumulation
Stock control
The law of cause and effect
Handling maneuvers
Counterparty, liquidity
The path of least resistance
Common characteristics of the accumulation ranges
Beginning of the bullish movement
Chapter 11 - Reaccumulation
Stock Absorption
Duration of the structure
Reaccumulation or Distribution
Chapter 12 - Distribution
The law of cause and effect
Handling maneuvers
Counterparty, liquidity
The path of least resistance
Common characteristics of the distribution ranges
Beginning of the Bearish Movement
Chapter 13 - Redistribution
Redistribution or accumulation
Stock control
Duration of the structure
PART 5 - EVENTS
The list of events
Chapter 14 - Event #1: Preliminary Stop
Preliminary Support
Preliminary Supply
Chapter 15 - Event #2: Climax
Selling Climax
Buying Climax
Chapter 16 - Event #3: Reaction
Automatic Rally
Automatic Reaction
Chapter 17 - Event #4: Test
Secondary Test
The generic test
Where to look for tests
How the Test appears on the graph
The difference between the Secondary Test and the Generic Test
Chapter 18 - Event #5: Shaking
Spring/Shakeout
UpThrust After Distribution
Chapter 19 - Event #6: Breakout
Sign of Strength
Sign of Weakness
Chapter 20 - Event 7: Confirmation
Last Point of Support
Last Point of Supply
PART 6 - PHASES
Chapter 21 - Phase A: Stopping the previous trend
Chapter 22 - Phase B: Building the Cause
Chapter 23 - Phase C: Test
Chapter 24 - Phase D: Trend within range
Chapter 25 - Phase E: Trend out of range
PART 7 - TRADING
1. The context
2. The structures
3. Trading areas
Chapter 26 - Primary positions
In Phase C
In Phase D
In Phase E
Summary table of trading opportunities
Chapter 27 - Decision-making
The concept of the significant bar
The concept of reversal of movement
Position Management
PART 8 - CASE STUDIES
S&P500 Index ($ES)
Pound/Dollar cross ($6B)
Euro/Dollar cross ($6E)
Bitcoin ($BTCUSDT)
Inditex ($ITX)
Google ($GOOGL)
Australian Dollar/US Dollar cross ($6A)
BIBLIOGRAPHY
ACKNOWLEDGEMENTS
ABOUT THE AUTHOR
BOOKS OF THIS AUTOR
RICHARD WYCKOFF
Richard Wyckoff (1873-1934) became a Wall Street celebrity.
He was a forerunner in the investment world as he started as a
stockbroker at the age of 15 and by the age of 25 already owned his own
brokerage firm.
The method he developed of technical analysis and speculation arose
from his observation and communication skills.
Working as a Broker, Wyckoff saw the game of the big traders and
began to observe through the tape and the graphics the manipulations they
carried out and which they obtained high profits with.
He stated that it was possible to judge the future course of the market
by its own actions since the price action reflects the plans and purposes of
those who dominated it.
Wyckoff carried out its investment methods achieving a high return.
As time passed his altruism grew until he redirected his attention and passion
to education.
He wrote several books as well as the publication of a popular
magazine of the time "Magazine of Wall Street".
He felt compelled to compile the ideas he had gathered during his 40
years of Wall Street experience and bring them to the attention of the general
public. I wanted to offer a set of principles and procedures about what it takes
to win on Wall Street.
These rules were embodied in the 1931 course "The Richard D.
Wyckoff Method of Trading and Investing Stocks. A course of Instruction in
Stock Market Science and Technique" becoming the well-known Wyckoff
method.
PART 1 - HOW MARKETS MOVE
CHAPTER 1 - WAVES
Wyckoff and the first readers of the tape understood that the movements of
the price do not develop in periods of time of equal duration, but that they do
it in waves of different sizes, for this reason they studied the relation between
the upward and downward waves.
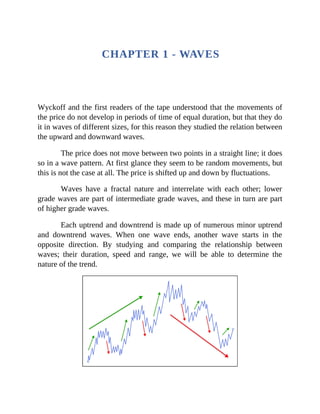
The price does not move between two points in a straight line; it does
so in a wave pattern. At first glance they seem to be random movements, but
this is not the case at all. The price is shifted up and down by fluctuations.
Waves have a fractal nature and interrelate with each other; lower
grade waves are part of intermediate grade waves, and these in turn are part
of higher grade waves.
Each uptrend and downtrend is made up of numerous minor uptrend
and downtrend waves. When one wave ends, another wave starts in the
opposite direction. By studying and comparing the relationship between
waves; their duration, speed and range, we will be able to determine the
nature of the trend.
Wave analysis provides a clear picture of the relative changes
between supply and demand and helps us judge the relative strength or
weakness of buyers and sellers as price movement progresses.
Through judicious wave analysis, the ability to determine the end of
waves in one direction and the beginning in the opposite direction will
gradually develop.
CHAPTER 2 - THE PRICE CYCLE
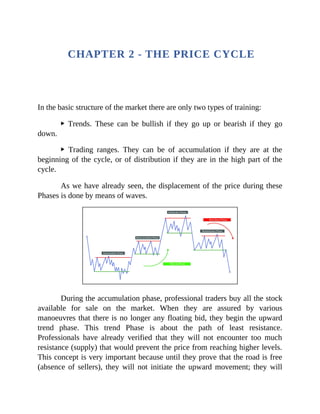
In the basic structure of the market there are only two types of training:
▶ Trends. These can be bullish if they go up or bearish if they go
down.
▶ Trading ranges. They can be of accumulation if they are at the
beginning of the cycle, or of distribution if they are in the high part of the
cycle.
As we have already seen, the displacement of the price during these
Phases is done by means of waves.
During the accumulation phase, professional traders buy all the stock
available for sale on the market. When they are assured by various
manoeuvres that there is no longer any floating bid, they begin the upward
trend phase. This trend Phase is about the path of least resistance.
Professionals have already verified that they will not encounter too much
resistance (supply) that would prevent the price from reaching higher levels.
This concept is very important because until they prove that the road is free
(absence of sellers), they will not initiate the upward movement; they will
carry out test maneuvers again and again. In case the offer is overwhelming,
the path of least resistance will be down and the price at that point can only
fall.
During the uptrend, buyers' demand is more aggressive than sellers'
supply. At this stage there is the participation of large traders who are less
well-informed and the general public whose demand shifts the price upwards.
The movement will continue until buyers and sellers consider the price to
have reached an interesting level; buyers will see it as valuable to close their
positions; and sellers will see it as valuable to start taking short positions.
The market has entered the distribution phase. A market ceiling will
be formed and it is said that the big traders are finishing distributing (selling)
the stock they previously bought. There is the entry of the last greedy buyers
as well as the entry for sale of well-informed traders.
When they find that the path of least resistance is now down, they
begin the downtrend phase. If they see that demand is present and with no
intention of giving up, this resistance to lower prices will only leave a viable
path: upward. If you continue to climb after a pause, this structure will be
identified as a reaccumulation phase. The same is true for the bearish case: if
the price comes in a bearish trend and there is a pause before continuing the
fall, that lateral movement will be identified as a redistribution phase.
During the downtrend sellers' supply is more aggressive than buyers'
demand so only lower prices can be expected.
Being able to determine at what stage of the price cycle the market is
at is a significant advantage. Knowing the general context helps us avoid
entering the wrong side of the market. This means that if the market is in a
bullish phase after accumulation we will avoid trading short and if it is in a
bearish phase after distribution we will avoid trading long. You may not
know how to take advantage of the trend movement; but with this premise in
mind, you will surely avoid having a loss by not attempting to trade against
the trend.
When the price is in phases of accumulation or uptrend it is said to be
in a buying position, and when it is in Phases of distribution or downtrend it
is said to be in a selling position. When there is no interest, that no campaign
has been carried out, it is said to be in neutral position.
A cycle is considered to be complete when all stages of the cycle are
observed: accumulation, uptrend, distribution, and downtrend. These
complete cycles occur in all time frames. This is why it is important to take
into account all the time frames; because each of them can be at different
stages. It is necessary to contextualize the market from this point of view in
order to carry out a correct analysis of it.
Once you learn to correctly identify the four price phases and assume
a totally impartial viewpoint, away from news, rumors, opinions and your
own prejudices, taking advantage of your operative will be relatively easier.
CHAPTER 3 - TRENDS
Prices change and the waves resulting from those price changes generate
trends. The price is moved by a series of waves in the direction of the trend
(impulses), which are separated by a series of waves in the opposite direction
(reversals).
The trend is simply the line of least resistance as the price moves from
one point to another because it follows the path of least resistance; therefore,
the trader's job is to identify the trend and trade in harmony with it.
When a market is rising and encounters resistance (sales), either
exceeds that resistance or the price will turn; the same happens when the
price is falling and encounters resistance; either exceeds those purchases or
the price will turn. These pivot points are critical moments and provide
excellent locations to trade.
Depending on the direction of movement, we can differentiate three
types of trends: bullish, bearish and lateral. The most objective description of
an uptrend is when the price makes a series of rising impulses and falls,
where highs and lows are increasing all the time. Similarly, we identify a
bearish trend when highs and lows are decreasing, leaving a series of
decreasing impulses and regressions. Finally, we determine a sideways
environment when highs and lows remain fluctuating within a price range.
Trends are divided by their duration into three different categories;
long, medium and short term. Since there are no strict rules for classifying
them according to the timeframe, they can be categorized according to how
they fit into the top. That is, the short term trend will be observed within the
medium term trend, which in turn will be within the long term trend.
TYPES OF TRENDS
Note that all three trends may not move in the same direction. This can
present potential problems for the trader. In order to be effective, doubts must
be eliminated as much as possible and the way to do this is to identify in
advance the type of trading to be carried out.
A very important condition to take into account when selecting the
type of trading is the Timing (entry calibration). Success in any kind of
operative mainly requires a good Timing; but success in short term trading
requires a perfect Timing. Because of this, a beginner should start with long-
term trading until he achieves consistent success.
Because trends may be different depending on the time frame, it is
possible but difficult to have buy and sell positions at the same time. If the
medium-term trend is bullish, you can take a buy position with the
expectation of holding it for a few weeks or months; and if in the meantime a
short term bearish trend appears, you can take a short sell position and hold
the buy trade at the same time.
Although theoretically possible, it is extremely difficult to maintain
the discipline necessary to maintain both positions at the same time. Only
experienced traders should do this. For the initiate it is best to trade in
harmony with the trend and not to trade on both sides simultaneously until
consistently profitable.
You must learn and understand the reasons, behavior patterns, and
emotions that control the market. A bull market is driven by greed, while a
bear market is driven by fear. These are the main emotions that drive the
markets. Greed leads to paying higher prices until it leads to what is known
as an overbought condition. On the other hand, the panic caused by falls leads
to wanting to get rid of positions and sell, adding more momentum to the
collapse until over-selling conditions are reached.
Having these emotions is not a negative thing, as long as they know
how to move towards a positive aspect and it is very clear that what is really
important is the protection of capital.
CHAPTER 4 - ASSESSING TRENDS
This interaction between supply and demand as a trend develops will leave
clues in the conformation of the price action. We have different tools to help
us assess trends.
Judiciously assessing the trend is key to determining your health. It
allows us to detect if any force gives signs of weakness or if the opposing
force is gaining strength. Our job is to go for strength and against weakness.
STRENGTH/WEAKNESS ANALYSIS
When the price is in trend, we expect greater strength from the pushing side.
We have to see it as a battle between buyers and sellers where we will try to
analyze the strength or weakness of both. The best way to assess current
strength/weakness is to compare it with previously developed movements.
A weakness in the price does not imply a change of trend, it is simply
a sign of loss of strength and tells us that we must be prepared for future
movements.
There are several ways to analyze market strength/weakness. The key
is comparison. Absolute values are not sought. It is a question of comparing
the current movements with the previous ones.
SPEED
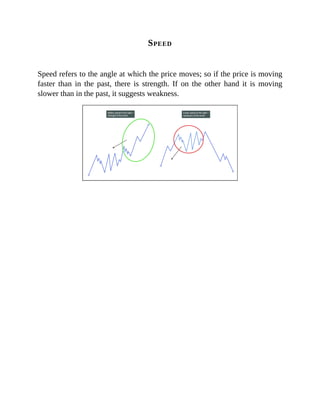
Speed refers to the angle at which the price moves; so if the price is moving
faster than in the past, there is strength. If on the other hand it is moving
slower than in the past, it suggests weakness.
PROJECTION
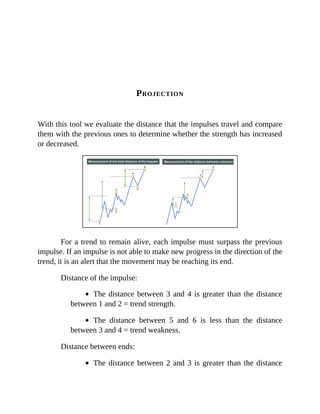
With this tool we evaluate the distance that the impulses travel and compare
them with the previous ones to determine whether the strength has increased
or decreased.
For a trend to remain alive, each impulse must surpass the previous
impulse. If an impulse is not able to make new progress in the direction of the
trend, it is an alert that the movement may be reaching its end.
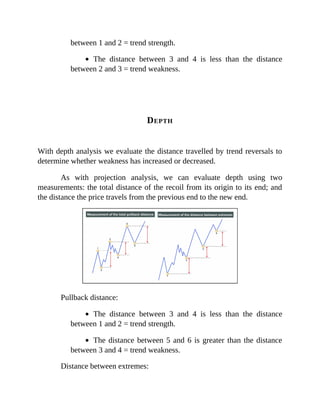
Distance of the impulse:
The distance between 3 and 4 is greater than the distance
between 1 and 2 = trend strength.
The distance between 5 and 6 is less than the distance
between 3 and 4 = trend weakness.
Distance between ends:
The distance between 2 and 3 is greater than the distance
between 1 and 2 = trend strength.
The distance between 3 and 4 is less than the distance
between 2 and 3 = trend weakness.
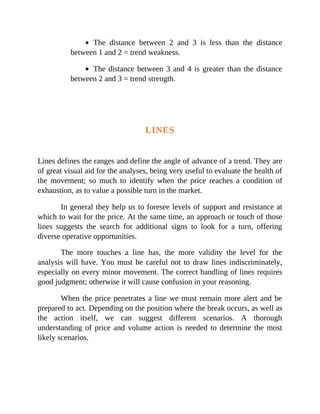
DEPTH
With depth analysis we evaluate the distance travelled by trend reversals to
determine whether weakness has increased or decreased.
As with projection analysis, we can evaluate depth using two
measurements: the total distance of the recoil from its origin to its end; and
the distance the price travels from the previous end to the new end.
Pullback distance:
The distance between 3 and 4 is less than the distance
between 1 and 2 = trend strength.
The distance between 5 and 6 is greater than the distance
between 3 and 4 = trend weakness.
Distance between extremes:
The distance between 2 and 3 is less than the distance
between 1 and 2 = trend weakness.
The distance between 3 and 4 is greater than the distance
between 2 and 3 = trend strength.
LINES
Lines defines the ranges and define the angle of advance of a trend. They are
of great visual aid for the analyses, being very useful to evaluate the health of
the movement; so much to identify when the price reaches a condition of
exhaustion, as to value a possible turn in the market.
In general they help us to foresee levels of support and resistance at
which to wait for the price. At the same time, an approach or touch of those
lines suggests the search for additional signs to look for a turn, offering
diverse operative opportunities.
The more touches a line has, the more validity the level for the
analysis will have. You must be careful not to draw lines indiscriminately,
especially on every minor movement. The correct handling of lines requires
good judgment; otherwise it will cause confusion in your reasoning.
When the price penetrates a line we must remain more alert and be
prepared to act. Depending on the position where the break occurs, as well as
the action itself, we can suggest different scenarios. A thorough
understanding of price and volume action is needed to determine the most
likely scenarios.
HORIZONTAL LINES
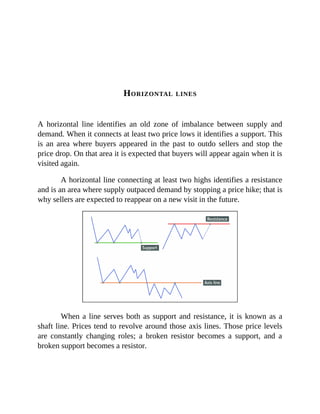
A horizontal line identifies an old zone of imbalance between supply and
demand. When it connects at least two price lows it identifies a support. This
is an area where buyers appeared in the past to outdo sellers and stop the
price drop. On that area it is expected that buyers will appear again when it is
visited again.
A horizontal line connecting at least two highs identifies a resistance
and is an area where supply outpaced demand by stopping a price hike; that is
why sellers are expected to reappear on a new visit in the future.
When a line serves both as support and resistance, it is known as a
shaft line. Prices tend to revolve around those axis lines. Those price levels
are constantly changing roles; a broken resistor becomes a support, and a
broken support becomes a resistor.
TREND LINES
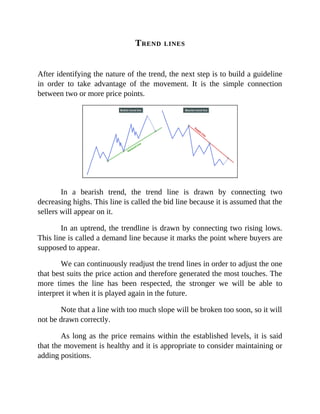
After identifying the nature of the trend, the next step is to build a guideline
in order to take advantage of the movement. It is the simple connection
between two or more price points.
In a bearish trend, the trend line is drawn by connecting two
decreasing highs. This line is called the bid line because it is assumed that the
sellers will appear on it.
In an uptrend, the trendline is drawn by connecting two rising lows.
This line is called a demand line because it marks the point where buyers are
supposed to appear.
We can continuously readjust the trend lines in order to adjust the one
that best suits the price action and therefore generated the most touches. The
more times the line has been respected, the stronger we will be able to
interpret it when it is played again in the future.
Note that a line with too much slope will be broken too soon, so it will
not be drawn correctly.
As long as the price remains within the established levels, it is said
that the movement is healthy and it is appropriate to consider maintaining or
adding positions.
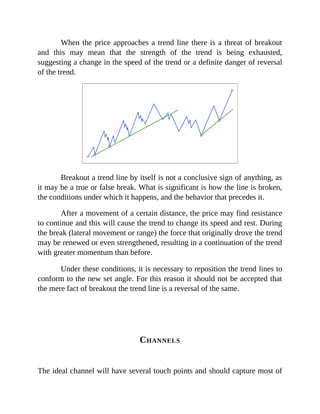
When the price approaches a trend line there is a threat of breakout
and this may mean that the strength of the trend is being exhausted,
suggesting a change in the speed of the trend or a definite danger of reversal
of the trend.
Breakout a trend line by itself is not a conclusive sign of anything, as
it may be a true or false break. What is significant is how the line is broken,
the conditions under which it happens, and the behavior that precedes it.
After a movement of a certain distance, the price may find resistance
to continue and this will cause the trend to change its speed and rest. During
the break (lateral movement or range) the force that originally drove the trend
may be renewed or even strengthened, resulting in a continuation of the trend
with greater momentum than before.
Under these conditions, it is necessary to reposition the trend lines to
conform to the new set angle. For this reason it should not be accepted that
the mere fact of breakout the trend line is a reversal of the same.
CHANNELS
The ideal channel will have several touch points and should capture most of
the price within its limits.
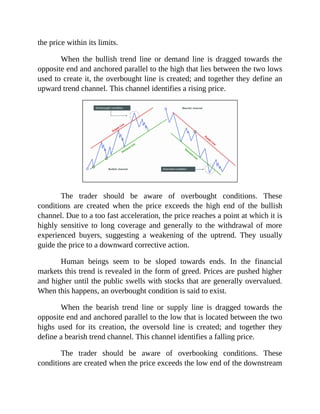
When the bullish trend line or demand line is dragged towards the
opposite end and anchored parallel to the high that lies between the two lows
used to create it, the overbought line is created; and together they define an
upward trend channel. This channel identifies a rising price.
The trader should be aware of overbought conditions. These
conditions are created when the price exceeds the high end of the bullish
channel. Due to a too fast acceleration, the price reaches a point at which it is
highly sensitive to long coverage and generally to the withdrawal of more
experienced buyers, suggesting a weakening of the uptrend. They usually
guide the price to a downward corrective action.
Human beings seem to be sloped towards ends. In the financial
markets this trend is revealed in the form of greed. Prices are pushed higher
and higher until the public swells with stocks that are generally overvalued.
When this happens, an overbought condition is said to exist.
When the bearish trend line or supply line is dragged towards the
opposite end and anchored parallel to the low that is located between the two
highs used for its creation, the oversold line is created; and together they
define a bearish trend channel. This channel identifies a falling price.
The trader should be aware of overbooking conditions. These
conditions are created when the price exceeds the low end of the downstream
channel. Due to too fast a bearish movement, the price reaches a point at
which it is highly sensitive to short coverage (profit taking) and a general
withdrawal of experienced traders who were sold; suggesting a weakening of
the bearish trend. They usually guide the price to an upward corrective action.
In a bear market there is another extreme that takes control; fear. As
the price falls, traders become alarmed. The lower they go, the more
frightened they get. Fear reaches a level that weak hands can't stand and sell
their shares. This selling panic generates an overselling condition.
Those periods of overbought or overbought that lead to the stop of the
movements can be seen in any temporality.
INVERTED LINES
In high-speed conditions where a clear trend has not yet been established,
inverted lines are a good way to try to set up at least initially the price
movement.
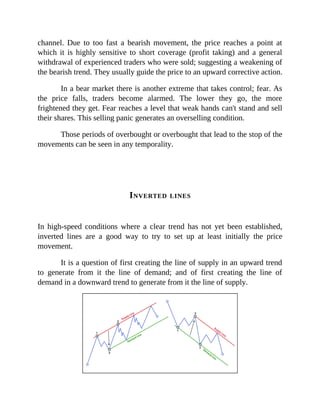
It is a question of first creating the line of supply in an upward trend
to generate from it the line of demand; and of first creating the line of
demand in a downward trend to generate from it the line of supply.
At the beginning of a bullish advance, in case the price has made two
important upward thrusts without leaving any significant bearish retreat, one
can estimate at what point to expect the price to retreat by first creating the
supply line in order to drag it and create the bullish trend line; and in the
same way, first draw the demand line in order to create from it the bearish
trend line.
CONVERGING LINES
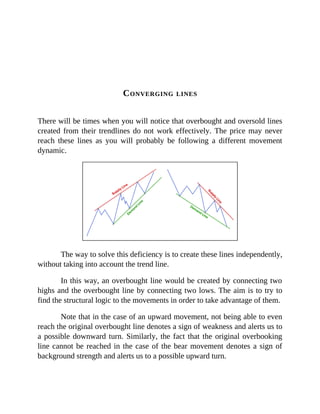
There will be times when you will notice that overbought and oversold lines
created from their trendlines do not work effectively. The price may never
reach these lines as you will probably be following a different movement
dynamic.
The way to solve this deficiency is to create these lines independently,
without taking into account the trend line.
In this way, an overbought line would be created by connecting two
highs and the overbought line by connecting two lows. The aim is to try to
find the structural logic to the movements in order to take advantage of them.
Note that in the case of an upward movement, not being able to even
reach the original overbought line denotes a sign of weakness and alerts us to
a possible downward turn. Similarly, the fact that the original overbooking
line cannot be reached in the case of the bear movement denotes a sign of
background strength and alerts us to a possible upward turn.
Visually they are observed as exhaustion patterns.
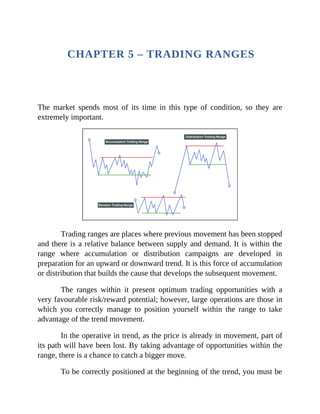
CHAPTER 5 – TRADING RANGES
The market spends most of its time in this type of condition, so they are
extremely important.
Trading ranges are places where previous movement has been stopped
and there is a relative balance between supply and demand. It is within the
range where accumulation or distribution campaigns are developed in
preparation for an upward or downward trend. It is this force of accumulation
or distribution that builds the cause that develops the subsequent movement.
The ranges within it present optimum trading opportunities with a
very favourable risk/reward potential; however, large operations are those in
which you correctly manage to position yourself within the range to take
advantage of the trend movement.
In the operative in trend, as the price is already in movement, part of
its path will have been lost. By taking advantage of opportunities within the
range, there is a chance to catch a bigger move.
To be correctly positioned at the beginning of the trend, you must be
able to analyze price action and volume during range development.
Fortunately, the Wyckoff methodology offers unique guidelines with which
the trader can successfully perform this task. The identification of events and
the analysis of Phases become indispensable tools for the correct reading of
the range.
If you don't see a clearly defined trend, the price is most likely in a
range context. This neutral or lateral trend may have three main interests
behind it: it is accumulating, in preparation for an upward movement; it is
distributing, in preparation for a downward movement; or it is fluctuating up
and down without any defined interest.
Random fluctuations should be ignored as there is probably no
professional interest behind that market. It is important to understand that in
not all trading ranges there is professional interest; and that therefore, if these
interests are not involved in a security, the price simply fluctuates because it
is in balance and movements in one direction are neutralized with movements
in the opposite direction.
On the basis of the law of cause and effect, it is necessary for the price
to consume time within the range in preparation for the subsequent
movement. And that movement will be directly proportional to the time spent
in the range. This means that shorter ranges will generate shorter movements
and that longer ranges will generate movements that will travel longer
distances.
To define a range two points are required to build the channel. As
long as the price remains within the range, no major movement will occur.
The key is in the ends. When these are broken, they can offer excellent
trading opportunities.
Be clear that the decisive move to break the range and start the trend
Phase cannot occur until a clear imbalance between supply and demand has
been generated. At that point, the market must be in the control of the
professionals and they must have confirmed that the direction in which they
will direct the price movement is the path of least resistance.
This means that if they have accumulated with the intention of
launching prices upwards, they will first verify that they will not find
resistance (sales) to stop that rise. When they see that the road is clear, they
will initiate movement. Similarly, if they have been distributing (selling) with
the intention of lowering prices, they need to make sure that the floating
demand (buyer interest) is relatively low.
PART 2 - THE WYCKOFF METHOD
Many of Wyckoff's basic principles have become basic foundations of
technical analysis. The three fundamental laws: Supply and Demand, Cause
and Effect and Effort and Result; the concepts of Accumulation/Distribution
and the supremacy of Price and Volume when determining price movements
are some examples.
The Wyckoff method has passed the test of time. More than 100 years
of continuous development and use have proven the value of the method to
trade all kinds of financial instruments.
This achievement should not come as a surprise as it relies on the
analysis of price and volume action to judge how it reacts to the battle
between the real forces that govern all price changes: supply and demand.
CHAPTER 6 - WYCKOFF METHODOLOGY
STRUCTURES
Financial markets are a living thing, they are constantly changing due to their
continuous interaction between buyers and sellers. This is why it would be a
mistake to use fixed patterns or schemes to try to read the context of the
market.
Aware that it is practically impossible for price to develop two
identical structures, the trading approach proposed by the Wyckoff
methodology is flexible when analyzing the market.
The price can develop different types of structures depending on the
conditions in which it is found. This is why we need an approach that gives
some flexibility to price movements but at the same time is governed by
certain fixed elements that provide as much objectivity as possible to the
reading.
These fixed aspects of the methodology are the events and Phases that
make up the development of the structures. Below we present two basic
schemes of accumulation and distribution to provide a very general idea of
the dynamics in which price moves under the premises of the Wyckoff
methodology.
As we have just said, these schemes can be considered as ideals. The
important thing to keep in mind is that the market will not always present
them this way.
BASIC ACCUMULATION STRUCTURE #1
Accumulation. The process by which large traders absorb available stock
from the market. This is a transfer from retail traders or "weak hands" to
strong traders or "strong hands".
Creek. Resistance level for accumulation or reaccumulation
structures. It is established by the high generated by the Automatic Rally and
by the highs that can be developed during Phase B.
CHoCH. Change of Character. Change of character. It indicates the
environment in which the price will move soon. The first CHoCH is
established in Phase A where the price moves from a downward trend to a
consolidation environment. The second CHoCH is set from the low of Phase
C to the high of SOS in which the price moves from a consolidation
environment to an upward trend environment.
Phase A. Stopping the previous bearish trend.
PS. Preliminary Support. It's the first attempt to stop the
downward movement that will always fail.
SC. Selling Climax. Climax action that stops the downward
movement.
AR. Automatic Rally. Bullish reaction. An upward
movement that sets the trading range high.
ST. Secondary Test. Test of the level of supply in relation
to climax action. Establishes the end of Phase A and the beginning
of Phase B.
Phase B. Construction of the cause.
UA. Upthrust Action. Temporary breakout of the resistance
and re-entry into the range. This is a test at the high generated by
the AR.
ST as SOW. Secondary Test as Sign Of Weakness. Sample
of weakness in test function. Temporary break of the support and
re-entry to the range. This is a test at the low generated by the SC.
Phase C. Test
Spring. It is a test in the form of breakout of the lows of
Phases A and B. There are three different types of Springs.
Test Spring. Downward movement towards lows of the
range in order to check the commitment of the sellers.
LPS. Last Point of Support. Test in the form of a bearish
movement that fails to reach the low range.
TSO. Terminal Shakeout or Shakeout. Abrupt movement
of low breakout that produce a deep penetration of the level of
support and a fast recovery.
Phase D. Bullish trend within the range.
SOS. Sign of Strength. Bullish movement generated after
the Phase C Test event that manages to reach the top of the range.
Also called JAC. Jump Across the Creek. Creek jump.
LPS. Last Point of Support. These are the rising troughs we
find in the upward movement towards resistance.
BU. Back Up. This is the last big reaction before the bull
market starts. Also called BUEC. Back Up to the Edge of the
Creek. Back to the creek.
Phase E. Bullish trend out of range. Succession of SOS and LPS
generating a dynamic of rising highs and lows.
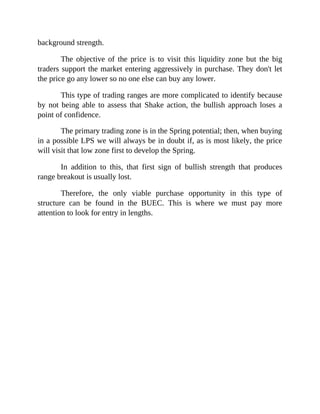
BASIC ACCUMULATION STRUCTURE #2
Second variant of the methodology in which the test event in Phase C fails to
reach the lows of the structure.
It usually occurs because current market conditions denote
background strength.
The objective of the price is to visit this liquidity zone but the big
traders support the market entering aggressively in purchase. They don't let
the price go any lower so no one else can buy any lower.
This type of trading ranges are more complicated to identify because
by not being able to assess that Shake action, the bullish approach loses a
point of confidence.
The primary trading zone is in the Spring potential; then, when buying
in a possible LPS we will always be in doubt if, as is most likely, the price
will visit that low zone first to develop the Spring.
In addition to this, that first sign of bullish strength that produces
range breakout is usually lost.
Therefore, the only viable purchase opportunity in this type of
structure can be found in the BUEC. This is where we must pay more
attention to look for entry in lengths.
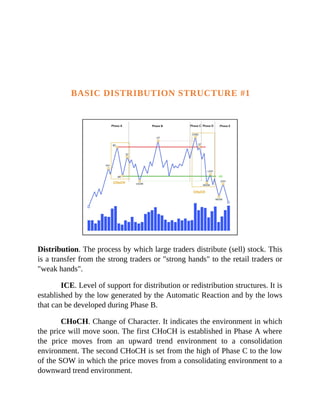
BASIC DISTRIBUTION STRUCTURE #1
Distribution. The process by which large traders distribute (sell) stock. This
is a transfer from the strong traders or "strong hands" to the retail traders or
"weak hands".
ICE. Level of support for distribution or redistribution structures. It is
established by the low generated by the Automatic Reaction and by the lows
that can be developed during Phase B.
CHoCH. Change of Character. It indicates the environment in which
the price will move soon. The first CHoCH is established in Phase A where
the price moves from an upward trend environment to a consolidation
environment. The second CHoCH is set from the high of Phase C to the low
of the SOW in which the price moves from a consolidating environment to a
downward trend environment.
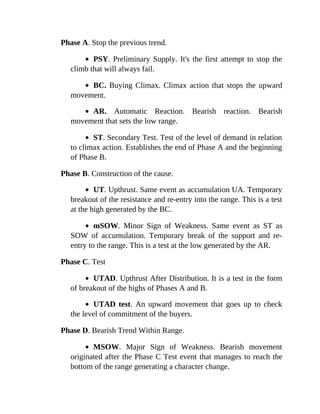
Phase A. Stop the previous trend.
PSY. Preliminary Supply. It's the first attempt to stop the
climb that will always fail.
BC. Buying Climax. Climax action that stops the upward
movement.
AR. Automatic Reaction. Bearish reaction. Bearish
movement that sets the low range.
ST. Secondary Test. Test of the level of demand in relation
to climax action. Establishes the end of Phase A and the beginning
of Phase B.
Phase B. Construction of the cause.
UT. Upthrust. Same event as accumulation UA. Temporary
breakout of the resistance and re-entry into the range. This is a test
at the high generated by the BC.
mSOW. Minor Sign of Weakness. Same event as ST as
SOW of accumulation. Temporary break of the support and re-
entry to the range. This is a test at the low generated by the AR.
Phase C. Test
UTAD. Upthrust After Distribution. It is a test in the form
of breakout of the highs of Phases A and B.
UTAD test. An upward movement that goes up to check
the level of commitment of the buyers.
Phase D. Bearish Trend Within Range.
MSOW. Major Sign of Weakness. Bearish movement
originated after the Phase C Test event that manages to reach the
bottom of the range generating a character change.
LPSY. Last Point of Supply. These are the decreasing
highs we find in the bearish movement towards support.
Phase E. Bearish trend out of range. Succession of SOW and LPSY
generating a dynamic of lower highs and lows.
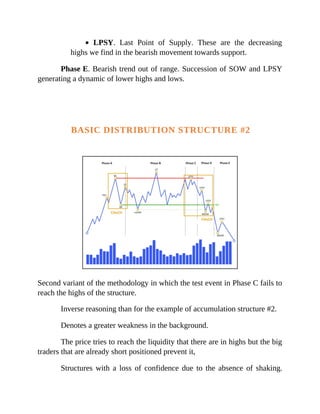
BASIC DISTRIBUTION STRUCTURE #2
Second variant of the methodology in which the test event in Phase C fails to
reach the highs of the structure.
Inverse reasoning than for the example of accumulation structure #2.
Denotes a greater weakness in the background.
The price tries to reach the liquidity that there are in highs but the big
traders that are already short positioned prevent it,
Structures with a loss of confidence due to the absence of shaking.
When going short on the possible LPSY we will always be in doubt as to
whether the price will shake to highs before falling.
The sign of weakness (SOW) that breaks the structure is lost. Unique
opportunity to the breakout test (LPSY).
PART 3 - THE THREE
FUNDAMENTAL LAWS
CHAPTER 7 - THE LAW OF SUPPLY AND
DEMAND
Richard Wyckoff applied this fundamental law of economics to financial
markets and presented a series of statements: if demand was greater than
supply, the price of the product would rise; that if supply was greater than
demand, the price of the product would fall; and that if supply and demand
were in balance, the price of the product would be maintained.
This idea is very general and should be nuanced because there is a
very common error in thinking that prices go up because there are more
buyers than sellers or that they go down because there are more sellers than
buyers.
In the market there is always the same number of buyers and sellers;
for someone to buy, there must be someone to sell to.
THEORY
In the market there are buyers and sellers who interrelate to match their
orders. According to auction theory, the market seeks to facilitate this
exchange between buyers and sellers; and this is why volume (liquidity)
attracts price.
The general accepted theory in economics tells us that supply is
created by sellers by placing sales (pending) limit orders in the ASK column
and demand is created by buyers by placing purchase limit orders in the BID
column.
There is a very common error in calling everything to do with the
purchase demand and everything to do with the sale offer. Ideally, different
terms should be used to distinguish between aggressive traders and passive
traders.
The terms supply and demand correspond to taking a passive attitude
by placing limit orders in the BID and ASK columns.
While when a trader takes the initiative and goes to the BID column
to execute an aggressive (to market) order, he is known as a seller; and when
he goes to the ASK column, he is known as a buyer.
All this is a mere formality and has more to do with theory in
economics than with practice. The key to everything is in the types of orders
that are executed. We must differentiate between market orders (aggressive)
and limit orders (passive).
Passive orders represent only intention, they have the capacity to stop
a movement; but not the capacity to make the price move. This requires
initiative.
PRICE SHIFT
INITIATIVE
In order for the price to move upwards, buyers have to buy all available sell
orders at that price level and also continue to buy aggressively to force the
price up one level and find new sellers there to trade with.
Passive buy orders cause the bearish movement to slow down, but on
their own they cannot raise the price. The only orders that have the ability to
move the price up are those purchases to market or those by whose crossing
of orders becomes purchases to market.
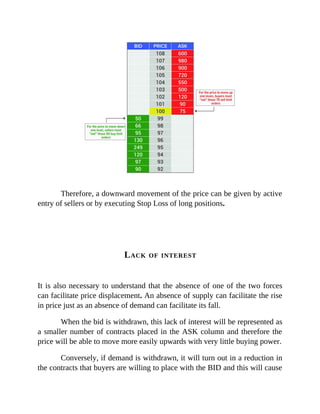
Therefore, an upward movement of the price can be given by active
entry of buyers or by executing Stop Loss of short positions.
For the price to move downwards, sellers have to purchase all
available purchase orders (demand) at that price level and continue to push
downward by forcing the price to search for buyers at lower levels.
Passive sell orders cause the bullish movement to slow down, but it
does not have the ability to bring the price down on its own. The only orders
that have the ability to move the price down are sales to market or those by
whose crossing of orders becomes sales to market.
Therefore, a downward movement of the price can be given by active
entry of sellers or by executing Stop Loss of long positions.
LACK OF INTEREST
It is also necessary to understand that the absence of one of the two forces
can facilitate price displacement. An absence of supply can facilitate the rise
in price just as an absence of demand can facilitate its fall.
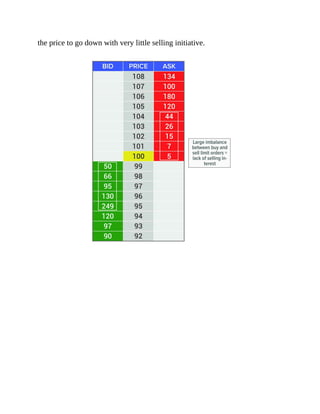
When the bid is withdrawn, this lack of interest will be represented as
a smaller number of contracts placed in the ASK column and therefore the
price will be able to move more easily upwards with very little buying power.
Conversely, if demand is withdrawn, it will turn out in a reduction in
the contracts that buyers are willing to place with the BID and this will cause
the price to go down with very little selling initiative.
CONCLUSION
Regardless of the origin of the purchase or sale order (trader retail,
institutional, algorithm and so on.) the result is that liquidity is added to the
market; and this is what is really important when trading.
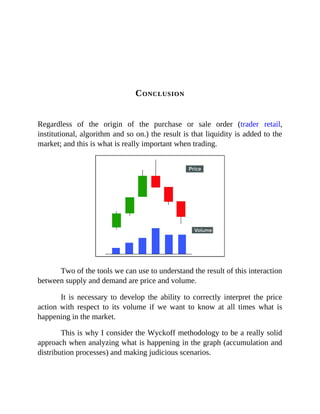
Two of the tools we can use to understand the result of this interaction
between supply and demand are price and volume.
It is necessary to develop the ability to correctly interpret the price
action with respect to its volume if we want to know at all times what is
happening in the market.
This is why I consider the Wyckoff methodology to be a really solid
approach when analyzing what is happening in the graph (accumulation and
distribution processes) and making judicious scenarios.
CHAPTER 8 - THE LAW OF CAUSE AND
EFFECT
The idea is that something cannot happen out of nowhere; that to see a
change in price, a root cause must first have been built.
Generally, causes are constructed through a major change of hands
between well-informed and uninformed traders.
In the case of individual transactions, the cause for the price to rise is
the buyer's desire to want those shares or the seller's desire to want that
money.
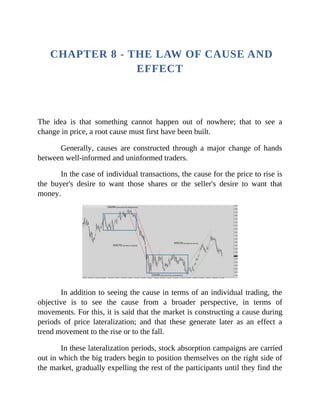
In addition to seeing the cause in terms of an individual trading, the
objective is to see the cause from a broader perspective, in terms of
movements. For this, it is said that the market is constructing a cause during
periods of price lateralization; and that these generate later as an effect a
trend movement to the rise or to the fall.
In these lateralization periods, stock absorption campaigns are carried
out in which the big traders begin to position themselves on the right side of
the market, gradually expelling the rest of the participants until they find the
path on which the price will be directed free of resistance.
An important aspect of this law is that the effect realized by the cause
will always be in direct proportion to that cause. Consequently, a great cause
will produce a greater effect, and a small cause will result in a lesser effect.
It is logical to think that the longer the period of time the market
spends in a rank condition developing a campaign, the greater the distance
the subsequent trend movement will travel.
The key is to understand that it is during the lateral price Phases that
the accumulation/distribution processes take place.
Depending on its duration and the efforts we see during its formation
(manipulation manoeuvres such as shaking), this cause will provoke a
response movement upwards or downwards (effect).
ELEMENTS TO BEAR IN MIND
There are certain market conditions, such as climatic events, which can cause
a sharp turn in the price without a great deal of preparation.
The big traders use these climax candles to accumulate/distribute all
the stock they need without developing a more extensive campaign and
starting from there the expected movement.
Another aspect to keep in mind is that not all ranges are accumulation
or distribution processes. This point is very important.
Remember that the methodology tells us that there will be structures
that are simply price fluctuations and do not have a motivating cause.
POINT AND FIGURE GRAPHICS
In principle the projection of the effect will be unknown, but we can propose
it as proportional to the effort that provoked it.
Wyckoff used the point and figure graph to quantify cause and
estimate effect.
By means of the horizontal counting of columns the possible
objectives are estimated. It is about providing a good indication of how far a
movement can go. Accumulation would produce an upward count while
distribution would project it downward.
Unlike bar charts, which are time-based; point and figure charts are
based on volatility.
In order for the dot and figure chart to advance to the right and
generate a new column, it first requires a price movement in the opposite
direction.
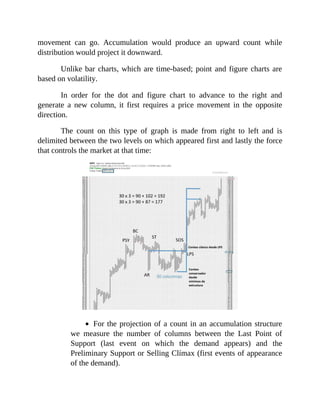
The count on this type of graph is made from right to left and is
delimited between the two levels on which appeared first and lastly the force
that controls the market at that time:
For the projection of a count in an accumulation structure
we measure the number of columns between the Last Point of
Support (last event on which the demand appears) and the
Preliminary Support or Selling Clímax (first events of appearance
of the demand).
For the projection of a distribution count we measure the
number of columns between the Last Point of Supply and the
Preliminary Supply or Buying Clímax.
For the reaccumulation ranges the count is made from the
Last Point of Support to the Automatic Reaction (as this is the first
event on which the demand appeared).
For the redistribution ranges the count is made from the
Last Point of Support to the Automatic Rally (the first event on
which the offer appeared).
After counting the number of boxes that make up the range, the result
is multiplied by the value of the box.
The classic projection is obtained by adding the resulting figure to the
price on which the LPS/LPSY is produced.
To obtain a moderate projection, the resulting figure is added to the
price of the highest end reached.
In the distribution ranges, the highest high will generally be
that set by the Upthrust (UT) or Buying Climax (BC).
For the accumulation ranges, the lowest low will generally
be the Spring (SP) or Selling Clímax (SC).
Get a more conservative projection by dividing the area into Phases.
Counts from and to where price turns occur. Count the number of boxes that
make up each Phase and multiply it by the value of the box. The resulting
figure is added to the price of the LPS/LPSY or to the price of the highest
extreme reached.
Just because the value has ample preparation does not mean that the
whole area is accumulation or distribution. This is why point and figure
counts do not always reach the objective of greatest scope and therefore it is
suggested to divide the range in order to generate several counts and thus
establish different objectives.
TECHNICAL ANALYSIS FOR PROJECTION OF
OBJECTIVES
There are traders who consider that the projection of targets by counting the
point and figure graph is not very operative in today's markets.
There is also a problem with the point and figure at the time of its
preparation because there are several ways to do it. This makes it useless
from my point of view since this subjectivity makes me lose confidence in
this tool.
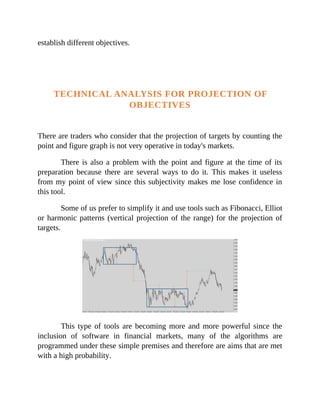
Some of us prefer to simplify it and use tools such as Fibonacci, Elliot
or harmonic patterns (vertical projection of the range) for the projection of
targets.
This type of tools are becoming more and more powerful since the
inclusion of software in financial markets, many of the algorithms are
programmed under these simple premises and therefore are aims that are met
with a high probability.
CONCLUSION
Since the market moves under this law of cause and effect by using the lateral
Phases to generate the subsequent movements, I believe that it can give us an
advantage to try to decipher what is "baking" during the development of these
structures.
And to try to figure out what's going on there, the Wyckoff
methodology gives us excellent tools.
Wyckoff traders know that it is in these lateral conditions from where
the movements are born and that is why we are continuously looking for the
beginning of new structures to begin to analyze the action of price and
volume with the objective of positioning ourselves before the development of
the trend movement.
A trend will end and a cause will begin. A cause will end and a trend
will begin. The Wyckoff method is centered around the interpretation of these
conditions.
CHAPTER 9 - THE LAW OF EFFORT AND
RESULT
In financial markets, effort is represented by volume while the result is
represented by price.
This means that the price action must reflect the volume action.
Without effort it can't have worked.
The aim is to assess the dominance of buyers or sellers through
convergence and divergence between price and volume.
THE IMPORTANCE OF VOLUME
Price is not the only important factor in financial markets. Perhaps even more
important is the character of the volume.
These two elements (price and volume) are part of the cornerstone of
the Wyckoff methodology.
Volume identifies the amount of stock (stocks, units, contracts) that
has changed hands. When large traders are interested in a security, this will
be reflected in the volume traded.
This is the first key concept: the participation of large traders is
identified by an increase in volume.
HARMONY AND DIVERGENCE
A significant increase in volume indicates the presence of professional
money with the aim of producing a movement (continuation or spin).
If the effort is in harmony with the result it is a sign of strength of the
movement and suggests its continuation. If the effort is in divergence with the
result it is a sign of weakness of the movement and suggests a reversal.
It should also be noted that the price movement will be in direct
proportion to the amount of effort expended.
If harmony is suggested, a greater effort will cause a movement of
long duration; while a slight effort will be reflected in a movement of shorter
duration.
On the other hand, if divergence is suggested, the result tends to be in
direct proportion to that divergence. A smaller divergence tends to generate a
smaller result and a larger divergence, a larger result.
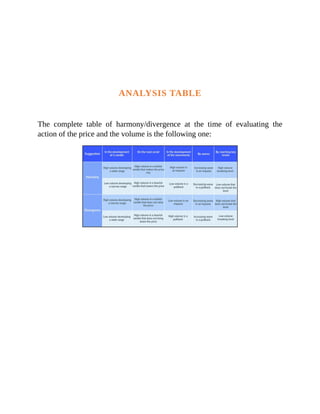
ANALYSIS TABLE
The complete table of harmony/divergence at the time of evaluating the
action of the price and the volume is the following one:
IN THE DEVELOPMENT OF A CANDLE
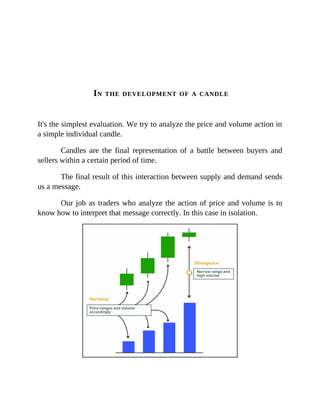
It's the simplest evaluation. We try to analyze the price and volume action in
a simple individual candle.
Candles are the final representation of a battle between buyers and
sellers within a certain period of time.
The final result of this interaction between supply and demand sends
us a message.
Our job as traders who analyze the action of price and volume is to
know how to interpret that message correctly. In this case in isolation.
We are looking for an agreement between the price ranges and the
volume traded. For that message to convey harmony, we want to see wide
ranges in the volume peaks and narrow ranges in the low volumes. The
opposite would mark a divergence.
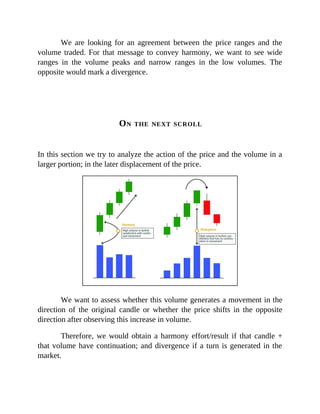
ON THE NEXT SCROLL
In this section we try to analyze the action of the price and the volume in a
larger portion; in the later displacement of the price.
We want to assess whether this volume generates a movement in the
direction of the original candle or whether the price shifts in the opposite
direction after observing this increase in volume.
Therefore, we would obtain a harmony effort/result if that candle +
that volume have continuation; and divergence if a turn is generated in the
market.
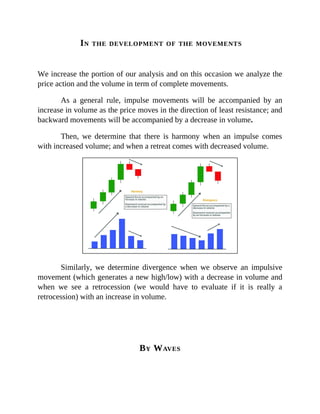
IN THE DEVELOPMENT OF THE MOVEMENTS
We increase the portion of our analysis and on this occasion we analyze the
price action and the volume in term of complete movements.
As a general rule, impulse movements will be accompanied by an
increase in volume as the price moves in the direction of least resistance; and
backward movements will be accompanied by a decrease in volume.
Then, we determine that there is harmony when an impulse comes
with increased volume; and when a retreat comes with decreased volume.
Similarly, we determine divergence when we observe an impulsive
movement (which generates a new high/low) with a decrease in volume and
when we see a retrocession (we would have to evaluate if it is really a
retrocession) with an increase in volume.
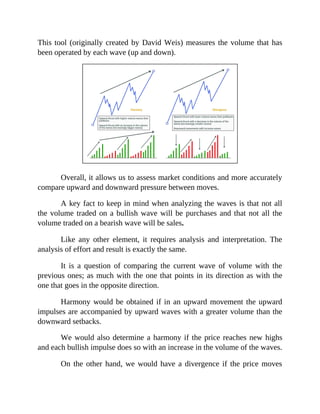
BY WAVES
This tool (originally created by David Weis) measures the volume that has
been operated by each wave (up and down).
Overall, it allows us to assess market conditions and more accurately
compare upward and downward pressure between moves.
A key fact to keep in mind when analyzing the waves is that not all
the volume traded on a bullish wave will be purchases and that not all the
volume traded on a bearish wave will be sales.
Like any other element, it requires analysis and interpretation. The
analysis of effort and result is exactly the same.
It is a question of comparing the current wave of volume with the
previous ones; as much with the one that points in its direction as with the
one that goes in the opposite direction.
Harmony would be obtained if in an upward movement the upward
impulses are accompanied by upward waves with a greater volume than the
downward setbacks.
We would also determine a harmony if the price reaches new highs
and each bullish impulse does so with an increase in the volume of the waves.
On the other hand, we would have a divergence if the price moves
upwards but the rising waves are less and less; or if in that moving upwards
the falling waves show greater strength.
BY REACHING KEY LEVELS
It is one more way to evaluate this law of effort and result; this time, in terms
of broken levels.
It is simple: if you approach a level with volume and make an
effective break we will say that there is harmony effort/result in that breakout
movement. That volume was intended to move forward and has absorbed all
the orders that were placed there.
If, on the other hand, you approach a level with volume and make a
false break, we will say that there is divergence. All of that operated volume
has been participating in the opposite direction to the level break.
It can be applied to any type of level. Whether horizontal (supports
and resistances), with slope (trend lines, channel lines, inverted lines,
converging, diverging), dynamic levels (moving averages, VWAP, bands); as
well as any other level that establishes a specific methodology.
EFFORT/RESULT IN TRENDS
In addition to what was previously studied, the evaluation of the effort/result
can be included in other more general market contexts such as trends.
Generally, large relative volumes accompany the termination of a
large movement, especially if accompanied by small price advances.
Therefore, a strong volume after a strong bearish trend indicates that
the fall is almost complete. It may be a sales climax and you're probably
starting an accumulation.
Similarly, a strong volume after a prolonged uptrend indicates that the
end of the uptrend is near and that the distribution Phase may be beginning.
LACK OF INTEREST
Turns do not always take place when there is a considerable volume (effort)
and a comparatively small price movement (result).
We find another way capable of causing a price twist; and that is lack
of interest. Small volumes on market floors (after a considerable decline), or
after a bearish reversal, generally indicate lack of selling pressure.
If there is no interest in continuing to fall, an appearance of buyers
now would cause a turn upside. Similarly, small volumes on market ceilings
(after a considerable rise) or after a bullish retreat, usually indicate lack of
buying pressure that would lead the price to a bearish turn with the
appearance of sellers.
Remember that sudden relative increases or decreases in volume are
significant and will help you identify when a movement may be ending or
about to end.
PART 4 - THE PROCESSES OF
ACCUMULATION AND
DISTRIBUTION
CHAPTER 10 - ACCUMULATION
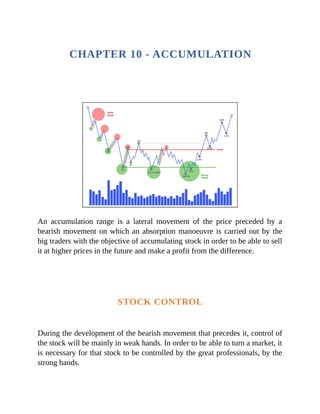
An accumulation range is a lateral movement of the price preceded by a
bearish movement on which an absorption manoeuvre is carried out by the
big traders with the objective of accumulating stock in order to be able to sell
it at higher prices in the future and make a profit from the difference.
STOCK CONTROL
During the development of the bearish movement that precedes it, control of
the stock will be mainly in weak hands. In order to be able to turn a market, it
is necessary for that stock to be controlled by the great professionals, by the
strong hands.
As the price falls, the stock gradually changes hands; the more it falls,
the greater the stock is in strong positions. It is during the development of the
accumulation structure that the final process of absorption takes place. The
moment at which the price is ready to start the upturn.
THE LAW OF CAUSE AND EFFECT
It is in these range conditions where we see in operation the law of cause and
effect in trading; which tells us that for there to be an effect, there must first
be a cause that originates it; and that the effect will be in direct proportion to
the cause.
In the case of the accumulation range, the purchase of stock (cause)
will have the effect of a subsequent upward trend movement; and the extent
of this movement will be in direct proportion to the time the price has spent
building that cause (absorbing the stock).
The preparation of an important movement takes considerable time. A
large trader cannot buy everything he wants all at once because if he executes
an order with all the quantity he wants, he would get worse prices due to the
displacement his own order would generate.
In order to perform this task, professionals need to plan and execute a
careful plan with which to try to absorb all available stock at the lowest
possible average price.
HANDLING MANEUVERS
In the accumulation process, large traders create an environment of extreme
weakness. The news at this point is likely to be bad and many will be
influenced to enter the wrong side of the market. By means of various
manoeuvres, they manage to make themselves little by little with all the
available offer.
In the accumulation range we observe a fundamental event that
characterizes this type of context since in many occasions it is the action that
initiates the trend movement. It's the bearish shake, also known as "Spring" It
is a sudden downward movement which breaks the support level of the range
and with which the big traders are used to carry out a triple function: To
reach the stop loss of those traders who were well positioned on the long
side; to induce for sale the ill-informed traders who think in the continuation
of the downward movement; and to profit from such movement.
While it is true that this shaking event is an action that adds strength
to the bullish scenario, it is also true that it will not always happen. You
should be aware that on many occasions the development of the uptrend will
begin without this terminal action. This is a context that is somewhat more
difficult to determine but equally valid.
At the same time, they need to take the "weak hands" out of the
market. These are traders who, if they are positioned to buy, will very soon
close their positions assuming short profits; and this closing of buy positions
are sales orders that the big traders will have to keep absorbing if they want
to keep pushing the price. One action they take to get rid of this type of weak
trader is to generate a flat, boring market context in order to discourage these
traders from finally closing their positions.
COUNTERPARTY, LIQUIDITY
Both the fact of reaching the stops of the purchase positions, as well as the
entry in sale of some traders, provides liquidity to the professionals that are
accumulating; since both actions execute sales to market; and these sales are
the counterpart that the big traders need to marry their purchases.
In addition to this, when the bullish reversal occurs back into the
range, stops will also be executed for those who entered with selling positions
during the bearish break, adding strength to the bullish movement.
THE PATH OF LEAST RESISTANCE
Professionals with interests above will not initiate the movement until they
have verified that the path of least resistance is on the rise. This is achieved
by carrying out various tests to check the level of commitment of the sellers.
As with Spring, they will initiate downward movements to verify the
tracking it has. An absence of volume at this point would suggest a lack of
interest in reaching lower prices.
This is why sometimes you see more than one Shake within the range;
these are tests that professionals develop to make sure they won't find
resistance at higher prices.
COMMON CHARACTERISTICS OF THE
ACCUMULATION RANGES
The following are key features of the accumulation ranges:
Decrease in volume and volatility as the range develops. There
will be less and less stock available for sale and therefore price and
volume fluctuations will be gradually reduced.
Tests to the high zone of the range without volume, suggesting
an absence of selling interest; except when the price is prepared to
initiate the movement out of the range.
Springs to previous lows; either over the support area or over
minor lows within the range.
Wider and smoother upward movements and bars than
downward movements. This denotes an influx of good quality
demand and suggests that supply is of poor quality.
Development of rising highs and lows. This sequence should
already be observed in the last stage of the range, just before the
start of the bullish jump. Denotes total control by buyers.
BEGINNING OF THE BULLISH MOVEMENT
When there is no longer any stock to be absorbed, a turning point takes place.
Value control is in the hands of the strong and they will only get rid of their
positions at much higher prices. A slight increase in demand now would
provoke a sudden upward movement in prices, initiating the upward trend.
CHAPTER 11 - REACCUMULATION
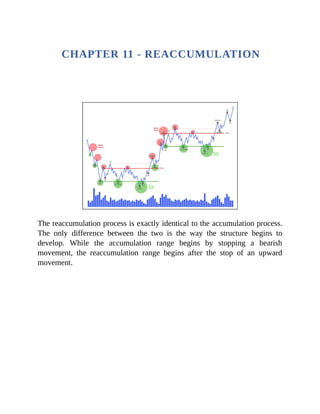
The reaccumulation process is exactly identical to the accumulation process.
The only difference between the two is the way the structure begins to
develop. While the accumulation range begins by stopping a bearish
movement, the reaccumulation range begins after the stop of an upward
movement.
STOCK ABSORPTION
A reaccumulation is the result of a previous uptrend that needs to be
consolidated. The hands that control the value will change during the course
of the trend.
At the beginning of an uptrend, the value is under the control of very
strong owners (professional traders, strong hands), but as it develops, the
stock will gradually shift to less informed traders, weak hands.
At this point, it is said that the demand is of poor quality and the
market needs to restart a process of stock absorption in which again it is the
big traders who take control.
DURATION OF THE STRUCTURE
A key point to keep in mind is that the duration of this structure will be
influenced by the percentage of strong and weak hands that have control of
the value.
If at the beginning of the reaccumulation the value is still mainly in
strong hands, the duration of the structure will be shorter. If, on the other
hand, it is the weak hands that control most of the stock, a longer period of
time will be necessary to be able to redevelop the purchasing process.
The aims of the main accumulation will not yet be met and this
structure is developed to add new demand to the market with which to
continue the upward movement towards these aims.
REACCUMULATION OR DISTRIBUTION
A judicious analysis of price and volume action is very important in order not
to make the mistake of confusing a reaccumulation range with a distribution
range.
Both are initiated in the same way, after the stop of an upward
movement. It becomes necessary to automate the characteristics of the
accumulation ranges, as this is one of the most compromising situations that
any Wyckoff trader will encounter.
CHAPTER 12 - DISTRIBUTION
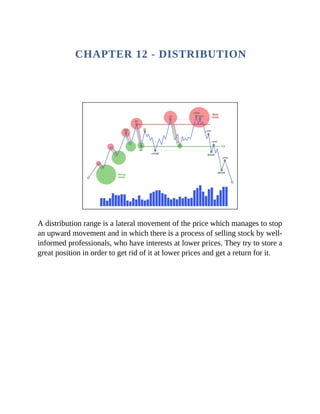
A distribution range is a lateral movement of the price which manages to stop
an upward movement and in which there is a process of selling stock by well-
informed professionals, who have interests at lower prices. They try to store a
great position in order to get rid of it at lower prices and get a return for it.
THE LAW OF CAUSE AND EFFECT
It is in these range conditions where we see in trading the law of cause and
effect so common in the world of trading; which tells us that for there to be
an effect, there must first be a cause that originates it; and that the effect will
be in direct proportion to the cause.
In the case of the distribution range, the sale of stock (cause) will have
the effect of a subsequent downward trend movement; and the extent of this
movement will be in direct proportion to the time the price has spent building
that cause (absorbing the stock).
The preparation of an important movement takes considerable time. A
large trader cannot build his entire position at once because if he executes his
sell orders with an order containing all the quantity he wants, the very
aggressiveness of the order would shift the price downwards until he finds
the necessary demand with which to match his sell orders and this would lead
to worse prices.
In order to perform this task, professionals need to develop and carry
out a careful plan with which to try to absorb all available market demand at
the highest possible average price.
HANDLING MANEUVERS
During this distribution process, the large traders, supported by the media
(often at their service) generate an environment of extreme strength. What
they are looking for with this is to attract as many traders as possible since it
will be the purchases of these traders who will give the necessary counterpart
to match their sales orders.
Misinformed traders don't know that strong professionals are building
a great selling position because they have interests below. You'll be entering
the wrong side of the market. By means of various manoeuvres, they are able
to make themselves little by little with all the available demand.
In the distribution range, as in the accumulation range, we will be
presented with the fundamental event of the shock. While it is true that not all
structures will see this action before starting the trend movement, the fact of
its presence adds great strength to the scenario.
In the case of a bullish shock, the Wyckoff methodology calls it
"Upthrust". This is a sudden upward movement which breaks the resistance
level of the range and with which large traders are used to carry out a triple
function: Reach the stops loss of those traders who were well positioned on
the short side; induce in buy to ill-informed traders who think in the
continuation of the bullish movement; and profit from such movement.
At the same time, they need to take the "weak hands" out of the
market. These are traders who, if positioned for sale, will very soon close
their positions assuming short profits; and this closing of sale positions are
buy orders that the big traders will have to keep absorbing if they want to
keep pushing the price. One action they take to get rid of this type of weak
trader is to generate a flat, boring market context in order to discourage these
traders from finally closing their positions.
COUNTERPARTY, LIQUIDITY
The professionals who are building their position are obliged to carry out this
type of manoeuvre. Due to the magnitude of their positions, it is the only way
they have to be able to trade in the markets. They need liquidity with which
to match their orders and the shake event is a great opportunity to get it.
The stop jumping of sell positions, as well as traders entering long,
are buy orders that must necessarily be crossed with a sell order. And indeed,
it is the well-informed traders who are placing those sales orders and thus
absorbing all the purchases that are executed.
In addition, when the bearish reversal occurs after the shake, the stops
of those who bought will also be executed, adding strength to the bearish
movement.
THE PATH OF LEAST RESISTANCE
Once the development of the range is coming to an end, the great
professionals will not initiate the downward trend movement until they can
verify that effectively the path of least resistance is down.
They do this through tests with which they evaluate the buyer's
interest. They initiate upward movements and depending on the second
participation (this will be observed by the volume traded in that movement)
they will value if demand remains available or if on the contrary the buyers
are exhausted. An absence of volume at this point would suggest a lack of
interest in reaching higher prices.
This is why you sometimes see more than one Shake in the range;
these are tests that professionals develop to make sure they won't find
resistance at lower prices.
COMMON CHARACTERISTICS OF THE
DISTRIBUTION RANGES
The following are key characteristics of the distribution ranges:
High volume and volatility during range development. Wide
price fluctuations will be observed and the volume will remain
relatively high and constant.
Tests to the lower zone of the range without volume, suggesting
an absence of buyer interest; except when the price is prepared to
initiate the movement out of the range.
Upward Shakes to previous highs; either over the resistance area
or over minor highs within the range.
Wider and more fluid movements and down bars than up
movements and up bars. This denotes entry of quality supply and
suggests that demand is of poor quality.
Development of lower highs and lows. This sequence should
already be observed in the last stage of the range, just before the
start of the bearish jump. What it suggests is that short traders are
becoming more aggressive.
BEGINNING OF THE BEARISH MOVEMENT
When demand is no longer available, a turning point takes place. Value
control is in the hands of the strong and they will only get rid of their
positions at much lower prices. A slight increase in supply now would
provoke a sharp downward movement in prices, initiating the downward
trend.
CHAPTER 13 - REDISTRIBUTION
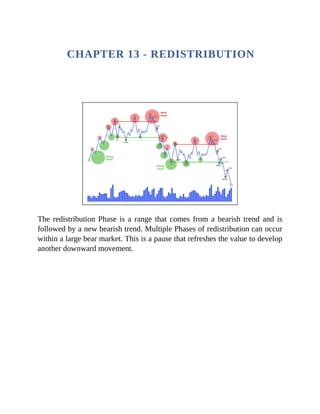
The redistribution Phase is a range that comes from a bearish trend and is
followed by a new bearish trend. Multiple Phases of redistribution can occur
within a large bear market. This is a pause that refreshes the value to develop
another downward movement.
REDISTRIBUTION OR ACCUMULATION
This type of structure starts the same as the accumulation ranges; therefore a
very judicious analysis is necessary in order not to lead to erroneous
conclusions. This aspect is undoubtedly one of the most difficult tasks for the
Wyckoff trader: to know how to distinguish between a redistribution range
and an accumulation range.
STOCK CONTROL
During the periods of redistribution, the great professional who is already
short returns to sell around the top of the range and potentially cover
(close/buy) some of his positions near the base of the range.
In general, they are increasing the size of their short position during
range development. The reason they close some of their short positions at the
base of the range is to provide price support and not to push it down
prematurely before they can establish a significant short position.
Redistribution remains volatile during and at the end of its
development before continuing the downtrend.
The hands that control the value will change during the course of the
trend. At the beginning of a bearish trend, the value is under the control of
very strong owners (professional traders, strong hands), but as it develops,
the stock will gradually change towards less informed traders, weak hands.
At this point, it is said that the supply is of poor quality and the market needs
to restart a process of stock absorption in which again it is the big traders who
take control.
DURATION OF THE STRUCTURE
The percentage of strong and weak hands that have control of the value will
influence the duration of the structure. If at the beginning of the redistribution
the value is still mainly in strong hands, the duration of the structure will be
shorter. If, on the other hand, it is the weak hands that control most of the
stock, a longer period of time will be necessary to be able to redevelop the
sales process.
The objectives of the main distribution will not yet be met and this
structure is being developed to add new selling positions to the market with
which to continue the downward movement towards these objectives.
PART 5 - EVENTS
The Wyckoff methodology attempts to identify logical patterns of price turn
during which market control is defined.
In this section we will present the sequence that follows the price in
the development of these structures. Although there are traders who apply it
differently, from my point of view it is advisable to observe such events from
a practical point of view, subtracting rigidity and providing as much
flexibility as possible to the analysis.
The events are the same for both accumulations and distributions. The
only thing that changes in some cases is the name, but the underlying logic
behind them is the same. We will divide the sections by events and within
them we will explain both the example of upward and downward turns.
THE LIST OF EVENTS
Although they will be further developed later, we make a brief summary of
the logic of each of the events that will appear:
EVENT #1: PRELIMINARY STOP
The preliminary stop is the first attempt to stop the trend movement
underway, the result of which will always fail. It is an early warning that the
trend may be coming to an end.
EVENT Nº2: CLÍMAX
This is the culmination movement of the preceding trend. After having
covered a great distance, the price will reach an extreme condition that will
provoke the appearance of the great professional.
EVENT Nº3: REACTION
It is the first great signal that suggests the change of sentiment in the market.
We go from a market in control by either of the two forces to a market in
balance.
EVENT Nº4: TEST
This event has different readings depending on the location where it takes
place. In general terms it tries to evaluate the commitment or absence of it on
the part of the traders in a certain moment and direction.
EVENT Nº5: SHAKING
Key moment for the structure analysis. It is the last deception developed by
the professional before initiating the trend movement in favor of the least
resistance.
EVENT Nº6: BREAKOUT
It is the greatest proof of commitment that the professional has to assume. If
you have done a good previous work of absorption, you will break relatively
easily the structure in order to continue the movement out of it.
EVENT #7: CONFIRMATION
If the analysis is correct, a rupture test will be developed which will confirm
that the professional is positioned in that direction and supports the
movement.
CHAPTER 14 - EVENT #1: PRELIMINARY
STOP
This is the first Wyckoff method event that appears to initiate the Phase A
stop of the previous trend.
In the case of accumulation schemes, it is called Preliminary Support
(PS), which together with the Selling Climax (SC), the Automatic Rally (AR)
and the Secondary Test (ST) produces the change in character with which it
makes the price evolve from a downward trend environment to a
lateralisation environment.
In the example of the distribution structures it is called Preliminary
Supply (PSY), which in conjunction with the Buying Climax (BC), the
Automatic Reaction (AR) and the Secondary Test (ST), puts an end to Phase
A, stopping the previous upward trend and initiating Phase B, the
construction of the cause.
As we know, the processes of accumulation and distribution require
time and on rare occasions the price will develop a hypodermic structure
visually leaving a V turn. This accumulation process begins with this first
event, with Preliminary Support and Preliminary Supply.
Before this event takes place, the market will find itself in a clear
trend. At some point, the price will reach a level attractive enough for large
traders that they will begin to participate more aggressively.
HOW THE PRELIMINARY STOP APPEARS ON THE GRAPHIC
The observation of this event on the graph is generally misinterpreted as it is
not necessarily necessary to observe a bar with increased volume and
expansion in the ranges.
It can also be seen on a set of bars with a relatively narrower range
and a constant high volume during all of them; or even on a single bar with a
high volume and a large wick. These representations in the end denote the
same thing: the first relevant entry of the big traders.
He recalls one of the most important quotes from Tom Williams' book
"Master the Markets" in which he says something like that the market does
not like large trend bars with significant volume increase after a prolonged
move as they usually denote an opposite sentiment.
Observing a large bearish bar with a peak of volume and closing at
the low after a prolonged downward movement is a very clear indication of
professional buying.
It is likely that this stock will reach an oversold condition in relation
to the bearish channel that is respecting the price stock during the bearish
movement.
THE PSYCHOLOGY BEHIND THE PRELIMINARY STOP
We are now going to study the crossing of orders that takes place during such
action. Remember, for someone to buy, there must be someone to sell.
Ask yourself what both the misinformed trader or "weak hand" and
the well-informed trader or "strong hand" are doing at that point.
As we have commented, after determining that the market has reached
a value price on which to start a campaign, the one that will be absorbing all
the stock will be the large trader; and it is the ill-informed traders who are
providing them with all the liquidity they need to build their positions.
We found different profiles of ill-informed traders that facilitate this
fact:
The greedy. There will be a group who see price move
abruptly and enter the market to avoid being left out of a potential
move in their favor.
The fearful. This group has been holding losing positions
for a long period of time and its limit is very close. After seeing the
price move again against them and for fear of further increasing the
loss, they finally decide to abandon their position.
The smart ones. They will have been able to anticipate the
turn and they will already be in the market; but their timing has not
been precise and this movement takes them out making them jump
their protection stops.
USES OF THE PRELIMINARY STOP
But then, what's the point of identifying this first stop event? As we have
already mentioned, this is the first stop action of the previous trend
movement and therefore we can draw two clear conclusions:
Stop thinking about continuing to trade in favor of the
previous trend at least initially, as the structure has yet to be
confirmed as continuing or turning.
This is an excellent point to take profits.
PRELIMINARY SUPPORT
As we know that a bearish trend does not stop at once, it is possible to find
numerous attempts to stop the fall before the successful one takes place. It's
the inertia of the trend. It is like a moving vehicle; once the cruising speed is
reached, even releasing the foot of the accelerator, the car will continue in the
direction for a time by its own inertia.
Those entire stop attempts are Preliminary Support. The more there
are, the more likely it is that the last end of the bearish trend will finally take
place without a significant increase in volume.
The fact of seeing repeated Preliminary Support suggests that the
professional has been eliminating offer from the market and when the last
low is reached, few will be willing to sell; and this will make that last end
take place without a peak in volume. It will also be a Selling Climax, in this
case without an ultra-high volume: the movement stops due to exhaustion.
We'll talk about it when we develop this climatic event.
Actually, they are Preliminary Support from a functional point of
view; because for the Wyckoff methodology, the Preliminary Support as such
will be the penultimate attempt to stop the downtrend (the last will be the
Selling Climax). Therefore, it would be best to label them as potential
Preliminary Support.
This potential PS will be confirmed as the genuine PS when the price
develops the four Phase A events that establish the character change.
This first participation of the professional does not imply that the
price should be rotated immediately. As we have already commented; in
certain market conditions the price will develop a V turn accumulating all the
necessary stock during the fall. We repeat that although this type of
hypodermic accumulation is not the most likely, we must be alert to its
possible development.
PRELIMINARY SUPPLY
Before the real Preliminary Supply takes place, the most logical thing would
be to find ourselves with numerous previous attempts. These attempts should
be labeled as potential Preliminary Supply.
The fact of seeing repeated Preliminary Supply suggests that the
professional has been eliminating demand from the market and when the last
high is reached, there will be few who are willing to buy; and this could
cause that last end to take place without a significant volume.