
Recomendados
Recomendados
Más contenido relacionado
La actualidad más candente
La actualidad más candente (20)
Destacado
Similar a F021203036039
Similar a F021203036039 (20)
F021203036039
- 1. The International Journal Of Engineering And Science (IJES) ||Volume||2 ||Issue|| 12||Pages|| 36-39||2013|| ISSN(e): 2319 – 1813 ISSN(p): 2319 – 1805 Application Of Electrical Resistivity Method In Delineating Geological Boundary In Kakara Village, Kano State, Nigeria 1 Ibrahim Abubakar , 2 Aliyu N.S , 3Ahmed A.L. , 4Chimeke Collins 1 2 Petroleum Product Price Regulation Agency (PPPRA) Lagos. Department of Physics ,Federal College Of Education, Okene, Kogi State. 3 Department of Physics, Ahmadu Bello University, Zaria, Nigeria. --------------------------------------------------------ABSTRACT--------------------------------------------------------------A geophysical study was carried out using Electrical resistivity method to delineated the boundary between basement complex and sedimentary rocks in kakara village, kano state. This area marks a contact zone between basement complex of northern Nigeria and sedimentary rock of chad basin formation. Twenty four Vertical Electric Soundings (VES) ware carried out within the study area using Geopulse tarameter SAS 300 and a two profiles were created with twelve VES point at each profile. Maximum current electrode separation (AB) of 200m that is (AB/2)=100m,using normal schlumberger electrode configuration. The data obtain from the field was processed using computer software IX1D. The interpreted result was used to produce geologic sections. The result reveal sedimentary rock laying uncomformity on the basement rock with thickness range from 0 to 5m.The result shows considerable agreement with the lithilogical section revealed and borehole data from the near area. KEY WORD: Vertical electrical sounding, Kakara Village, Geologic section, Resistivity. --------------------------------------------------------------------------------------------------------------------------------------Date of Submission: 2 December 2013 Date of Acceptance: 31 December 2013 --------------------------------------------------------------------------------------------------------------------------------------I. INTRODUCTION Electrical resistivity survey is based on the principle that the distribution of electrical potential in the ground in the vicinity of an electrode array depends on the electrical resistivity distribution of the surrounding soil and rocks. A direct current was injected into the ground through two current electrode and the variation of the current within the subsurface can be determine through the potential difference between the two other electrode Mapping a transition zone between the basement complex rock and sedimentary rock can be difficult especially if there is absence of outcrops or any rock section exposure (Bayewu, 2011). However, in Kakara village the presence of quarry sites and erosion help in exposing deeper rock lithology, it gives the idea about the nature of the transition zone,and how to position the sounding profile on the study area in other to get the best subsurface picture of the transition boundary. This study is very importance in any nation economy, since the geological boundary can serve as a trap and for accumulation and concentration of fluids such as petroleum, natural gas and water. It is also very important in civil engineering as physical and mechanical properties of natural rocks affect the stability of human engineered structure such as dams, buildings and road construction. However detailed study of geological structure gives clue on the geological history of an area. II. GEOLOGY OF THE STUDY AREA The study area lies within a transition zone between sedimentary rock and basement complex rock in the eastern part of Kano. The sedimentary part of the study area is located within the Chad formation in Chad basin, the Lithostatigraphy of this formation is an Argillatious sequence in which impersistance arenecous horizon occur, the clay represent the deposition under less turbulent condition away from the shore of the lake, the sandy sediment are thought to have been laid down as a lake margin deposits or as alluvial fans and deltas (Barber, 1965) www.theijes.com The IJES Page 36
- 2. Application Of Electrical Resistivity Method… The basement complex is composing mainly of older Granite and Granodiorite. Biotite granite is an acid igneous rock with Biotite mineral while Granodiorite has a composition which is intermediate between a diorite and Granite. Joint and fractures in the basement complex rocks are better developed in granites and quartzite and less in gneiss and Migmatites, joints rarely extends to a depth greater than 90 meters (Ahmed, 1987) There is vivid presence of both the basement rock and the sedimentary Chad formation on the surface since part of the study area has been excavated by seasonal rivers and some quarry activities around the study area, there by exposing the Lithological section of both the basement complex and sedimentary rocks. III. SITE AREA DESCRIPTION The study area , Kakara village in Gezawa Local Government Area of Kano State lies on approximately on latitude 120 02’N and latitude 12°12̍ N; and longitude 80 65̍ E and 8° 73̍ along Gumel – Kano Federal road. The terrain is relatively flat and the area can be accessed by some other motorable roads which are not tarred. IV. METHODOLOGY Measurements were taken along two profiles that are parallel to each other and 100m apart. Station interval of 100m was used to establish various sounding points. Measurements were taken at each vertical electrical sounding point ( VES point) by expanding the current electrodes symmetrically about the center of the spread. The maximum depth penetration (also known as depth of penetration) of the AMNB method is 1/3 to ¼ of the maximum distance of AB (Frohlich et al., 1996). That is, the maximum measurement for AB = 70m or 100m in few cases the maximum depth probed is about 18m to 23m. This depth is considered enough to delineate the interface between the two rock types of interest. Measurements were taken starting from AB/2 = 1.5m, 2.0m, 3.0m, 4.5m, 7.0m, 10.0m, 15.0m, 20.0m, 30.0m, 45.0m, 60.0m, 70.0m, 80.0m to 100.0m. At a distance when the potential difference between the potential electrodes becomes too small for the potential to be measured accurately, the potential electrodes (MN) spacing was also increased from 0.5m to 1.0m to obtain a measurable potential. V. INTERPRETATION The Geoelectric sections in fig 2 shows electrical resistivity model which best fits resistivity response along the two profiles. The results of the resistivity sounding were correlated with the lithological longs of nearby boreholes, expose cross section and hand dug wells around the area. The results obtained from the two profiles are interpreted using computer software IXD to plot the graph. From this graph the Geoelectric section was created which shows clearly the transition zone between the basement complex and the sedimentary complex at various depths across the two profiles. An extremely higher resistivity of 45,217Ὼm to 83,003Ὼm corresponds to top soil which is in most cases weathered laterite and lower resistivity of 44 Ὼm - 90 Ὼm, 0.5 Ὼm -3.84 Ὼm and 366 Ὼm - 759 Ὼm which correspond to sand, clay and dry sand respectively. All these types of formations are part of lithological sequences of Chad formations. However moderate resistivity values of 70 Ὼm - 500 Ὼm correspond to fractured part of the basement complex while the fesh basement complex with higher resistivity values of 500 Ὼm – 14,266 Ὼm The wide range of the resistivity value is as a result of varying resistivity characteristics thus showing different resistivity values when measured. The variance normally is as result of water saturation and porosity (matsui, 1993) under any set of moisture condition gravel always have higher resistivity than sand similarly sand has a higher resistivity than silt and silt has higher resistivity than clay(Baines et al. 2002) VI. CONCLUSION Structurally according to the result from the field, the transition zone is nonconformity. That is the younger sedimentary rock unit separated from the basement rock which suggests there was a long term of weathering and erosion which exposes the basement before it was finally buried by the sedimentary rock. The thickness of the sedimentary beds is increasing from VES A1 TO A2 and also VES B1 to B10. The declination of the basement is more pronounce in profile A than profile B. www.theijes.com The IJES Page 37
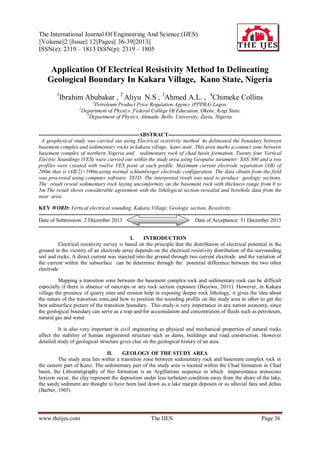
- 3. Application Of Electrical Resistivity Method… ACKNOWLEDGENT The author wish to acknowledge the Physics department, Ahmadu Bello University Zaria and Tahir water cooperation Kano State for providing equipments for this research. REFERENCE [1] [2] [3] [4] [5] [6] [7] [8] [9] Ahmed, K. (1998). Water quality for Irrigation in Hadejia River Catchment, Arts and Social Science Reasearch, Vol. 1 pp119-129 Alan,E., Mussett, M. and Aftab, K.(2000). Looking into the earth. Cambridge University Press, United Kingdom.Pp 456-476. Ariyo, O. and Gabriel, O. (2009). Role of electrical resistivity method for groundwater exploration in hard rock areas: a case study from Fidiwo/Ajebo area of south western Nigeria. Pacific Journal of Science and Technology, 10(1) : 483-486. Baker, R.D. (1989). Depth of investigation of a generalized collinear 4- Electrode Array. Geophysics 54:1031-1037. Bayewu, O. O. (2011). Application of Electrical Resistivity Imaging in delineating a non comformity around Ijesha Ijebu Sourthwestern Nigeria. Jornal of Petroleum and Gas Exploration Reasearch, Vol 2 PP010-016 Frohlich, R.K., Fisher, J.J. and Summerly, E.(1996). Electric- hydraulic conductivity correlation in fractured crystalline bedrock: central landfill, Rhode Island, USA. Journal of Applied Geophysics, 35: 249-259. Jones, R. C. Sarah, B. (1998). The Combined EMT/VES Geophysical Method for sitting Boreholes 54-63 Kelly, W.E. (1993). Applied Geophysics in hydrogeological and engineering practice. Elsevier, Amsterdam. pp 292 -293. Kano State Agricultural and Rural Development Authority (KNARDA). (1989). Rural water supply project, Vol. II, Summary of Hydrogeological Data. Final Report, WARDROP Engineering Inc. 24 p. plus Appendices . Fig:1 Shows the study area showing the two profiles Figure 2 A typical resistivity curve and interpreted model for VES station www.theijes.com The IJES Page 38
- 4. Application Of Electrical Resistivity Method… Sedimentary rock Basement complex Figure: 3 Showing Profile A 0 15 30 SEDIMENTARY ROCK BASEMENT COMPLEX Figure: 4 showing profile B PROFILE A Table:1 the interpred model and lithology(profile A) STATION LAYER SEQUENCE 1 2 1 2 3 A1 A2 RESISTIVITY (Ωm) 4692.9 767.1 44.16 210.9 502.3 THICKNESS (m) 0.857 DEPTH (m) 0.857 0.225 0.788 0.225 1.01 LITHOLOGY TOP SOIL FRACTURED BASEMENT SAND FRACTURED BASEMENT FRESH BASEMENT Table2 interpreted model and lithology (Profile B) STATION B1 B2 SEQUENCE 1 2 1 2 www.theijes.com RESISTIVITY (Ωm) 435.02 555.16 79.613 1458.4 PROFILE B THICKNESS (m) 8.4387 DEPTH (m) 8.4387 0.21545 0.21545 The IJES LITHOLOGY FRACTURED BASEMENT FRESH BASEMENT DRY SAND FRESH BASEMENT Page 39