More Related Content
Similar to Glucose metabolism student handout
Similar to Glucose metabolism student handout (20)
Glucose metabolism student handout
- 1. Student Protocol
Glucose Metabolism
Page 1 of 11 ©2010 ADInstruments
Introduction
In the laboratory you will examine the handling of a glucose drink or starch meal by
monitoring glucose levels in the blood and urine. You will study the rate of glucose
absorption and will monitor this by measuring plasma glucose using a glucometer. You
will then watch video interviews of Mrs C and Mr R, who have a chronic disease,
and analyze their laboratory test results. Finally, interviews with their consultant
physicians will give you further information on the disease process.
Gut Absorption: Background
Why understanding carbohydrate digestion, absorption and
metabolism is important clinically
Malnutrition is a common problem that is encountered frequently, both among patients
and also friends. Whereas once malnutrition and starvation were associated in our
minds, increasingly we think of obesity and diabetes in association with malnutrition. To
understand these problems and their management, it is essential to understand the
fundamental physiology of digestion, absorption and metabolism of carbohydrates and
how this is controlled.
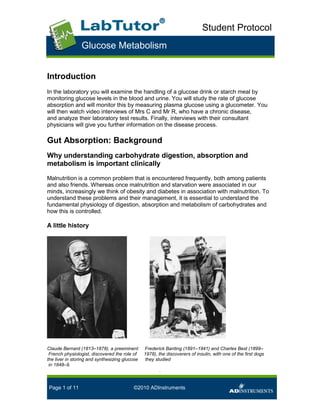
A little history
Claude Bernard (1813–1878), a preeminent Frederick Banting (1891–1941) and Charles Best (1899–
French physiologist, discovered the role of 1978), the discoverers of insulin, with one of the first dogs
the liver in storing and synthesizing glucose they studied
in 1848–9.
.
- 2. Student Protocol
Glucose Metabolism
Page 2 of 11 ©2010 ADInstruments
Digestion
Ingested nutrients, ions and water are absorbed from the gastrointestinal (GI) tract.
Complex carbohydrates, proteins and fats must be digested into substances which can
be absorbed and assimilated by the body. The digestive process begins in the mouth
where nutrients are mixed with saliva, which contains the enzyme amylase, which
begins carbohydrate digestion. The stomach secretes hydrochloric acid (HCl) that
denatures protein and is also bactericidal, protecting the intestine from any potentially
infectious agents. The stomach also secretes pepsin that initiates protein digestion.
The bulk of digestion occurs in the small intestine, which is divided into three areas: the
duodenum, jejunum and ileum. The enzymes amylase and lipase are secreted from the
pancreas into the duodenum, and bile is released from the gall bladder, which assists
in lipid digestion. The final stages of digestion occur at the intestinal epithelial cell
surface where enzymes on the microvilli complete the digestion of carbohydrates and
proteins. The jejunum is the major site of absorption of digested nutrients, ions and
water.
- 3. Student Protocol
Glucose Metabolism
Page 3 of 11 ©2010 ADInstruments
Figure 1. The major divisions of the gastrointestinal tract
What determines the rate of absorption of nutrients?
The rate of nutrient absorption is limited by the rate at which the ingested food is
delivered to the duodenum from the stomach, and the rate at which it is absorbed in the
jejunum. The rate of gastric emptying is determined by the consistency of the ingested
food and by the nature of that food. Liquid leaves the stomach much faster than solid
material does, while the presence of fat delays gastric emptying.
Figure 2. Effects of fat on the rate of gastric emptying.
Figure 3. Rate of gastric emptying after a typical meal.
Between contractions, the pyloric sphincter is relaxed. As a peristaltic wave spreads
over the surface of the stomach, the stomach contents (chyme) are propelled towards
the pyloric sphincter. However, the sphincter contracts before the bulk of this chyme can
pass through it. Thus, with each contraction, only a very small percentage of the total
- 4. Student Protocol
Glucose Metabolism
Page 4 of 11 ©2010 ADInstruments
gastric contents pass into the duodenum. The rest, hitting a closed sphincter, is
propelled back into the body of the stomach (a process referred to as retropulsion),
causing mixing and breakdown of the material. The more the stomach contents is liquid
in consistency, the greater the amount that passes into the duodenum with each
contraction.
As chyme enters the duodenum, its volume and composition, including acidity, are
monitored. Enteric nervous reflexes are initiated and hormones (cholecystokinin and
secretin) are released, that adjust the rate of gastric emptying to the duodenum’s ability
to handle the load being delivered to it. These reflexes may be either intrinsic or
extrinsic: intrinsic reflexes will have a direct effect on the gut, while extrinsic reflexes
require mediation by the central nervous system for an effect on the gut.
The rate of digestion is determined by the amount of enzymes secreted by the pancreas
and the nature of the material to be digested. For example, complex carbohydrates such
as starch will take longer to digest than disaccharides. Monosaccharides like glucose
require no digestion and start to be absorbed immediately.
Figure 4. Chemical structure Figure 5. Basic chemical structure of starch and
of glucose C6H12O6. glycogen.
- 5. Student Protocol
Glucose Metabolism
Page 5 of 11 ©2010 ADInstruments
Effects of glucose in the intestinal lumen
The presence of glucose in the lumen stimulates the release of incretins, which are
gastrointestinal hormones that stimulate insulin release from pancreatic β-cells. Two
established incretins are glucose-dependent insulinotropic peptide (also known as
gastric inhibitory peptide) and GLP-1 (glucagon-like peptide-1). Thus, before glucose is
absorbed to any extent, circulating insulin levels are elevated. The enteric nervous
system also plays a role in regulating the release of hormones from the pancreas after a
meal. In addition, the parasympathetic system stimulates insulin release whereas the
sympathetic system stimulates glucagon release and inhibits insulin release.
Figure 6. Histology of the small intestine.
Carbohydrate Absorption
The wall of the small intestine is made up of finger like projections called villi that
increase the small intestinal surface area. These villi are covered with epithelial cells.
The luminal membrane of each epithelial cell is covered with microvilli. These are
responsible for the brush border appearance of the luminal surface of the small intestine.
The microvilli contain disaccharidases that convert disaccharides to monosaccharides
for absorption. Starch digestion generates maltose which is cleaved by a maltase,
producing two molecules of glucose.
- 6. Student Protocol
Glucose Metabolism
Page 6 of 11 ©2010 ADInstruments
Glucose is co-transported with sodium into the cells on the SGLUT1 transporter. Sodium
moves into the cell down its electrochemical potential gradient, providing the energy to
move glucose into the cell against its own chemical potential gradient. Once in the cell,
glucose exits to the interstitial fluid down its chemical potential gradient via one of the
family of glucose transporters (GLUT 1–5), namely GLUT 2. The sodium that entered
with the glucose is actively transported out of the cell into the interstitial fluid by the Na+
-
K+
-ATPase, thus maintaining the Na+
gradient.
Figure 7. Mechanism of glucose absorption from jejunum.
The fate of the absorbed glucose
Normally, glucose is not metabolized to any extent by the intestinal cells themselves.
Instead it is transferred to the interstitial fluid surrounding the small intestinal epithelial
cells. From there it diffuses into portal vein capillaries to be taken first to the liver before
entering the systemic circulation. Of the glucose load absorbed, about one third is taken
up by the liver, one third is taken up into skeletal muscle and fat cells by GLUT 4, which
is an insulin-dependent transporter, and one third enters tissues such as the brain which
do not require insulin for glucose uptake (Figure 8).
- 7. Student Protocol
Glucose Metabolism
Page 7 of 11 ©2010 ADInstruments
Figure 8. Distribution of an oral glucose load over a 4 hour period.
Regulation of Carbohydrate Metabolism
Two hormones that are released from the Islets of Langerhans in the pancreas are
involved in the reciprocal regulation of carbohydrate metabolism:
1. Insulin, released from the β-cells, causes uptake of glucose, amino acids and
lipids into cells, and promotes the conversion of these building blocks into larger
molecules for storage (glycogen, proteins and fats).
2. Glucagon, released from α-cells, promotes release into the blood stream of glucose,
amino acids and lipids, and the break down of stored carbohydrates, protein and fats
Figure 9. Histological section of a pancreas showing an Islet of Langerhans (1) and
exocrine acinar cells (2). 200x magnification with an H & E stain.
- 8. Student Protocol
Glucose Metabolism
Page 8 of 11 ©2010 ADInstruments
Hormonal control of blood glucose levels
After a meal, the rise in plasma glucose further stimulates pancreatic insulin release,
while the release of hormones that tend to elevate plasma glucose (including glucagon,
epinephrine, growth hormone and cortisol) is inhibited, through a variety of complex
pathways that remain to be fully understood. The uptake of glucose by the liver in the
presence of insulin results in inhibition of glycogenolysis and gluconeogenesis, and the
stimulation of glycogen synthesis. Thus a large fraction of the dietary intake of glucose is
stored for subsequent use when the plasma glucose level falls again.
Figure 10. Insulin, acting at insulin receptors, activates GLUT 4 transporters on skeletal
muscle and fat cells, and promotes anabolic pathways resulting in storage of fuel for
subsequent use.
Renal Handling of Glucose
Normally, all glucose filtered at the glomerulus is reabsorbed by the end of the proximal
tubule. As in the jejunal epithelial cells, this involves uptake into cells from the lumen by
SGLUT 1 and passage from the cells into the blood by GLUT 2. The reabsorptive
capacity of the cells is not saturated at normal blood glucose concentrations. Indeed, at
normal glomerular filtration rates, the blood glucose concentration must almost double
before the uptake becomes saturated and glucose starts to appear in the urine. In a
- 9. Student Protocol
Glucose Metabolism
Page 9 of 11 ©2010 ADInstruments
healthy person, insulin is released following a meal and any absorbed glucose is rapidly
taken up by cells; therefore it is rare for any glucose to appear in the urine.
Diabetes Mellitus
In Type 1 diabetes mellitus, there is a decrease in insulin production by the pancreatic
islet cells as a result of an autoimmune response that destroys the cells. In Type 2
diabetes, there is a decrease in the effectiveness of insulin receptors in tissues that may
eventually be associated with decreased insulin production. In both forms of diabetes,
cells are bathed in extracellular fluid with excessive levels of glucose but the reduced
entry of glucose into cells leads to very low glucose levels intracellularly, which disrupts
normal cellular metabolism. Diabetes can be described as "a state of starvation in a sea
of plenty".
Type 1 diabetes can develop very rapidly and often begins in childhood. As
insulin levels fall, liver gluconeogenesis predominates, and blood sugar rises.
Symptoms include polyuria (from glucose in the urine, excreted with water),
dehydration and weight loss (from loss of water and disturbed metabolism),
hunger and tiredness. If the diabetes is left untreated, the compensatory increase
in fatty acid metabolism (which occurs when cell glucose is low) leads to
ketoacidosis, coma and death.
Type 2 diabetes usually develops more slowly and is often diagnosed from
blood glucose elevation in a routine medical check up. Ketoacidosis is rare.
Diagnosis
The diagnosis of diabetes is made from blood glucose levels. Fasting levels above 7
mmol/L (126 mg/dL) is indicative of the disease. It can be confirmed by a glucose
tolerance test where a standard oral dose of 75 g glucose is given and blood levels
followed over the next two to three hours. Commonly samples are now taken just before
the dose and two hours after it. A blood glucose 11.1 mmol/L (200 mg/dL) or higher
confirms the diagnosis.
Measurements of glycosylated (glycated) hemoglobin (HbA1c) are used to follow how
well blood sugar is controlled in diabetics. Normal human red blood cells have a life span
of 120 days. During this time, some glucose molecules react non-reversibly with
hemoglobin forming glycated hemoglobin. The higher the glucose concentration, the
higher the levels of HbA1c formed during the life of the cell. HbA1c was expressed as a
% but it is now recommended that it be expressed as mmol/mol of Hb. Normal values
range between 4.0–6.0 % or 20–42 mmol/mol.
Complications of Diabetes
Both Type 1 and Type 2 diabetes are chronic diseases that can result in a variety of
serious complications.
- 10. Student Protocol
Glucose Metabolism
Page 10 of 11 ©2010 ADInstruments
Acute complications
These include hypoglycemia and hyperglycemia, as well as ketoacidosis (Type 1) and
non-ketotic hyperosmolar coma (most often seen in Type 2).
Acute hypoglycemia arises when too much insulin is taken. Symptoms result
from increased secretion of hormones that can raise blood glucose (epinephrine,
glucagon) – eg. anxiety, tachycardia, sweating, pallor – and from the decreased
energy available in the brain – eg., confusion, personality changes, slurred
speech, and loss of coordination. If untreated, coma and death can follow.
Acute hyperglycemia occurs when there is insufficient insulin for normal glucose
uptake by cells. Symptoms include polydipsia (excessive thirst) and polyuria
(excessive urination). Vision may blur because raised glucose concentration in
the aqueous humor results in changes in lens volume.
Chronic complications
In both Type 1 and Type 2 diabetes, complications include cardiovascular disease, renal
failure, eye damage (cataracts, retinopathy) and neuropathy. Peripheral neuropathy can
include disturbances of autonomic function as well as sensory and motor effects.
Damage to tissues and organs is thought to reflect injury to small blood vessels with
capillary basement membrane thickening and endothelial hyperplasia.
Terms to be familiar with:
Glycolysis: the first stage of glucose breakdown for energy metabolism.
Glycogenolysis: the breakdown of glycogen into glucose molecules.
Gluconeogenesis: the production of glucose from substrates, such as glycerol
(from fat) and protein, usually occurring in the liver.
Proteolysis: the breakdown of proteins into smaller peptides.
Ketogenesis: the breakdown of fatty acids, with production of ketone bodies.
Lipolysis: the breakdown of triglycerides into fatty acids and a glycerol molecule.
- 11. Student Protocol
Glucose Metabolism
Page 11 of 11 ©2010 ADInstruments
What you will do in the laboratory
In this laboratory you will perform five protocols and examine two case studies.
[You will study the rate of glucose absorption by making serial measurements of plasma
glucose using a glucose meter (glucometer). This is a device that reads the glucose
concentration in a drop of blood, which is obtained by a finger prick and then placed on a
chemically-coated test strip. The test strip is placed in a glucometer which reads the
sample and digitally displays the blood glucose level in mmol/L (SI units) or mg/dL (US).]
NOTE: It is important not to limit the rate at which the fluid or food that is ingested
reaches the intestine. Therefore, to avoid delays in gastric emptying, it is essential
that all volunteers refrain from eating for at least two hours (preferably four)
before coming to the class.
Volunteers will follow one of five protocols:
Protocol 1: Control - no fluid or food intake.
Protocol 2: Effects of drinking a glucose solution:
Drink volume of glucose solution (containing 100 g glucose/L dist water;
0.56 M glucose solution) determined by body weight.
Protocol 3: Effects of eating a complex carbohydrate:
Eat quantity of white bread (containing around 45 g starch/100 g bread)
determined by body weight.
Protocol 4: Effects of eating a complex carbohydrate with fat:
Eat quantity of potato chips (containing around 45 g starch + 31 g fat/100
g bread) determined by body weight.
Protocol 5: Effects of a glucose solution in the mouth:
Take mouthfuls of the appropriate volume of glucose solution, but instead
of swallowing it, roll it around the mouth, then spit it out.
Case studies: You will ‘meet’ two people; Mrs C and Mr R, both patients with a disease
affecting their glucose metabolism, and examine the results of investigations into their
problems.