1. Informatica 32 (2008) 111–122 111
Urban-Rural Life Setting as the Explanatory Factor of Differences in
Fertility Behaviour in Slovenia
Majda Černič Istenič
Sociomedical Institute at Scientific Research Centre of Slovenian Academy of Sciences and Arts,
Novi trg 2, 1000 Ljubljana, Slovenia
University of Ljubljana, Biotechnical Faculty, Agronomy Department,
Jamnikarjeva 101, 1000 Ljubljana, Slovenia,
E-mail: majdaci@zrc-sazu.si
Andrej Kveder
Population Activities Unit,
UNECE, Palais des Nations,
CH-1211 Geneva 10,
E-mail: andrej.kveder@unece.org
Keywords: survey data, statistical data, fertility behaviour, typology of urban-rural settings, Slovenia
Received: March 31, 2008
Contemporary research of fertility behaviour that considers simultaneous longitudinal and prospective
inclusion of individual and contextual levels of observation increases its explanatory power of
explanation. The only research data of the kind in Slovenian is Fertility behaviour of Slovenians which
was a part of international project the Family and Fertility Survey (FFS), carried out in 1995. On the
basis of this survey data combined with statistical census data in the form of socio-economic typology of
Slovenian countryside the article aims to explain the tendency and reasons of still persistent difference
in urban-rural fertility. The study of relationship between fertility decisions of different generations and
developmental characteristics of rural and urban areas in Slovenia reveals that this relationship is a
complex and dynamic one. Obtained research results call for diversified actions of population policies
in Slovenia. In to its field of actions not merely family and social policy should be integrated, but also
space and regional measures that will consider different every day’s life conditions and needs of people,
living in particular space setting, and in this way assist them to fulfil their desired number of children.
Povzetek: Narejena je analiza slovenske rodnosti na podeželju in v mestih.
1 Introduction
According to Notestein’s theory of demographic 1986). In spite of relatively great variety in the beginning
transition (1953) a high-level fertility regime of pre- of demographic transition and the level of urbanisation
modern societies was replaced with a low-level one causal relations between these two phenomena certainly
owing to the process of modernisation and its existed. Research on social-group forerunners of fertility
accompanying processes: industrialisation and control in Europe (Livi-Bacci, 1986) proved that urban-
urbanisation. As supposed, the growth of big city rural difference in fertility existed even prior to the onset
agglomerations and mobile urban population disrupted of general decline in fertility. Some groups within the
the strength of traditional norms and commitments to a city population (mainly elites: aristocracies and
traditional way of life and stimulated individualism and bourgeoisie) were practising effective family limitation
affirmation of personal aspirations. However, as later which influenced the overall urban fertility level. Other
research revealed (e.g. “The European Fertility Project” reasons for variation in levels of fertility between urban
(Coale, Watkins, 1986)), the casual relationship between and rural populations before the demographic transition
urbanisation and the beginning of demographic transition are also low levels of nuptiality in the cities due to high
was not always entirely direct and unproblematic. For concentration of servants (it was not easy for them to get
instance, the decline in fertility in France “began in the married) (Sharlin, 1986). Urban-rural difference in
late eighteenth century, long before the appearance of the natural fertility was also affected with factors such as
modern city, while the decline in fertility in England only infant mortality (higher in the cities) and breast-feeding
got underway decades after cities like Birmingham and (more widespread in the country) (van de Walle, 1986).
Manchester become grimy industrial centres” (Sharlin, After the completion of the transition from high fertility
2. 112 Informatica 32 (2008) 111–122 M. Černič Istenič et al.
to the low one (enforcement of modern demographic declined for about 40 percentage points and for about 20
behaviour), urban marital fertility remains lower than percentage points in the countryside (Šircelj, 1991).
rural marital fertility. The differences declined in size, Slovenian society was still weakly structured in the
but nonetheless continued to exist in most of the middle of the nineteenth century. The main occupation
countries that experienced demographic transition was farming. Specifically, in 1868 the share of farm
(Andorka, 1978). population was 81,4 percent. A the break of the 20th
As some recent research (Černič Istenič, Kveder, century it decreased to 73,2 percent (Klemenčič 2002).
2000, Černič Istenič, Kveder, Obersnel Kveder, 2000) The difference between areas with the highest and the
indicates, this ‘state of affairs’ also holds true for lowest share of farm population was 13 percentage
Slovenia: today all social strata that live in the cities still points. In 1931 this difference reached 50 percentage
have fewer children than those who live in the points. The share of farm population decreased especially
countryside despite the fact that the difference in the in the neighbourhoods of Ljubljana. At that time no
level of fertility among various social strata is indeed association between the share of farm population and the
diminishing (Javornik, 1999) due to the predominance of level of fertility was observed. It appeared only after the
two children per family norm (Malačič, 1990, Černič Second World War. “Up to that time the level of fertility
Istenič 1994, Obersnel Kveder et al., 2001). To explicate was much more influenced by the type of settlement
this issue more precisely in the present article we explore where a woman lived than by the share of farm
the relationship between fertility decisions of different population” (Šircelj, 1991: 244). Since the Second World
generations and developmental characteristics of rural War farm women have the highest fertility and today
and urban areas in Slovenia. On the basis of individual they are the only socio-professional group who assures
survey data combined with statistical census data in the itself biological reproduction (Šircelj, Ilič, Kuhar,
form of socio-economic typology of Slovenian Zupančič, 1990, Šircelj 2007). However, fertility of farm
countryside we intend to discover the tendency of this women has actually no effect on the national fertility
still persistent difference in urban-rural fertility and its level due to its very low share compared to the whole
reasons. In this vein, the main traits of Slovenian 1
population . In the period 1931-2002 the share of farm
urbanisation and deagrarisation process over the last 150 population declined from 60 to 6,5 percent, the most
years are firstly briefly sketched. Secondly, the main rapidly in the period 1948-1981; from 48,9 to 9,4 percent
analytical frame of our analysis is outlined. It follows the (Klemenčič 2002, Statistical Yearbook 2003). At the
pertinent theoretical observations which indicate that due same time, the age structure of agrarian countryside
to urbanization social, economic and political deteriorated significantly. Young generation was/is
differentiation firstly increased elsewhere, but later on, a immigrating into the cities whereas older generations
kind of homogenisation in social behaviour of the remain in the countryside. In some parts of Slovenia
population took place due to further impacts of urban life (hills, highlands, the Karst and particularly borderlands)
patterns on the countryside. In the third part the main the age structure of rural areas is so unfavourable that it
explanations of the selected data and applied methods are causes demographic extinction and stagnation. Namely,
presented. In the forth section, the results are presented only 2 percent of the population lives on the above
according to the outlined hypothesis and in the final part mentioned areas which represent 20 percent of the
they are discussed and conclusions are outlined. surface (Pečan, Ravbar, 1999). On the other hand,
countryside has also experienced social strata
transformation. Due to abandonment of farming and
1.1 Urbanisation and deagrarisation of forestry, moving of provincials into other occupations
Slovenia and owing to permanent or accessional immigration of a
part of the urban population into the countryside, its
The beginning of urbanisation in Slovenia was relatively
social structure becomes more and more heterogeneous
late. A growth of cities started only after 1848. In that
(Barbič, 1991; Kovačič, 1995). In relation to this process
time Ljubljana, the capital and the biggest city of today’s
the way of life of the countryside population is changing.
Slovenia, had just 17000 residents. Urban-rural
Achievements of urban society are advancing rapidly
difference in fertility level existed before, during and
into the rural areas; activities and services once typical
after the demographic transition in Slovenia. The earliest
for urban areas become more and more widespread in
available data for the level of fertility in Slovenia that
rural areas. Thus, rural population is getting similar to the
make the comparison between urban and rural fertility
urban one (Pečan, Ravbar, 1999). It can be expected that
possible pertain to generations born during 1873-1877
all these processes are influencing social behaviour of the
and during 1898-1902. This comparison show that urban
countryside people and consequently their fertility
women had from 34 to 47 percentage points lower
behaviour as well.
fertility than countryside women did (Šircelj, 1991). The
beginning of demographic transition in Slovenia started
only in the first quarter of the twenty-century. However,
fertility in the cities already began to decline towards the 1 However, the correlation between decrease in total
end of the nineteenth-century. Firstly it started to decline fertility rate in Slovenia and the decline in the share of
in larger cities and then spread onto the smaller ones. At farm population was high after the Second World War
the break of the twentieth century fertility in cities period.
3. URBAN-RURAL LIFE SETTING AS... Informatica 32 (2008) 111–122 113
1.2 Theoretical background harmoniously live with others, while life in urban areas
(in Gesellschaft), constituted by commodity exchange
In now already classical textbook “Determinants of
and rested on “union of rationale wills”, led to
fertility in advanced societies” by Andorka (1978) a
undermining genuine attachment between people and
relationship between fertility behaviour and place of
community (see Bonner, 1999 for more extensive
residence was characterised as a direct linkage. There is a
overview of the urban-rural debate).
fairly consistent correlation between urban or rural trait
Extensive empirical research of the rural society
of the place of residence and fertility. The place of
evolved since the 1950s, showed that there is no clear
residence has a property of natural or man-made
rural-urban distinction. Concepts like community and
environment. In this sense highly populated, densely
locality did not wholly prove their justification.
build-up areas heavily loaded with traffic are defined as
Fieldwork investigations (Williams, 1963, Bell and
urban areas. Correspondingly, there is little space left for
Newby, 1971, Pahl, 1965, 1966, Newby, 1978, 1980)
parks, private gardens and other places where children
revealed that there are no close, isolated, harmonious,
can safely spend time outside their homes. On the other
functioning in traditional manners and closely kinship-
hand, the trait of rural area is determined by living
bounded communities. They also showed that low
predominantly in a one-family house with garden or in a
population density or certain fixed settlement patterns
relatively small apartment house. Life there is quieter and
were insufficient basis to distinguish between urban and
safer and children have plentiful space for playing
rural places. Marsden (1998, 1999), focusing on
outside their homes. According to Andorka, this
restructuring of agriculture, drew attention to the varying
ecological characteristic of urban-rural differential is also
degrees of influence and interaction of agricultural,
connected with different monetary costs and efforts
residential and commercial interests in shaping
necessary for raising and educating children that are
differentiating rural areas that could be analyzed by
much greater in urban areas than in the rural ones.
modelling of typologies (see Mahon, 2001 for more
Besides, he presupposed different preferences and
extensive review of recent comprehension of rurality).
different consumption alternatives in these two types of
According to Bourdieu (2003) each classification of
residence.
social world should take into consideration the principle
To understand urban-rural differences in fertility
of differentiation in order to theoretically construct
behaviour of advanced societies it is also necessary to
empirical reality. Basically, this principle pertains to the
take into consideration the social characteristics of these
distribution of the forms of power or the kinds of capital
types of environment. Mackensen (1982) believes that
that vary according to the specific place and moment.
one general theory of fertility that could adequately
This means that the set of agents or institutions which
explain fertility behaviour in all societies and at all
possess sufficient quantum of a specific capital
periods of time is neither possible nor justifiable. He is
(especially economic and cultural), that enables them to
convinced that for this reason, every explanation,
possess a dominant social position, conserve or transform
observation and research of fertility behaviour like any
the “exchange rate” between different kinds of capital
other social behaviour should proceed from the concept
through more or less administrative measures. Of course,
of specific structural and cultural characteristics of each
this holds true for relationships between city and country
society, which is the product of certain historical
as well. Characteristics of today’s urban and rural
processes. Hoffnan-Nowotny (1987) who asserts that
societies are undoubtedly strongly related to their
fertility behaviour of an individual is connected with
specific position and mutual relationship in the last
structural and cultural characteristics of his/her micro,
century and a half, which has often taken the framework
mezzo and macro social environment shares similar
of city domination over the countryside (Hays 1993). An
view. Importance of geographical variations in place or
urbanized society evolved out of the former rural society
context in understanding fertility decision-making is
by exploiting the material and human resources of the
further stressed by Boyle (2003).
countryside intensively, which led to considerable
Discussion concerning typical characteristics of
economic, social and political inequalities between these
urban and rural places is already a long present one.
two settings. Along with this, cities changed or gave up
Classics of sociological thought like K. Marx, F.
thoroughly the culture and the way of life, which long
Tonnies, G. Simmel, (European representatives) and L.
prevailed in the countryside. However in this process all
Wirth, R. Redfield (attached or influenced by the
parts of countryside were not equally affected.
Chicago School) argued that strong distinctions exist
between urban and rural societies. E.g. accordingly to
Hypothesis 1: on the basis of the above statements, we
Marx’s theorization, an individual living in urban place
expected in our analysis that fertility behaviour of
has universal chances to develop all his/her abilities
individuals is closely linked with economic and social
while in the countryside he/she is bounded by constant
characteristics of their life settings observed through the
reiteration of firmly established patterns of thinking and
selected typology of rural areas.
acting derived from direct dependence of men to nature.
Quite on the contrary, Tonnies was convinced that life in
Over the last decades, the social structure and culture
the countryside (in Gemeinshaft) bounded together by a
of rural areas in Europe and other industrially developed
unity of wills and solidarity with its tradition and social
countries has changed significantly. Due to massive
order, gave an individual a supreme opportunity to
abandonment of agriculture by a great part of rural
4. 114 Informatica 32 (2008) 111–122 M. Černič Istenič et al.
population and their engagement in other occupations, individualistic “lifestyle, where it is understood that sex
rural areas became multifunctional and multistructural and marriage/union are no longer closely related, and that
(Djurfeldt, 1999). Migrations from urban to rural areas contraception is only interrupted to have a self-fulfilling
contributed to this heterogeneity to some extent as well. conception” (Van de Kaa, 1999:31). This new pattern of
With rapid development of new technologies behaviour is seemingly reflected in the changes of the
(information and computer sciences) and improved life course of young generations – earlier entry into first
traffic connections among urban and rural areas, the sexual intercourse but later achievement of economic and
entire societies became increasingly urbanised, "infected" housing autonomy and formation of own families
with urban values and the urban way of life. Owing to (Iedema et al., 1997; Cordon, 1997; Nave-Herz, 1997).
these changes, it could be supposed that urban-rural
difference in fertility behaviour is diminishing or even Hypothesis 3: in this vein in our analysis we supposed
vanishing. However, changes in social behaviour do not considerable differences in the life course, especially
occur quickly, or at the run of one single generation. during the transition into adulthood between younger and
According to Inglehart's (1989) theory of value changes older generations of the respondents from different space
they occur with the exchange of generations. This theory settings.
is based on two hypotheses:
1. deficiency effect: An individual most strongly 2 Methods
appreciates the things that are relatively rare in
his/her socio-economic setting.
2. socialisation effect: Value priorities of an individual 2.1 Data
are not direct reflections of his/hers present socio- The analysis was based on the Family and Fertility
economic setting but are the reflections of Survey data collected in Slovenia between December
conditions in which he/she grew up. 1994 and December 1995. A representative area sample
Therefore it could be supposed that due to increased of the inhabitants of the Republic of Slovenia in their
impact of globalisation (preferring urban life style) every reproductive age period (i.e. aged 15 to 45) of both
younger rural generation will be more similar in its social genders was drawn. Face to face interviewing was used
and consequently fertility behaviour to urban population as the data collection method. Realised sample consisted
than previous rural generations were. of n=4.559 respondents. The data were weighted
according to survey design and population adjustment
Hypothesis 2: in this respect we expected in our analysis based on a specified set of socio-demographic variables:
smaller differences in fertility behaviour in younger gender, age and size of the settlement (see
generation of the respondents from different space Obersnel Kveder et al., 2001 for more detailed
settings than in the older ones. description of the data set). Considering our objective to
explore differences between generations, two birth
Cohorts who voluntarily limited marital fertility, cohorts were emphasized in the present analysis:
enforced demographic transition, which took place • respondents aged 20-24 years of both genders -
during the second part of the 19th and the first part of the the “younger” generation at the entrance to their
20th century in industrialised world, from high to low reproductive period and also representing
fertility. Their belief in marriage and family was still contemporary fertility patterns,
very strong, although they practised contraception from • respondents aged 40-45 years of both genders -
preventive reasons according to Van de Kaa (1999). the “older” generation at the end of their
They wanted to give their children a good start in life and reproductive period and also presenting the
stemmed towards limiting the number of children to be immediate past fertility patterns.
correspondent with that goal. They disciplined
themselves to remain married even when love was lost. The main interest of the present article was in the
However, these features of “modern demographic variables concerned with the timing of childbearing as
behaviour” did not last very long. Since 1965, new well as other events relating to the entry of an individual
demographic changes have been observed in many into adulthood such as sexual debut, partnership history,
European countries: decrease of marriages, increase of leaving parental home, education and employment spells.
cohabitations, postponement or abandonment of All these events were measured as retrospective event
parenthood, increase in divorces and single parent histories. For all strictly reproductive events (i.e.
households. These changes also denoted as the second childbearing, use of contraception), the age at the first
demographic transition (Van de Kaa, 1987) presumably sexual intercourse was taken as the threshold of
occur due to a shift of value orientation from a modern becoming at risk, while for all others (i.e. partnership,
trend to post-modern that signifies further enforcement of education, employment, and leaving parental home) the
the individual's free choice principle, which was threshold was the respondents’ birth. Right censoring
introduced during the time of Renaissance and was determined by the date of the interview. Besides, the
Enlightenment centuries ago. The motto of this trend is variables describing respondent’s preferences, values,
that individuals can and should make their own choices. attitudes and status characteristics were considered.
“Post-modern demographic behaviour” of contemporary Some of them: household structure, attitudes towards
reproductive cohorts presumably corresponds to the
5. URBAN-RURAL LIFE SETTING AS... Informatica 32 (2008) 111–122 115
abortion, gender roles and marriage were constructed scale regarding advantages of cohabitation over marriage
from the set of other variables from the survey data set. to achieve the following aims:
The variable ‘Household structure’ was derived from • general happiness,
the household grid. It has 13 distinct attributive values • economic security,
depicting various household types in which the • friendly relationship with others,
respondents can live: • personal freedom,
1 alone • stable relationship,
2 with a partner • having children,
3 with a partner and others (e.g. his/hers
• social acceptance.
parents and siblings, partner’s parents
and siblings, other relatives)* Following the aim of this article, fertility behaviour
4 with a partner and children
should be put in the perspective of the contextual micro,
5 with a partner, children and others*
mezzo and macro level variables. Microenvironment is
6 with children
defined as the immediate living surrounding of the
7 with children and others*
individual varying from their family, household to the
8 with parents and siblings neighbourhood. Mezzo environment is by definition
9 with parents, siblings and other relatives
broader than the micro and thus can encapsulate a variety
10 with one parent
of geographical units from the settlement to the
11 with non-relatives municipality and region. Macro socio-economic context
12 with other relatives
is usually associated with the national level indicators.
13 with other relatives and non-relatives
This article focuses on the use of one exemplary
indicator measured at mezzo level; the respondent’s
The variable ‘Abortion’ was derived by taking into
place of residence determined by the basis of Slovenian
account “approval” answers from the set of the following
Census in 1991. In its essence, the indicator reflects the
dichotomous statements: urban-rural dichotomy and defines 4 possible types of
• An abortion is approved/not approved when living surroundings: urban, suburban, typical rural and
mother’s life is in danger due to pregnancy. rural depopulation areas (Kovačič et al. 2000, Kovačič, et
• An abortion is approved/not approved when the al. 2002):
risk of the birth of an abnormal child is great. • Those places that have an urban management
• An abortion is approved/not approved when a character according to the space planning documents
woman is not married. have been classified as urban environments.
• An abortion is approved/not approved when a Additionally, the function of centrality of each
married couple does not want to have another geographical unit was considered as criteria of
child. demarcation between urban and rural areas.
• An abortion is approved/not approved when a Slovenian geographers classify settlements into
woman does not want to have a child at the time seven groups according to their centrality (Vrišer,
being. 1998). Those settlements with the centrality index
between 7 and 3 were also defined as urban
The variable ‘Gender roles’ was constructed by taking environments. The settlements with the lowest
into account answers “strongly agree” and “agree” from centrality index 3 were additionally bounded by the
the Likert 5- item scale of the following attitudes: minimal size of 3.500 inhabitants. The share of
• An employed mother can create as warm and population living in this type of settlements is
safe relationship with her children as a mother estimated at 39,20 percent.
who is not employed. • All local communities (slo. krajevne skupnosti) with
• Employment is the best way for a woman to the density of the population greater than 200/km2
achieve independence. were considered as suburban. In addition, the areas
• Being a housewife is as fulfilling for a woman with the density lower than 100/mk2, with the index
as being employed. of population growth in the period 1981/91 greater
• Both man and woman should equally contribute then 110, were also included in this type of
to their household’s budget. settlements. The share of population living in this
• Preschool child would most probably suffer if type of settlements is estimated at 14,80 percent.
his mother was employed. • All local communities with the long-term (1961/919
• It is acceptable for a woman to be employed, but and short-term (1981/91) population growth index
what most of women really want is home and below 97,5 were considered as depopulation areas.
children. In addition, local communities with the non-negative
short-term population growth and with the index of
The variable ‘Marriage vis-á-vis Cohabitation’ was population ageing above the absolute demographic
constructed by taking into account responses “very threshold (i.e. 72) were also considered as
favourable” and “favourable” from the Likert 5- item depopulating. The share of population living in this
type of settlements is estimated at 14,87 percent.
6. 116 Informatica 32 (2008) 111–122 M. Černič Istenič et al.
• All rural areas between suburban and depopulation Each respondent from the survey was ascribed a
were considered as typically rural. The share of settlement type according to his/her residence at the time
population living in this type of settlements is of the interview. The key for information matching was
estimated at 31,22 percent. the local community that could be matched to the survey
data as well as the settlement typology specification. The
Additional analysis which applied the above analysed sub-samples were as follows:
typology (Perpar, Kovačič, 2002) revealed that these
types of rural settlements significantly differ among each Table 1: The size of sub-samples (N).
other in terms of socio-economic development, Settlements type 20-24 40-45
infrastructure and natural resources. Taking into account Urban 192 302
Suburban 109 182
several indicators pertaining to statistical data from 1991, Typical rural 204 295
suburban areas are in the most favourable position and Depopulation rural 75 131
depopulation areas are in the least favourable one.
Considering the employment structure of population, the 2.2 Analysis
highest share of population in suburban and typically
rural areas works in secondary sector, whereas in Bivariate associations were analyzed using either the
depopulation areas population mostly works in the analysis of contingency tables either using comparisons
2 among means. Timings of observed events were
primary sector . Daily migrations additionally indicate
analyzed through event history models (Allison, 1995),
the level of engagement in gainful employment. Its share
which enable the estimation of the differences in the
is again the highest in suburban areas (770 per 1000
individuals’ life course. Since only the distribution of the
inhabitants) and the lowest in depopulation areas (540
probability of time (T) was taken into account, it was
per 1000 inhabitants). Further, significant differences
described through cumulative distribution function
among the areas are also observed concerning the
perspective (survivor function):
education. The highest level of education is reached in
suburban areas (43 percent of inhabitants finished at least
high school), whereas in typically rural and especially in S (t ) = Pr{T > t} = 1 − F (t ) (1)
depopulation areas this share is considerably smaller.
The same picture is indicated by the proportion of The result of the survivor function is a probability that an
students per 1000 inhabitants; it is again the most individual “survives” in the process beyond time t. It is
favourable in suburban areas (25 students per 1000 defined on the interval from 0 to 1. Life-table method
inhabitants), less favourable in typical rural areas (21 to was used for the estimation of the survivor function. The
25 students/1000 inhabitants) and the least favourable in estimate is calculated using the conditional probability of
depopulation areas (20 students/1000 inhabitants). failure (i.e. the probability for an event within a certain
Furthermore, indicators pertaining to economic situation interval, given that an individual made it to the start of
confirm already indicated differences. E.g. density of interval):
business entities that indicates economic development of j −1
the area is the most favourable again in suburban S (ti ) = ∏ (1 − q j ) (2)
settlements with more than 14 business entities per 1000 j =1
inhabitants, less favourable in typical rural areas (12 to where qj is the conditional estimation of failure and is
14 business entities per 1000 inhabitants) and the least calculated as the ratio of number failed over the effective
favourable in depopulation areas (less then 12 business sample size. Major events in a life history were depicted
entities per 1000 inhabitants). Considering the by the means of calculating the quartiles of the survivor
infrastructure, the analysis (Perpar, Kovačič, 2002) function.
demonstrated that all areas are relatively well equipped
with basic infrastructure, but the best equipped are the 2.3 Results
suburban ones. In typical and depopulation areas the
population is still frequently faced with the problems of In order to evaluate the importance of contextual
drinking water supply, unsettled canalisation and information in explaining fertility and family behaviour,
purifying plants and maintenance of local roads. An the major moments of the reproductive life period,
additional problem of the depopulation areas is structural and cultural characteristics of individuals were
abandonment of farming and consequently the forest compared against the regional typology.
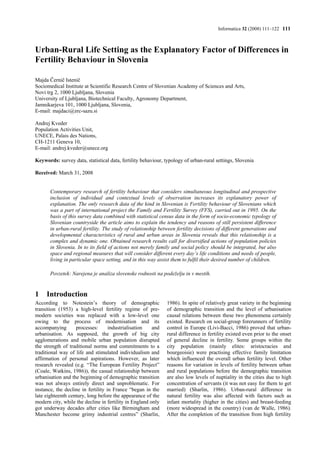
over-growing. At first, the processes of entry into the first, second
and third parenthood were compared among the regions,
taking into account both generations together (Figure 1, 2
and 3). The major differences that can be observed at the
2
The share of farm population in depopulation areas first birth are related to the differentiation of the urban
presents 200 per 1000 inhabitants, in typical rural areas areas from the rest. As survivor functions show,
this proportion counts 120 per 1000 inhabitants and in inhabitants of the urban areas tend to delay the birth of
suburban areas only 40 per 1000 inhabitants (Perpar, the first child more than the inhabitants of the other
Kovačič, 2002). regions. There are only 15 percent of women from
suburban and rural areas that are still childless 10 years
7. URBAN-RURAL LIFE SETTING AS... Informatica 32 (2008) 111–122 117
after their sexual debut, while the proportion of nullipara 1
women in the urban areas is above 30 percent. At the 0,9
second birth, the differentiation of the urban areas from 0,8
the rest still prevails; with more than 30 percent of 0,7
inhabitants that did not experience the birth of the second 0,6
child 10 years after the entry into the first parenthood. 0,5
However, in this case the suburban areas also differ 0,4
significantly from typical rural and depopulation rural 0,3
areas; approximately 24 percent of its inhabitants did not 0,2
experience the birth of the second child 10 years after the 0,1
first birth, whereas in typical rural and depopulation rural 0
areas only 18 and 14 percent of inhabitants did 1 3 5 7 9 11 13 15 17 19 21 23
respectively. In the case of the third birth, the difference duration (in years)
between areas got the character of polarity. The share of urban suburban typical rural depopulation rural
inhabitants that experienced the third birth decreased Figure 3: Time to the third birth.
significantly in all regions in comparison with the share
of inhabitants that experienced the second birth, but Table 2 shows times in years from the first sexual
particularly in urban and suburban ones, where more than intercourse to the first, second and third parenthood for
80 percent of dwellers did not experience that event at both generations separately. The older generation relates
all. In typical rural and depopulation rural areas the a more homogenous picture then the younger one, where
comparable shares are 69 and 66 percent respectively. the differences among the rural and urban areas are more
transparent. The most evidently, the 20-24 urban
1 generation postpones the parenthood in comparison to
0,9 the urban older one and their rural coevals as well.
0,8 Among the younger generation in urban areas, 25 percent
0,7 enters into first parenthood more then 4 years later (7,1
0,6
years in comparison to 2,9 years) then the first quarter of
0,5
the older generation and approximately 3 years later than
0,4
their counterparts in typical and depopulation rural areas.
0,3
Furthermore, the postponement of parenthood among
0,2
0,1
younger urban generation is manifested also in the
0
absence of any childbirth at 50th and 75th percentile and
1 3 5 7 9 11 13 15 17 19 21 23 25 27 29 consequently any second or third birth at all. Results
duration (in years) pertaining to the younger generation also show that the
urban suburban typical rural depopulation rural first births reach their maximum level the fastest in
typical rural areas.
Figure 1: Time to the first birth.
1 Table 2: Time to parenthood (in years).
0,9 First Birth Second birth Third birth
0,8 20-24 40-45 20-24 40-45 20-24 40-45
0,7 25th percentile
0,6 Urban 7.1 2.9 - 3.0 - -
0,5 Suburban 4.3 2.3 3.0 2.3 - -
Typical rural 3.3 2.2 2.6 2.3 3.2 6.0
0,4
Depopulation 3.9 2.4 3.6 2.0 - 3.8
0,3 50th percentile
0,2 Urban - 7.2 - 5.1 - -
0,1 Suburban 11.9 4.3 4.3 4.4 - -
0
Typical rural 6.6 6.6 4.2 3.7 - -
1 3 5 7 9 11 13 15 17 19 21 23 25 27
Depopulation 6.8 4.1 - 3.3 - -
75th percentile
duration (in years)
Urban - 10.3 - - - -
urban suburban typical rural depopulation rural Suburban - 7.7 6.9 9.3 - -
Figure 2: Time to the second birth. Typical rural 8.8 7.0 - 6.0 - -
Depopulation 6.5 - 6.4 - -
8. 118 Informatica 32 (2008) 111–122 M. Černič Istenič et al.
Although different patterns of entering into respondents, those from suburban areas came the most
parenthood can be observed within generations, near to their desired number. Among older generation,
substantial differences in the 40-45 generation can be concerning preferred number of children, urban and
observed in the 75th percentile values. At this level the suburban areas create one pattern (lower number) and
second births are rare among urban dwellers. There are typical and depopulation rural areas create the other one
also scarcely any families with three or more children. (higher number). This observation is consistent with
The third births are presented only at the level of 25th previous as well as with subsequent findings.
percentile among families in typical and depopulation
rural areas. In general, the intervals between childbirths 3,0
are considerably shorter in rural then in urban areas, what
2,5
has an important implication on the overall number of
children in each of the regions. 2,0
2,5
1,5
2,0 1,0
0,5
1,5
0,0
1,0 urban suburban typical rural depopulation
rural
All 40-45 years 20-24 years
0,5
Figure 5: Preferences towards the number of children
0,0
(means with confidence intervals).
urban suburban typical rural depopulation
rural
All 40-45 years 20-24 years Table 3 distinctly shows extremely interlaced
Figure 4: Actual number of children (means with differences in the ages of entering certain life events
confidence intervals). among the two observed generations and the four area
types. The prevailing pattern of sequence of events can
As a consequence of these events’ and spells’ be described as starting with the entry into sexual life,
patterns, in general, families in both types of rural areas finishing education, getting the first job, leaving the
have statistically significantly (F=27.595*** ,
3 parental home and as the last step, entry into partnership
Bonferroni post-hoc mean difference tests for Urban union. The entry into partnership union is consistently
compared to other types are -0.216***, -0.308*** and - the last event to be experienced by any observed group.
0.358*** respectively) more children then families in Some resemblances can be observed between both urban
urban areas have (Figure 4). Suburban areas do not differ and suburban areas, as well as between typical rural and
significantly from urban or the rest of rural areas, depopulation areas. In rural areas the conclusion of
however they are more similar to urban than rural areas. education process tends to precede the sexual debut.
In the case of 20-24 generation, the differentiation is
significant among urban and typical rural areas Table 3: Age at life events (in years).
Leaving
(F=8.562***, Bonferroni post-hoc mean difference tests First sexual First The end of First
parental
intercourse partnership education employment
for Urban compared to other types are -0.240**, - home
20-24 40-45 20-24 40-45 20-24 40-45 20-24 40-45 20-24 40-45
0.248*** and -0.209 respectively). It is also observed
25th percentile
that in this generation, the number of children slightly Urban 16.0 17.9 22.3 20.8 17.8 16.9 19.3 18.4 19.0 18.2
decreases in depopulation areas in comparison with Suburban 16.0 17.0 20.5 20.0 17.2 15.8 19.7 18.9 18.5 17.7
typical rural and suburban areas. Typical rural 17.0 17.0 20.5 20.6 15.9 14.5 19.3 18.3 18.0 17.3
Considering the perception of the ideal number of Depopulation 17.0 17.0 20.1 20.3 15.9 14.5 18.9 18.0 17.9 17.2
children per family, there are no great differences among 50th percentile (Median)
Urban 17.0 18.9 24.8 23.3 20.6 20.5 22.7 20.3 21.3 19.8
rural and urban areas (Figure 5). The overall perceived
Suburban 18.0 18.0 - 22.1 18.3 18.3 24.4 20.8 19.8 18.8
ideal family size is above two children, though it is a bit
Typical rural 18.0 18.0 22.9 22.5 17.4 17.5 22.8 20.5 18.8 18.5
diverse concerning the region type and age. In particular,
Depopulation 18.0 18.0 23.3 22.4 17.1 16.7 20.4 19.3 18.6 18.6
the members of the younger generation from urban and
75th percentile
suburban areas want more children then their older Urban 18.0 20.0 - 26.7 - 25.8 - 24.3 - 22.5
counterparts do. In this regards they are quite similar to Suburban 18.0 20.0 - 25.4 23.7 24.9 - 24.8 23.9 21.5
their rural counterparts. Of course, more conclusive Typical rural 19.0 20.0 - 25.3 19.1 22.7 - 24.7 20.2 21.2
observations concerning the match between preferred Depopulation 19.0 20.0 - 24.8 18.8 18.4 - 24.0 20.2 21.6
and actual number of children can only be drawn from The main difference between the two generations
the older generation, which more or less already finished irrespectively of the region is in the earlier sexual debut
its reproductive period. It seems that among all older and the postponing of all other events of the younger
population, especially setting up a partnership union and
an independent life away form parents, which is most
3
p < 0.01 - ***, 0.01 < p < 0.05 - **, 0.05 < p < 0.10 - * evident in the young urban generation. The end of
9. URBAN-RURAL LIFE SETTING AS... Informatica 32 (2008) 111–122 119
education process tends to differentiate most strongly 3,6
among generations and regions. The older generation in 3,4
depopulation areas is the first to finish their education, 3,2
whereas the young urban generation is the last. As in 3
case of entry into parenthood, the intervals between 2,8
Scale
above listed events which are considerably shorter in
2,6
rural areas then in urban ones, additionally contribute to
2,4
a different fertility level in observed areas.
Table 3 can be observed in relation to the 2,2
contraceptive use (Figure 6). Among the younger 2
u rba n su bur ba n typ ica l rura l depo pu lat io n rura l
generation, the most common contraception method used A ll 4 0-4 5 ye ars 2 0-2 4 ye ars
at the time of the interview was hormonal contraception
following by condom and withdrawal. The rarest method Figure 7: Attitudes towards abortion (means with
used was injection. Quite substantial differences can be confidence intervals).
observed among different regions. Depopulation areas
have a very low condom or diaphragm usage (6,7 Attitudes towards abortion are in line with the
percent) compared to other regions (14 percent in urban respondents’ expressed religiosity. Figure 8 shows quite
to 23 percent in suburban areas), but on the other hand, high and significant differences across observed regions.
they have the highest usage of hormonal contraception Only one third of urban dwellers defined themselves as
(33,3 percent). However, the key finding is higher being religious, while more than a half of the inhabitants
proportion of non users among typical rural dwellers (40 of the other three regions did. Typically, rural areas have
percent) than in other areas (24 to 33 percent). Thus, the the highest proportion of religious people. Within the
differences among the regions in relation to the entries younger generation, these differences are even more
into certain life events, as well as in the birth of the first expressed (χ2 sig. p=0.000; Adjusted Standardized
child, are reflected in variations of contraceptive use. Residuals for Urban 20-24 are -5.6 “Religious” and 6.4
“Not Religious”).
Share of respondents in %
0,0 5,0 10,0 15,0 20,0 25,0 30,0 35,0 Do not know
Not religious
Pill 20-25 Nether nor
Condom years
Religious
Current non-user
Non-user less than 3 months
No sex
Methods
Do not know
Ever non-user
Withdrawal 40-45 Not religious
Periodical abstinence years Nether nor
UID Religious
Pregnancy 0,0 10,0 20,0 30,0 40,0 50,0 60,0 70,0
Diaphragm
Share in %
Injection
urban suburban typical rural depopulation rural
urban suburban typical rural Depopulation rural
Figure 6: Current usage of contraception (20-25 years). Figure 8: Religiosity.
Explanation for the difference in the number of children The results concerning the attitudes towards marriage
can also be indicated in relation with the attitudes and gender roles reveal a rather different picture. As
towards abortion. The results in Figure 7 show, that Figure 9 shows, irrespective of the region and the age
abortion is not a very acceptable phenomenon among the among the respondents, there are no significant
respondents. However, there is a small, but a consistent differences in the preference of either cohabitation or
downward trend in acceptability of abortion from urban institution of marriage. Only the 40-45 generation in
to depopulation areas. Abortion tends to be more often urban areas shows a significant tendency (F=8.620***;
considered fairly unacceptable in rural areas, whereas in Bonferroni post-hoc mean difference tests for Urban
urban areas, the average attitude is more pro-choice compared to Suburban and Depopulation Rural urban are
oriented. In general, there are no statistically significant -0.2379** and -2562** respectively) towards favouring
differences between the two observed generations, except the cohabitation over marriage in comparison to other
in typical rural areas where the young show significantly regions, whereas younger generation everywhere is more
greater (F=10.370***, Bonferroni post-hoc mean inclined towards cohabitation than marriage. These
difference tests for Typical Rural compared to urban is - results are consistent with the share of respondents living
0.613***) opposition towards the abortion as the free in cohabitation unions: in urban areas the share is 15
choice act than the older generation does. percent, in suburban 10,8, in typical rural 12,4 and in
depopulation rural 13,7 percent. All respondents also
share the same tendency in attitudes towards supporting
10. 120 Informatica 32 (2008) 111–122 M. Černič Istenič et al.
the equality of gender roles (Figure 10). There are no others
major differences between generations or regions. with other relatives
non-relatives
with one parent
3,6 parents and others
parents and siblings
3,4 children and others
children
3,2
partner, children and others
3 partner and children
partner and others
Scale
2,8
partner
2,6 alone
2,4 0 10 20 30 40 50 60
Share of respondents in %
2,2
urban suburban typical rural depopulation rural
2
urban suburban typical rural depopulation rural
All 40-45 years 20-24 years
Figure 11: Household composition.
Figure 9: Marriage vis-á-vis cohabitation (means with 2.4 Conclusions
confidence intervals).
Based on the presented results, the first and the third
hypothesis can fully be confirmed. The analysis revealed
3,6
that fertility behaviour of Slovenian population is
3,4
significantly related to the socio-economic context of
3,2 diverse socio-geographical regions; the more developed
3 is one setting in terms of favourable and diverse
2,8 economic activities, available infrastructural capacities
Scale
2,6 and social services, the lower is fertility of its dwellers.
2,4
Nevertheless, the application of regional typology also
revealed that relations of urban-rural division are not
2,2
uniform and static. Population of urban areas with the
2
urban suburban typical rural depopulation rural
pattern of postponement of first births considerably
All 40-45 years 20-24 years
differs from the other regions, whereas at the second and
even more at the third birth, the population of suburban
Figure 10: Gender (means with confidence intervals). areas is getting gradually more similar to the urban ones.
The typical rural areas are the most stable in relatively
Substantive differences among regions (χ2 sig. p=0.000) high fertility pattern, whereas in depopulation areas, this
are revealed in the household composition (Figure 11). pattern is no longer very firm, most probably due to less
The largest differences are related to the rate of nuclear favourable developmental conditions. Changing
and extended families - of orientation and procreation - similarities and differences among the regions are
which represent two predominant household composition particularly related to behavioural patterns of the younger
types in all regions and both generations. The extended generation. The results revealed that tempo and
family in depopulation regions of Slovenia represents sequences of events in entering into adulthood changed
one third of households, while in the urban areas, this significantly between generations. In older generation
proportion is less then 10 percent. Nuclear family is the among all regions, the life events, that normatively
most representative composition type where the majority precede parenthood, followed each other quicker than in
of the respondents live. However, in this regards the the case of the younger generation. In older generation
difference among the regions is significant (Adjusted among the regions the variations in transition to
Standardized Residuals for Depopulation Rural are -5.4 adulthood certainly exist. But contrary to our
“Partner and Children” and -2.5 “Parents and siblings”); expectations, formulated in the second hypothesis, these
depopulation areas are just above the 50 percent mark, variations are even more pronounced among the younger
whereas in other regions the share of this type of generation, particularly due to distinctive behaviour of
households is around 70 percent, being the highest in urban youth. According to the theory of second
suburban areas (over 75 percent). Although one-parent demographic transition, this group shows an indicative
family households are relatively rare, they can only be pattern of post-modern demographic life course both
observed in the urban and suburban areas (6,9 – 4,1 through their behaviour and expressed attitudes, whereas
percent), while in the rural areas they are more an rural young generation, for the most part those living in
exception then a rule (1,9 - 0,9 percent). Very similar typical rural areas, mainly follow the pattern of their
proportions among regions hold true for those living older counterparts. As our analysis indicates, variations
alone. Thus, the variation in number of children in in fertility behaviour among the regions and generations
various areas is reflected in the household composition can be more pertinently explained by social structural
and consequently in their life style. factors (education, household type) then values and
attitudes pertaining to the post-modern life patterns.
11. URBAN-RURAL LIFE SETTING AS... Informatica 32 (2008) 111–122 121
The obtained results call for greater attention to more [5] Bonner, K.M. (1999) A Great Place to Raise Kids.
contextualised approaches in demographic research. Our Interpretation, Science, and the Urban-Rural
analysis demonstrated that rural setting as a social space Debate. McGill-Queen’s University Press, Montreal
is not a homogeneous category, but a grouping of various & Kingstone · London · Ithach.
structural and cultural characteristics that might [6] Boyle, P. (2003) Population geography: does
specifically determine fertility behaviour. By neglecting geography matter in fertility research? Progress in
this reality, too much information needed for better Human Geography, 27(5): 615-626.
understandings of variations in fertility behaviour could [7] Bourdieu, P. (2003) Practical Reason. On the
be lost unduly. The residues of the past urban-rural Theory of Action. Polity Press. Cambridge.
differences in fertility behaviour are still present today [8] Coale, A. J., Watkins, S. C.(1986) The Fertility
despite the effects of global economic and social trends Decline in Europe. Princeton University Press.
that carry structural and ideational changes into the Princeton. New Jersey.
countryside and will, as our analysis indicates, also [9] Cordon, J. A. F. (1997) Youth residential
remain in the near future. From this point of view, it was independence and autonomy: A comparative study.
unreasonable that international project Fertility and Journal of Family Issues. 18 (6): 576-607.
Family Surveys in ECE countries under supervision of [10] Černič Istenič, M. (1994) Rodost v Sloveniji.
United Nation gave so little attention to urban-rural (Fertility in Slovenia) Znanstveno in publicistično
dimension. Among 22 European countries included in središče. Ljubljana.
this project, only five of them (Poland, Estonia, [11] Černič Istenič, M., Obersnel-Kveder, D., Kveder,
Lithuania, Switzerland and Slovenia) took into A. (2000) Differences in contraceptive behaviour of
consideration the respondents’ place of residence. In the men and women in Slovenia regarding their
new Generations and Gender Programme (GGP), which partnership and parenthood history. Paper presented
started in the year 2000, the need for more contextual at the Flagship Conference, Brussels, May 29-31.
approach is fully considered; all micro, mezzo and macro [12] Černič Istenič, M., Kveder, A. (2000) Urban-rural
levels are taken into account. On that basis pertinent differences in fertility behaviour in Slovenia. Paper
results are expected. Hopefully, Slovenian researchers presented at X. World Conference of Rural
will also have the opportunity to join these endeavours. Sociologists, Rio de Janeiro; July 30 - August 5.
The observed differences in fertility behaviour [13] Djurfeldt, G. (1999) From CAP to CAR? New
patterns among generations living in various Directions in European Rural Sociology.
geographical regions with different socio-economic http://www.soc.lu.se/esrs.
characteristics also call for diversified actions of [14] Hays, S.P. (1993) From the history of the city to the
population policies. In the near past it was anticipated history of the urbanized society. Journal of Urban
that family and social policy measures would contribute History. 19(4): 3-23.
to uninterrupted population reproduction in Slovenia the [15] Hoffman-Novotny, H.-J. (1987) The Future of the
most successfully. However, as our results indicate, Family. European Population Conference. Issues
population policy also has to integrate space and regional and Prospects. Plenary Séances. Central Statistical
measures in to its field of actions; i.e. urban and rural Office of Finland. Helsinki. pp. 113-199.
developmental programmes that will consider different [16] Iedema, J., Becker, H. A., Sanders, K. (1997).
every day’s life conditions and needs of people living in Transition into independence: A comparison of
particular space setting. To scientifically support such cohorts born since 1930in The Netherlands.
actions, a new research data, e.g. in the frame of GGP, European Sociological Review, 13 ( 2): 117-137.
that will provide the picture of the present generations of [17] Ingleahrt, R. (1989). Kultureller Umbruch. Campus
reproductive age from various viewing angles, are Verlag. Frankfurt/New York.
urgently needed. [18] Javornik, J.(1999). Slovenija v 90-ih. Prebivalstvo
(Slovenia in the 1990s). In: Hanžek, M. (ed.)
References Poročilo o človekovemu razvoju Slovenije 1999
(Human Development Report for Slovenia 1999).
[1] Allison, P.D. (1995) Survival Analysis Using The Urad R Slovenije za makroekonomske analize in
SAS System. A Practical Guide. Cary. SAS razvoj. Ljubljana. pp. 65-67.
Institute Inc. [19] Kaa, Van de, D. (1987) Europe's second
[2] Andorka, F. (1978) Determinants of Fertility in demographic transition. Population Bulletin, 42(1):
Advanced Countries. Methuen & Co. Ltd. London. 1-47.
[3] Barbič, A. (1991) K "novemu" pojmovanju [20] Kaa, Van de, D. (1999) Europe and its population:
ruralnosti (Towards a "New" Comprehension of the long view. In: Kaa, Van de, D., Leridon, H.,
Rurality) In: Barbič, A. (ed.) Prihodnost Gesano, G., Okolski, M. (eds.) European
slovenskega podeželja. Prostor, prebivalci, Populations Unity in Diversity. European
gospodarske dejavnosti (A future of Slovenian Population Studies no.6. Kluwer Academic
Countryside. Space, Inhabitants and Economic Publishers. Dordrecht/Boston / London. pp. 1-49.
Activities). Dolenjska založba. Novo mesto. [21] Klemenčič, V. (2002) Procesi deagrarizacije in
[4] Bell, C., Newby, H. (1971) Community Studies. urbanizacije slovenskega podeželja (Processes of
Allen and Unwin Ltd. London. deagrarisation and urbanisation of Slovenian
12. 122 Informatica 32 (2008) 111–122 M. Černič Istenič et al.
countryside). Podeželje na prelomu tisočletja [33] Newby, H. (1980) Urbanisation and the Rural Class
(Countryside at the break of the century/ Structure: Reflections on a Case Study. In The
Mednarodna znanstvena geografska konferenca Rural Sociology of Advanced Societies: Critical
(International scientific geographic conference), Perspectives. Croom Helm. London.
Ljubljana, 19.-21. September 2001. Ljubljana. [34] Notestein, F. (1953) Economic problems of
Oddelek za geografijo Filozofske fakultete. population change. In: Proceedings of the Eight
Accessible on: (http://www.ff.uni-lj.si /oddelki /geo International Conference of Agricultural
/ Economists. London. Oxford University Press. pp.
publikacije/dela/files/Dela_17/Vladimir_Klemencic 13-31.
.pdf) [35] Obersnel Kveder, D., Kožuh Novak, M., Černič
[22] Kovačič, M, Perpar, A., Gosar, L. (2002) Členitev Istenič, M., Šircelj, V., Vehovar, V., Rojnik, B.
podeželja v Sloveniji (Differentiation of (2001) Fertility and Family Surveys in Countries of
countryside in Slovenia) Sodobno kmetijstvo. the ECE Region – Standard Country Report,
35(2): 62-66. Slovenia. Economic Studies No. 10r, UNECE,
[23] Kovačič, M., Gosar, L., Fabijan, R., Perpar, A. UNFPA, New York/Geneva.
(2000). Razvojno – tipološka členitev podeželja v [36] Pahl, R.E. (1965) Urbs in Rure: The Metropolitan
Republiki Sloveniji (Developmentally – Fringe in Hertfordshire. Wiedenfeld & Nickelson.
Typological Differentiation of Rural Areas in the London.
Republic of Slovenia.). Institute of Agricultural [37] Pahl R.E. (1966) The rural-urban continuum.
Economics, Biotechnical Faculty, University of Sociologia Ruralis. 6(3): 299-329.
Ljubljana. [38] Pečan, J., Ravbar, M. (1999) Regionalni razvoj
[24] Kovačič, M. (1995) Idejne in teoretske osnove za Slovenije (Regional Development of Slovenia). In:
razvoj podeželja (Ideal and theoretical basis for the Hanžek, M. (ed.) Poročilo o človekovemu razvoju
countryside development) In: Kovačič, M. (ed.) Slovenije 1999 (Human Development Report for
Izhodišča, sestavine in problemi celovitega razvoja Slovenia 1999). Urad R Slovenije za
podeželja v Sloveniji (Starting-points, components makroekonomske analize in razvoj. Ljubljana. pp.
and problems of integral countryside development 31-63.
in Slovenia) Biotechnical Faculty, University of [39] Perpar, A., Kovačič, M. (2002) Razvojno stanje,
Ljubljana, pp. 3-20 značilnosti in problemi podeželskih območij v
[25] Livi-Bacci, M. (1986) Social-Group Forerunners in Sloveniji (Development situation, characteristics
Fertility Control in Europe. In: Coale, A. J., and problems of rural areas in Slovenia). Sodobno
Watkins, S. C. (ed.): The Fertility Decline in kmetijstvo. 35( 2): 52-61.
Europe. Princeton University Press. Princeton. New [40] Sharlin, A. (1986) Urban-Rural Difference in
Jersey, pp.182-200. Fertility in Europe during the Demographic
[26] Mackensen, R. (1982) Social Change and Transition. In: Coale, A. J., Watkins, S. C. (ed.):
Reproductive Behaviour – on Continuos Transition. The Fertility Decline in Europe. Princeton
In: Hohn, C., Mackensen, R. (eds.) Determinants of University Press. Princeton. New Jersey, pp.234-
Fertility Trends: Theories Re-examined. Ordina ed.. 257.
Liege. pp. 251-279. [41] Statistical Yearbook (2003) Statistical Office of
[27] Mahon, M. (2001) Reconceptualising rural change. Republic of Slovenia. Ljubljana.
A literature review. Paper presented at XIX [42] Šircelj, V. (2007) Fertility and educational
European Congress for Rural Sociology. Dijon, attainment in Slovenia. Anthropological Notebooks.
September 3-7. 13(2): 11-34.
[28] Malačič, J. (1990) Načrtovanje zdravega potomstva [43] Šircelj, V., Ilič, M., Kuhar, A., Zupančič, M. (1990)
– odgovornost posameznika do družbe (The Projekcije prebivalstva R Slovenije 1986-2006
planning of healthy future generations – the (Population projection of republic of Slovenia
individual’s responsibility towards society). 1986-2006). Statistical Office of Republic of
Zdravstveni vestnik. 59(7-8): 349-354. Slovenia. Ljubljana.
[29] Marsden, T. (1998) New rural territories: [44] Šircelj, V. (1991) Determinante rodnosti v Sloveniji
Regulating the differentiated rural space. Journal of (Determinants of fertility in Slovenia): Doctoral
Rural Studies. 14(1): 107-117. Dissertation. Faculty of Arts, University of
[30] Marsden, T. (1999) Rural futures: The consumption Ljubljana.
countryside and its regulation. Sociologia Ruralis. [45] Vrišer, I. (1998) Središčna (centralna) naselja.
39(4): 501-520. (Central (capital) settlements). In: Geografski atlas
[31] Nave-Herz, R. (1997) Still in the nest: The family Slovenije. Ljubljana, DZS. pp. 308-309.
and young adults in Germany. Journal of Family [46] Williams, W.M. (1963) A West Country
Issues. 18(6): 671-689. [47] Village: Ashworthy: Family, Kinship, and Land.
[32] Newby, H. (1978) Property, Paternalism and Routledge Kegan Paul. London.
Power: Class and Control in Rural England.
Hutchinson. London.