SlideShare a Scribd company logo
1 of 2
Download to read offline
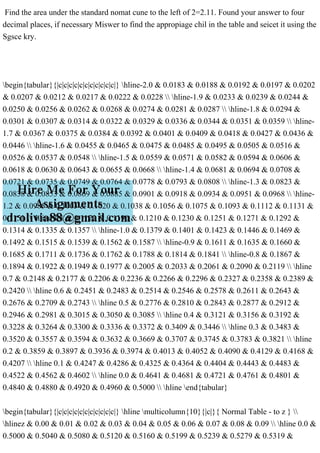
Find the area under the standard nomat cune to the left of 2=2.11. Found your answer to four
decimal places, if necessary Miswer to find the appropiage chil in the table and seicet it using the
Sgsce kry.
begin{tabular}{|c|c|c|c|c|c|c|c|c|c|c|} hline-2.0 & 0.0183 & 0.0188 & 0.0192 & 0.0197 & 0.0202
& 0.0207 & 0.0212 & 0.0217 & 0.0222 & 0.0228  hline-1.9 & 0.0233 & 0.0239 & 0.0244 &
0.0250 & 0.0256 & 0.0262 & 0.0268 & 0.0274 & 0.0281 & 0.0287  hline-1.8 & 0.0294 &
0.0301 & 0.0307 & 0.0314 & 0.0322 & 0.0329 & 0.0336 & 0.0344 & 0.0351 & 0.0359  hline-
1.7 & 0.0367 & 0.0375 & 0.0384 & 0.0392 & 0.0401 & 0.0409 & 0.0418 & 0.0427 & 0.0436 &
0.0446  hline-1.6 & 0.0455 & 0.0465 & 0.0475 & 0.0485 & 0.0495 & 0.0505 & 0.0516 &
0.0526 & 0.0537 & 0.0548  hline-1.5 & 0.0559 & 0.0571 & 0.0582 & 0.0594 & 0.0606 &
0.0618 & 0.0630 & 0.0643 & 0.0655 & 0.0668  hline-1.4 & 0.0681 & 0.0694 & 0.0708 &
0.0721 & 0.0735 & 0.0749 & 0.0764 & 0.0778 & 0.0793 & 0.0808  hline-1.3 & 0.0823 &
0.0838 & 0.0853 & 0.0869 & 0.0885 & 0.0901 & 0.0918 & 0.0934 & 0.0951 & 0.0968  hline-
1.2 & 0.0985 & 0.1003 & 0.1020 & 0.1038 & 0.1056 & 0.1075 & 0.1093 & 0.1112 & 0.1131 &
0.1151  hline 1.1 & 0.1170 & 0.1190 & 0.1210 & 0.1230 & 0.1251 & 0.1271 & 0.1292 &
0.1314 & 0.1335 & 0.1357  hline-1.0 & 0.1379 & 0.1401 & 0.1423 & 0.1446 & 0.1469 &
0.1492 & 0.1515 & 0.1539 & 0.1562 & 0.1587  hline-0.9 & 0.1611 & 0.1635 & 0.1660 &
0.1685 & 0.1711 & 0.1736 & 0.1762 & 0.1788 & 0.1814 & 0.1841  hline-0.8 & 0.1867 &
0.1894 & 0.1922 & 0.1949 & 0.1977 & 0.2005 & 0.2033 & 0.2061 & 0.2090 & 0.2119  hline
0.7 & 0.2148 & 0.2177 & 0.2206 & 0.2236 & 0.2266 & 0.2296 & 0.2327 & 0.2358 & 0.2389 &
0.2420  hline 0.6 & 0.2451 & 0.2483 & 0.2514 & 0.2546 & 0.2578 & 0.2611 & 0.2643 &
0.2676 & 0.2709 & 0.2743  hline 0.5 & 0.2776 & 0.2810 & 0.2843 & 0.2877 & 0.2912 &
0.2946 & 0.2981 & 0.3015 & 0.3050 & 0.3085  hline 0.4 & 0.3121 & 0.3156 & 0.3192 &
0.3228 & 0.3264 & 0.3300 & 0.3336 & 0.3372 & 0.3409 & 0.3446  hline 0.3 & 0.3483 &
0.3520 & 0.3557 & 0.3594 & 0.3632 & 0.3669 & 0.3707 & 0.3745 & 0.3783 & 0.3821  hline
0.2 & 0.3859 & 0.3897 & 0.3936 & 0.3974 & 0.4013 & 0.4052 & 0.4090 & 0.4129 & 0.4168 &
0.4207  hline 0.1 & 0.4247 & 0.4286 & 0.4325 & 0.4364 & 0.4404 & 0.4443 & 0.4483 &
0.4522 & 0.4562 & 0.4602  hline 0.0 & 0.4641 & 0.4681 & 0.4721 & 0.4761 & 0.4801 &
0.4840 & 0.4880 & 0.4920 & 0.4960 & 0.5000  hline end{tabular}
begin{tabular}{|c|c|c|c|c|c|c|c|c|c|c|} hline multicolumn{10}{|c|}{ Normal Table - to z } 
hlinez & 0.00 & 0.01 & 0.02 & 0.03 & 0.04 & 0.05 & 0.06 & 0.07 & 0.08 & 0.09  hline 0.0 &
0.5000 & 0.5040 & 0.5080 & 0.5120 & 0.5160 & 0.5199 & 0.5239 & 0.5279 & 0.5319 &
0.5359  hline 0.1 & 0.5398 & 0.5438 & 0.5478 & 0.5517 & 0.5557 & 0.5596 & 0.5636 &
0.5675 & 0.5714 & 0.5753  hline 0.2 & 0.5793 & 0.5832 & 0.5871 & 0.5910 & 0.5948 &
0.5987 & 0.6026 & 0.6064 & 0.6103 & 0.6141  hline 0.3 & 0.6179 & 0.6217 & 0.6255 &
0.6293 & 0.6331 & 0.6368 & 0.6406 & 0.6443 & 0.6480 & 0.6517  hline 0.4 & 0.6554 &
0.6591 & 0.6628 & 0.6664 & 0.6700 & 0.6736 & 0.6772 & 0.6808 & 0.6844 & 0.6879  hline
0.5 & 0.6915 & 0.6950 & 0.6985 & 0.7019 & 0.7054 & 0.7088 & 0.7123 & 0.7157 & 0.7190 &
0.7224  hline 0.6 & 0.7257 & 0.7291 & 0.7324 & 0.7357 & 0.7389 & 0.7422 & 0.7454 &
0.7486 & 0.7517 & 0.7549  hline 0.7 & 0.7580 & 0.7611 & 0.7642 & 0.7673 & 0.7704 &
0.7734 & 0.7764 & 0.7794 & 0.7823 & 0.7852  hline 0.8 & 0.7881 & 0.7910 & 0.7939 &
0.7967 & 0.7995 & 0.8023 & 0.8051 & 0.8078 & 0.8106 & 0.8133  hline 0.9 & 0.8159 &
0.8186 & 0.8212 & 0.8238 & 0.8264 & 0.8289 & 0.8315 & 0.8340 & 0.8365 & 0.8389  hline
1.0 & 0.8413 & 0.8438 & 0.8461 & 0.8485 & 0.8508 & 0.8531 & 0.8554 & 0.8577 & 0.8599 &
0.8621  hline 1.1 & 0.8643 & 0.8665 & 0.8686 & 0.8708 & 0.8729 & 0.8749 & 0.8770 &
0.8790 & 0.8810 & 0.8830  hline 1.2 & 0.8849 & 0.8869 & 0.8888 & 0.8907 & 0.8925 &
0.8944 & 0.8962 & 0.8980 & 0.8997 & 0.9015  hline 1.3 & 0.9032 & 0.9049 & 0.9066 &
0.9082 & 0.9099 & 0.9115 & 0.9131 & 0.9147 & 0.9162 & 0.9177  hline 1.4 & 0.9192 &
0.9207 & 0.9222 & 0.9236 & 0.9251 & 0.9265 & 0.9279 & 0.9292 & 0.9306 & 0.9319  hline
1.5 & 0.9332 & 0.9345 & 0.9357 & 0.9370 & 0.9382 & 0.9394 & 0.9406 & 0.9418 & 0.9429 &
0.9441  hline 1.6 & 0.9452 & 0.9463 & 0.9474 & 0.9484 & 0.9495 & 0.9505 & 0.9515 &
0.9525 & 0.9535 & 0.9545  hline 1.7 & 0.9554 & 0.9564 & 0.9573 & 0.9582 & 0.9591 &
0.9599 & 0.9608 & 0.9616 & 0.9625 & 0.9633  hline 1.8 & 0.9641 & 0.9649 & 0.9656 &
0.9664 & 0.9671 & 0.9678 & 0.9686 & 0.9693 & 0.9699 & 0.9706  hline 1.9 & 0.9713 &
0.9719 & 0.9726 & 0.9732 & 0.9738 & 0.9744 & 0.9750 & 0.9756 & 0.9761 & 0.9767  hline
2.0 & 0.9772 & 0.9778 & 0.9783 & 0.9788 & 0.9793 & 0.9798 & 0.9803 & 0.9808 & 0.9812 &
0.9817  hline end{tabular}

More Related Content

More from vineetaries09

Find the solution of the following recurrence relation T(n)=7T(2n)+n.pdf
 Find the solution of the following recurrence relation T(n)=7T(2n)+n.pdf Find the solution of the following recurrence relation T(n)=7T(2n)+n.pdf
Find the solution of the following recurrence relation T(n)=7T(2n)+n.pdfvineetaries09
 
Find the probability that x is between four and 14. (Round your answe.pdf
 Find the probability that x is between four and 14. (Round your answe.pdf Find the probability that x is between four and 14. (Round your answe.pdf
Find the probability that x is between four and 14. (Round your answe.pdfvineetaries09
 
Find the P-value for the following values of the test stetistic 1 , s.pdf
 Find the P-value for the following values of the test stetistic 1 , s.pdf Find the P-value for the following values of the test stetistic 1 , s.pdf
Find the P-value for the following values of the test stetistic 1 , s.pdfvineetaries09
 
Find the P-value for a left-tailed hypothesis test with a test statis.pdf
 Find the P-value for a left-tailed hypothesis test with a test statis.pdf Find the P-value for a left-tailed hypothesis test with a test statis.pdf
Find the P-value for a left-tailed hypothesis test with a test statis.pdfvineetaries09
 
Find the median of the distribution of the random variable Y where .pdf
 Find the median of the distribution of the random variable Y where .pdf Find the median of the distribution of the random variable Y where .pdf
Find the median of the distribution of the random variable Y where .pdfvineetaries09
 
Find the area of the shaded region. The graph depicts the standard no.pdf
 Find the area of the shaded region. The graph depicts the standard no.pdf Find the area of the shaded region. The graph depicts the standard no.pdf
Find the area of the shaded region. The graph depicts the standard no.pdfvineetaries09
 
Find the insicated 10 score. The graphso the right depicts iO scores .pdf
 Find the insicated 10 score. The graphso the right depicts iO scores .pdf Find the insicated 10 score. The graphso the right depicts iO scores .pdf
Find the insicated 10 score. The graphso the right depicts iO scores .pdfvineetaries09
 
Find the mean of the following probability distribution Round to the.pdf
 Find the mean of the following probability distribution Round to the.pdf Find the mean of the following probability distribution Round to the.pdf
Find the mean of the following probability distribution Round to the.pdfvineetaries09
 
Find the indicated probability of the standard normal random variable.pdf
 Find the indicated probability of the standard normal random variable.pdf Find the indicated probability of the standard normal random variable.pdf
Find the indicated probability of the standard normal random variable.pdfvineetaries09
 
Find the indicated IQ score. The graph to the right depicts IQ scor.pdf
 Find the indicated IQ score. The graph to the right depicts IQ scor.pdf Find the indicated IQ score. The graph to the right depicts IQ scor.pdf
Find the indicated IQ score. The graph to the right depicts IQ scor.pdfvineetaries09
 
Find the indicated IQ score. The graph to the right depicts IQ scores.pdf
 Find the indicated IQ score. The graph to the right depicts IQ scores.pdf Find the indicated IQ score. The graph to the right depicts IQ scores.pdf
Find the indicated IQ score. The graph to the right depicts IQ scores.pdfvineetaries09
 
Find the indicated area under the standard normal curve To the left o.pdf
 Find the indicated area under the standard normal curve To the left o.pdf Find the indicated area under the standard normal curve To the left o.pdf
Find the indicated area under the standard normal curve To the left o.pdfvineetaries09
 
Find the Fourier series of f(x)={1,2,2x00x2.pdf
 Find the Fourier series of f(x)={1,2,2x00x2.pdf Find the Fourier series of f(x)={1,2,2x00x2.pdf
Find the Fourier series of f(x)={1,2,2x00x2.pdfvineetaries09
 
Find each for a 95 confidence level (.95 level) The value of alpha T.pdf
 Find each for a 95 confidence level (.95 level) The value of alpha T.pdf Find each for a 95 confidence level (.95 level) The value of alpha T.pdf
Find each for a 95 confidence level (.95 level) The value of alpha T.pdfvineetaries09
 
Find a tight asymtotic bound for T(n) given by the following recurren.pdf
 Find a tight asymtotic bound for T(n) given by the following recurren.pdf Find a tight asymtotic bound for T(n) given by the following recurren.pdf
Find a tight asymtotic bound for T(n) given by the following recurren.pdfvineetaries09
 
Find the confidence level related to the critical value z2=1.787. .pdf
 Find the confidence level related to the critical value z2=1.787. .pdf Find the confidence level related to the critical value z2=1.787. .pdf
Find the confidence level related to the critical value z2=1.787. .pdfvineetaries09
 
Find the area of the shaded region. The graph to the right depicts 1Q.pdf
 Find the area of the shaded region. The graph to the right depicts 1Q.pdf Find the area of the shaded region. The graph to the right depicts 1Q.pdf
Find the area of the shaded region. The graph to the right depicts 1Q.pdfvineetaries09
 
Find P(X+Y4). Express final answer as fraction.The joint probabil.pdf
 Find P(X+Y4). Express final answer as fraction.The joint probabil.pdf Find P(X+Y4). Express final answer as fraction.The joint probabil.pdf
Find P(X+Y4). Express final answer as fraction.The joint probabil.pdfvineetaries09
 
Find the domain of f. Use an inequality to write the domain. Select t.pdf
 Find the domain of f. Use an inequality to write the domain. Select t.pdf Find the domain of f. Use an inequality to write the domain. Select t.pdf
Find the domain of f. Use an inequality to write the domain. Select t.pdfvineetaries09
 
Find the area of the shaded region. The graph to the right depicts IQ.pdf
 Find the area of the shaded region. The graph to the right depicts IQ.pdf Find the area of the shaded region. The graph to the right depicts IQ.pdf
Find the area of the shaded region. The graph to the right depicts IQ.pdfvineetaries09
 

More from vineetaries09 (20)

Find the solution of the following recurrence relation T(n)=7T(2n)+n.pdf
 Find the solution of the following recurrence relation T(n)=7T(2n)+n.pdf Find the solution of the following recurrence relation T(n)=7T(2n)+n.pdf
Find the solution of the following recurrence relation T(n)=7T(2n)+n.pdf
 
Find the probability that x is between four and 14. (Round your answe.pdf
 Find the probability that x is between four and 14. (Round your answe.pdf Find the probability that x is between four and 14. (Round your answe.pdf
Find the probability that x is between four and 14. (Round your answe.pdf
 
Find the P-value for the following values of the test stetistic 1 , s.pdf
 Find the P-value for the following values of the test stetistic 1 , s.pdf Find the P-value for the following values of the test stetistic 1 , s.pdf
Find the P-value for the following values of the test stetistic 1 , s.pdf
 
Find the P-value for a left-tailed hypothesis test with a test statis.pdf
 Find the P-value for a left-tailed hypothesis test with a test statis.pdf Find the P-value for a left-tailed hypothesis test with a test statis.pdf
Find the P-value for a left-tailed hypothesis test with a test statis.pdf
 
Find the median of the distribution of the random variable Y where .pdf
 Find the median of the distribution of the random variable Y where .pdf Find the median of the distribution of the random variable Y where .pdf
Find the median of the distribution of the random variable Y where .pdf
 
Find the area of the shaded region. The graph depicts the standard no.pdf
 Find the area of the shaded region. The graph depicts the standard no.pdf Find the area of the shaded region. The graph depicts the standard no.pdf
Find the area of the shaded region. The graph depicts the standard no.pdf
 
Find the insicated 10 score. The graphso the right depicts iO scores .pdf
 Find the insicated 10 score. The graphso the right depicts iO scores .pdf Find the insicated 10 score. The graphso the right depicts iO scores .pdf
Find the insicated 10 score. The graphso the right depicts iO scores .pdf
 
Find the mean of the following probability distribution Round to the.pdf
 Find the mean of the following probability distribution Round to the.pdf Find the mean of the following probability distribution Round to the.pdf
Find the mean of the following probability distribution Round to the.pdf
 
Find the indicated probability of the standard normal random variable.pdf
 Find the indicated probability of the standard normal random variable.pdf Find the indicated probability of the standard normal random variable.pdf
Find the indicated probability of the standard normal random variable.pdf
 
Find the indicated IQ score. The graph to the right depicts IQ scor.pdf
 Find the indicated IQ score. The graph to the right depicts IQ scor.pdf Find the indicated IQ score. The graph to the right depicts IQ scor.pdf
Find the indicated IQ score. The graph to the right depicts IQ scor.pdf
 
Find the indicated IQ score. The graph to the right depicts IQ scores.pdf
 Find the indicated IQ score. The graph to the right depicts IQ scores.pdf Find the indicated IQ score. The graph to the right depicts IQ scores.pdf
Find the indicated IQ score. The graph to the right depicts IQ scores.pdf
 
Find the indicated area under the standard normal curve To the left o.pdf
 Find the indicated area under the standard normal curve To the left o.pdf Find the indicated area under the standard normal curve To the left o.pdf
Find the indicated area under the standard normal curve To the left o.pdf
 
Find the Fourier series of f(x)={1,2,2x00x2.pdf
 Find the Fourier series of f(x)={1,2,2x00x2.pdf Find the Fourier series of f(x)={1,2,2x00x2.pdf
Find the Fourier series of f(x)={1,2,2x00x2.pdf
 
Find each for a 95 confidence level (.95 level) The value of alpha T.pdf
 Find each for a 95 confidence level (.95 level) The value of alpha T.pdf Find each for a 95 confidence level (.95 level) The value of alpha T.pdf
Find each for a 95 confidence level (.95 level) The value of alpha T.pdf
 
Find a tight asymtotic bound for T(n) given by the following recurren.pdf
 Find a tight asymtotic bound for T(n) given by the following recurren.pdf Find a tight asymtotic bound for T(n) given by the following recurren.pdf
Find a tight asymtotic bound for T(n) given by the following recurren.pdf
 
Find the confidence level related to the critical value z2=1.787. .pdf
 Find the confidence level related to the critical value z2=1.787. .pdf Find the confidence level related to the critical value z2=1.787. .pdf
Find the confidence level related to the critical value z2=1.787. .pdf
 
Find the area of the shaded region. The graph to the right depicts 1Q.pdf
 Find the area of the shaded region. The graph to the right depicts 1Q.pdf Find the area of the shaded region. The graph to the right depicts 1Q.pdf
Find the area of the shaded region. The graph to the right depicts 1Q.pdf
 
Find P(X+Y4). Express final answer as fraction.The joint probabil.pdf
 Find P(X+Y4). Express final answer as fraction.The joint probabil.pdf Find P(X+Y4). Express final answer as fraction.The joint probabil.pdf
Find P(X+Y4). Express final answer as fraction.The joint probabil.pdf
 
Find the domain of f. Use an inequality to write the domain. Select t.pdf
 Find the domain of f. Use an inequality to write the domain. Select t.pdf Find the domain of f. Use an inequality to write the domain. Select t.pdf
Find the domain of f. Use an inequality to write the domain. Select t.pdf
 
Find the area of the shaded region. The graph to the right depicts IQ.pdf
 Find the area of the shaded region. The graph to the right depicts IQ.pdf Find the area of the shaded region. The graph to the right depicts IQ.pdf
Find the area of the shaded region. The graph to the right depicts IQ.pdf
 

Find the area under the standard nomat cune to the left of 2=2.11. Fo.pdf

  • 1. Find the area under the standard nomat cune to the left of 2=2.11. Found your answer to four decimal places, if necessary Miswer to find the appropiage chil in the table and seicet it using the Sgsce kry. begin{tabular}{|c|c|c|c|c|c|c|c|c|c|c|} hline-2.0 & 0.0183 & 0.0188 & 0.0192 & 0.0197 & 0.0202 & 0.0207 & 0.0212 & 0.0217 & 0.0222 & 0.0228 hline-1.9 & 0.0233 & 0.0239 & 0.0244 & 0.0250 & 0.0256 & 0.0262 & 0.0268 & 0.0274 & 0.0281 & 0.0287 hline-1.8 & 0.0294 & 0.0301 & 0.0307 & 0.0314 & 0.0322 & 0.0329 & 0.0336 & 0.0344 & 0.0351 & 0.0359 hline- 1.7 & 0.0367 & 0.0375 & 0.0384 & 0.0392 & 0.0401 & 0.0409 & 0.0418 & 0.0427 & 0.0436 & 0.0446 hline-1.6 & 0.0455 & 0.0465 & 0.0475 & 0.0485 & 0.0495 & 0.0505 & 0.0516 & 0.0526 & 0.0537 & 0.0548 hline-1.5 & 0.0559 & 0.0571 & 0.0582 & 0.0594 & 0.0606 & 0.0618 & 0.0630 & 0.0643 & 0.0655 & 0.0668 hline-1.4 & 0.0681 & 0.0694 & 0.0708 & 0.0721 & 0.0735 & 0.0749 & 0.0764 & 0.0778 & 0.0793 & 0.0808 hline-1.3 & 0.0823 & 0.0838 & 0.0853 & 0.0869 & 0.0885 & 0.0901 & 0.0918 & 0.0934 & 0.0951 & 0.0968 hline- 1.2 & 0.0985 & 0.1003 & 0.1020 & 0.1038 & 0.1056 & 0.1075 & 0.1093 & 0.1112 & 0.1131 & 0.1151 hline 1.1 & 0.1170 & 0.1190 & 0.1210 & 0.1230 & 0.1251 & 0.1271 & 0.1292 & 0.1314 & 0.1335 & 0.1357 hline-1.0 & 0.1379 & 0.1401 & 0.1423 & 0.1446 & 0.1469 & 0.1492 & 0.1515 & 0.1539 & 0.1562 & 0.1587 hline-0.9 & 0.1611 & 0.1635 & 0.1660 & 0.1685 & 0.1711 & 0.1736 & 0.1762 & 0.1788 & 0.1814 & 0.1841 hline-0.8 & 0.1867 & 0.1894 & 0.1922 & 0.1949 & 0.1977 & 0.2005 & 0.2033 & 0.2061 & 0.2090 & 0.2119 hline 0.7 & 0.2148 & 0.2177 & 0.2206 & 0.2236 & 0.2266 & 0.2296 & 0.2327 & 0.2358 & 0.2389 & 0.2420 hline 0.6 & 0.2451 & 0.2483 & 0.2514 & 0.2546 & 0.2578 & 0.2611 & 0.2643 & 0.2676 & 0.2709 & 0.2743 hline 0.5 & 0.2776 & 0.2810 & 0.2843 & 0.2877 & 0.2912 & 0.2946 & 0.2981 & 0.3015 & 0.3050 & 0.3085 hline 0.4 & 0.3121 & 0.3156 & 0.3192 & 0.3228 & 0.3264 & 0.3300 & 0.3336 & 0.3372 & 0.3409 & 0.3446 hline 0.3 & 0.3483 & 0.3520 & 0.3557 & 0.3594 & 0.3632 & 0.3669 & 0.3707 & 0.3745 & 0.3783 & 0.3821 hline 0.2 & 0.3859 & 0.3897 & 0.3936 & 0.3974 & 0.4013 & 0.4052 & 0.4090 & 0.4129 & 0.4168 & 0.4207 hline 0.1 & 0.4247 & 0.4286 & 0.4325 & 0.4364 & 0.4404 & 0.4443 & 0.4483 & 0.4522 & 0.4562 & 0.4602 hline 0.0 & 0.4641 & 0.4681 & 0.4721 & 0.4761 & 0.4801 & 0.4840 & 0.4880 & 0.4920 & 0.4960 & 0.5000 hline end{tabular} begin{tabular}{|c|c|c|c|c|c|c|c|c|c|c|} hline multicolumn{10}{|c|}{ Normal Table - to z } hlinez & 0.00 & 0.01 & 0.02 & 0.03 & 0.04 & 0.05 & 0.06 & 0.07 & 0.08 & 0.09 hline 0.0 & 0.5000 & 0.5040 & 0.5080 & 0.5120 & 0.5160 & 0.5199 & 0.5239 & 0.5279 & 0.5319 &
  • 2. 0.5359 hline 0.1 & 0.5398 & 0.5438 & 0.5478 & 0.5517 & 0.5557 & 0.5596 & 0.5636 & 0.5675 & 0.5714 & 0.5753 hline 0.2 & 0.5793 & 0.5832 & 0.5871 & 0.5910 & 0.5948 & 0.5987 & 0.6026 & 0.6064 & 0.6103 & 0.6141 hline 0.3 & 0.6179 & 0.6217 & 0.6255 & 0.6293 & 0.6331 & 0.6368 & 0.6406 & 0.6443 & 0.6480 & 0.6517 hline 0.4 & 0.6554 & 0.6591 & 0.6628 & 0.6664 & 0.6700 & 0.6736 & 0.6772 & 0.6808 & 0.6844 & 0.6879 hline 0.5 & 0.6915 & 0.6950 & 0.6985 & 0.7019 & 0.7054 & 0.7088 & 0.7123 & 0.7157 & 0.7190 & 0.7224 hline 0.6 & 0.7257 & 0.7291 & 0.7324 & 0.7357 & 0.7389 & 0.7422 & 0.7454 & 0.7486 & 0.7517 & 0.7549 hline 0.7 & 0.7580 & 0.7611 & 0.7642 & 0.7673 & 0.7704 & 0.7734 & 0.7764 & 0.7794 & 0.7823 & 0.7852 hline 0.8 & 0.7881 & 0.7910 & 0.7939 & 0.7967 & 0.7995 & 0.8023 & 0.8051 & 0.8078 & 0.8106 & 0.8133 hline 0.9 & 0.8159 & 0.8186 & 0.8212 & 0.8238 & 0.8264 & 0.8289 & 0.8315 & 0.8340 & 0.8365 & 0.8389 hline 1.0 & 0.8413 & 0.8438 & 0.8461 & 0.8485 & 0.8508 & 0.8531 & 0.8554 & 0.8577 & 0.8599 & 0.8621 hline 1.1 & 0.8643 & 0.8665 & 0.8686 & 0.8708 & 0.8729 & 0.8749 & 0.8770 & 0.8790 & 0.8810 & 0.8830 hline 1.2 & 0.8849 & 0.8869 & 0.8888 & 0.8907 & 0.8925 & 0.8944 & 0.8962 & 0.8980 & 0.8997 & 0.9015 hline 1.3 & 0.9032 & 0.9049 & 0.9066 & 0.9082 & 0.9099 & 0.9115 & 0.9131 & 0.9147 & 0.9162 & 0.9177 hline 1.4 & 0.9192 & 0.9207 & 0.9222 & 0.9236 & 0.9251 & 0.9265 & 0.9279 & 0.9292 & 0.9306 & 0.9319 hline 1.5 & 0.9332 & 0.9345 & 0.9357 & 0.9370 & 0.9382 & 0.9394 & 0.9406 & 0.9418 & 0.9429 & 0.9441 hline 1.6 & 0.9452 & 0.9463 & 0.9474 & 0.9484 & 0.9495 & 0.9505 & 0.9515 & 0.9525 & 0.9535 & 0.9545 hline 1.7 & 0.9554 & 0.9564 & 0.9573 & 0.9582 & 0.9591 & 0.9599 & 0.9608 & 0.9616 & 0.9625 & 0.9633 hline 1.8 & 0.9641 & 0.9649 & 0.9656 & 0.9664 & 0.9671 & 0.9678 & 0.9686 & 0.9693 & 0.9699 & 0.9706 hline 1.9 & 0.9713 & 0.9719 & 0.9726 & 0.9732 & 0.9738 & 0.9744 & 0.9750 & 0.9756 & 0.9761 & 0.9767 hline 2.0 & 0.9772 & 0.9778 & 0.9783 & 0.9788 & 0.9793 & 0.9798 & 0.9803 & 0.9808 & 0.9812 & 0.9817 hline end{tabular}