Call Girls Kengeri Satellite Town Just Call 👗 7737669865 👗 Top Class Call Gir...
one slide.pptx
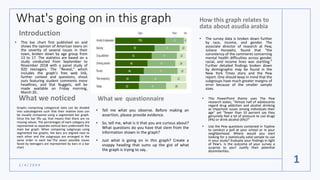
1. What's going on in this graph
Introduction
• This bar chart first published on and
shows the opinion of American teens on
the severity of several issues in their
town, broken down by age group from
13 to 17. The statistics are based on a
study conducted from September to
November 2018 with a panel study of
920 teenagers. The "Reveal," which
includes the graph's free web link,
further context and questions, shout
outs featuring student comments more
headlines, and Stat Nuggets, will be
made available on Friday morning,
March 20..
What we questionnaire
• Tell me what you observe. Before making an
assertion, please provide evidence.
• So, tell me, what is it that you are curious about?
What questions do you have that stem from the
information shown in the graph?
• Just what is going on in this graph? Create a
snappy heading that sums up the gist of what
the graph is trying to say..
How this graph relates to
data about asudia arabia
• The survey data is broken down further
by race, income, and gender. The
associate director of research at Pew,
Juliana Horowitz, found that "the
consistency of the comments concerning
mental health difficulties across gender,
racial, and income lines was startling."
Further detailed findings broken down
by demographic may be found in the
New York Times story and the Pew
report. One should keep in mind that the
subgroups have much greater margins of
error because of the smaller sample
sizes.
2 / 4 / 2 0 X X
1
What we noticed
Graphs comprising categorical data can be divided
into subcategories such that their relative sizes can
be visually compared using a segmented bar graph.
Once the bar fills up, that means that there are no
missing values. The percentages of each category are
represented as separate vertical bars underneath the
main bar graph. When comparing subgroups using
segmented bar graphs, the bars are aligned next to
each other and the subgroups are arranged in the
same order in each bar.The seven possible issues
faced by teenagers are represented by bars in a bar
chart
• This PowerPoint theme uses The Pew
research states, "Almost half of adolescents
regard drug addiction and alcohol drinking
as important issues among individuals their
age" yet "fewer than 10 percent say they
genuinely feel a lot of pressure to use drugs
(4%) or drink alcohol (6%)?"
• Use the Pew questions contained in Topline
to conduct a poll at your school or in your
neighborhood. Where would you start
looking for a statistically valid sample to use
in your study? Evaluate your findings in light
of Pew's. Is the outcome of your survey a
surprise to you? Justify their potential
dissimilarities.