Excel Power Pivot & Power View Dashboards & Advanced Business Intelligence Tools Excel 2013 / 2016 Training Workshop by Skillstimes
•
2 recomendaciones•961 vistas

Excel Power Pivot & Power View Dashboards & Advanced Business Intelligence Tools Excel 2013 / 2016 Training Workshop by Skillstimes

Recomendados
Recomendados
Más contenido relacionado
Destacado
Destacado (17)
Más de Ahmed Yasir Khan
Más de Ahmed Yasir Khan (20)
Último
Último (20)
Excel Power Pivot & Power View Dashboards & Advanced Business Intelligence Tools Excel 2013 / 2016 Training Workshop by Skillstimes
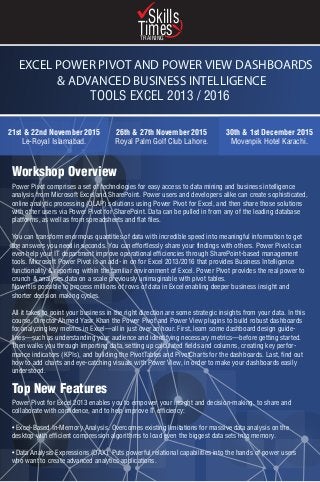
- 1. EXCEL POWER PIVOT AND POWER VIEW DASHBOARDS & ADVANCED BUSINESS INTELLIGENCE TOOLS EXCEL 2013 / 2016 21st & 22nd November 2015 Le-Royal Islamabad. 30th & 1st December 2015 Movenpik Hotel Karachi. 26th & 27th November 2015 Royal Palm Golf Club Lahore. Power Pivot comprises a set of technologies for easy access to data mining and business intelligence analysis from Microsoft Excel and SharePoint. Power users and developers alike can create sophisticated, online analytic processing (OLAP) solutions using Power Pivot for Excel, and then share those solutions with other users via Power Pivot for SharePoint. Data can be pulled in from any of the leading database platforms, as well as from spreadsheets and flat files. You can transform enormous quantities of data with incredible speed into meaningful information to get the answers you need in seconds. You can effortlessly share your findings with others. Power Pivot can even help your IT department improve operational efficiencies through SharePoint-based management tools. Microsoft Power Pivot is an add- in on for Excel 2013/2016 that provides Business Intelligence functionality & reporting within the familiar environment of Excel. Power Pivot provides the real power to crunch & analyses data on a scale previously unimaginable with pivot tables. Now it is possible to process millions of rows of data in Excel enabling deeper business insight and shorter decision making cycles. All it takes to point your business in the right direction are some strategic insights from your data. In this course, Director Ahmed Yasir Khan the Power Pivot and Power View plugins to build robust dashboards for analyzing key metrics in Excel—all in just over an hour. First, learn some dashboard design guide- lines—such as understanding your audience and identifying necessary metrics—before getting started. Then walks you through importing data, setting up calculated fields and columns, creating key perfor- mance indicators (KPIs), and building the PivotTables and PivotCharts for the dashboards. Last, find out how to add charts and eye-catching visuals with Power View, in order to make your dashboards easily understood. Power Pivot for Excel 2013 enables you to empower your insight and decision-making, to share and collaborate with confidence, and to help improve IT efficiency: • Excel-Based In-Memory Analysis. Overcomes existing limitations for massive data analysis on the desktop with efficient compression algorithms to load even the biggest data sets into memory. • Data Analysis Expressions (DAX). Puts powerful relational capabilities into the hands of power users who want to create advanced analytics applications. Workshop Overview Top New Features Skills TimesTRAINING
- 2. • SharePoint Integration. Enables users to share data models and analysis, and because the solutions are in SharePoint, you can configure refresh cycles to ensure the data remains current automatically. Virtually Unlimited Support of Data Sources. Provides the foun- dation to load and combine Source data from any location for massive data analysis on the desktop, including relational Databases, multidimensional sources, cloud services, data feeds, Excel files, text files, and Data from the Web. Power Pivot Management Dashboard. Enables IT administrators to monitor and manage your Shared applications to ensure security, high availability, and performance Who Should Attend: After Course Completion: Students IT Professional Business Analyst Project Managers MIS Data Analyst IT Administrator At the end of this 2 day course delegates will be able using Power Pivot. The course will show delegates how to leverage their existing PivotTable knowledge in Excel with Power Pivot. Enable delegates to better understand how Power Pivot might be applied back in their workplace. Become familiar with the Power Pivot application and import data. - Manipulate data in a Power Pivot worksheet. - Create reports using Power Pivot data. - Use DAX functions in Power Pivot. - Distribute Power Pivot Data. Integrate data from a multitude of sources, including corporate databases, spreadsheets, reports, text files, and Internet data feeds. Go beyond standard Excel Expressions capabilities and use Data Analysis Expressions (DAX) to perform powerful data manipulations. Follow relationships between tables as in a database, define calcu- lated columns and measures, and aggregate over billions of rows. Publish data models and workbook applications to SharePoint to make them available to others virtually anytime and from any location. Access your workbook applications directly in the browser without having to download the work- books with all their data to every workstation. Automatically refresh reports to include up-to-date data from multiple sources. Balance the need for self-service BI and IT oversight in a managed self-service BI offering that empowers your users through familiar Office applications and your IT administrators through efficient management tools. Who Should Attend: After Course Completion: Students IT Professional Business Analyst Project Managers MIS Data Analyst IT Administrator At the end of this 2 day course delegates will be able using Power Pivot. The course will show delegates how to leverage their existing PivotTable knowledge in Excel with Power Pivot. Enable delegates to better understand how Power Pivot might be applied back in their workplace. Become familiar with the Power Pivot application and import data. - Manipulate data in a Power Pivot worksheet. - Create reports using Power Pivot data. - Use DAX functions in Power Pivot. - Distribute Power Pivot Data. Integrate data from a multitude of sources, including corporate databases, spreadsheets, reports, text files, and Internet data feeds. Go beyond standard Excel Expressions capabilities and use Data Analysis Expressions (DAX) to perform powerful data manipulations. Follow relationships between tables as in a database, define calcu- lated columns and measures, and aggregate over billions of rows. Publish data models and workbook applications to SharePoint to make them available to others virtually anytime and from any location. Access your workbook applications directly in the browser without having to download the work- books with all their data to every workstation. Automatically refresh reports to include up-to-date data from multiple sources. Balance the need for self-service BI and IT oversight in a managed self-service BI offering that empowers your users through familiar Office applications and your IT administrators through efficient management tools. Spvark Lines Tiny Charts DAX Analysis Time Intelligence Functions Dynamic Charts and Graphs Financial Dashboards Sales Analysis HR Dashboards Power Pivot Predictive Analysis Data Mining Business Intelligence Dashboard Reporting
- 3. Module 1: Business Intelligence What is BI? Microsoft Vision for BI and self Service BI. Power Pivot BISM Model BI Stack Module 2: Planning for a Business Intelligence BI Communities The Business intelligence Maturity Model Tool Selection Module 3: Sourcing & Enhancing the Data Model Dashboard design guidelines Importing data Relating data Creating calculated fields and columns Creating KPIs Adding a linked table to the data model Creating PivotTables and PivotCharts Adding Power View visualizations Formatting with color Module 4: using Power Pivot Excel 2013 The Data Model Creating Relation Ship by using Data Model Power Pivot 2013 Calculations With DAX Module 5: Using Power View in Excel 2013 What’s New in Power View KPI More Visualizations New drill functionality Setting up Power View Creating table Creating a Started Creating a Matrix Creating a chart Creating a Map Creating cards Creating KPI Filtering Data Module 6: Creating Self-Service Bi Applications Using Power Pivot. Assembling Data. Relational Databases Multi-Dimensional Data Sources Text Files Pasting From the Clipboard Linked Excel Tables Importing the Main Data Table Importing the Related Tables Adding Data from Other Sources Power Query Power Map Module 7: Enriching Data. Exploring the Power Pivot Window Data Refresh Formatting Data Column Operations Relationships Data Analysis Expressions (DAX) Managing Connections Update Import Definition Establishing Relationships Defining DAX Calculations Module 8: Self-services Analysis PivotTables and Pivot Charts The New Power Pivot Data Model Automatic Relationship Detection Metadata Refresh Slicers Excel Slicers Power Pivot-Enhanced Slicers TimeLine DAX Measures Power Pivot and Other Excel Features Cube Formulas Named Sets Module 9: Advanced DAX Data Analysis Expressions (DAX) – The Basics DAX Calculations - Calculated Columns and Measures DAX Syntax DAX uses Power Pivot data types DAX Operators and Constants Simple DAX Function Functions to aggregate expressions – the “X” functions COUNTROWS (Table) RELATED (Column) and RELATEDTABLE (Table) FILTER(Table, Condition) and DISTINCT (Column) Row Context and Filter Context More DAX Functions Time Intelligence Functions Calculated Columns Measures Course Contents:
- 4. Ahmed Yasir Khan Course Facilitator Ahmed Yasir Khan is a qualified MBA (MIS) and has possesses 20 years of diversified industry exposure in the field of finance & IT. Currently he is working as Manager e-support in FBR. He is a member of Trainer FBR Trained Professional Govt. sector as well as Private organization. He has conducting in-house training also Public workshop and seminar. He is member of Pakistan Institute of Management, and also an approved trainer of National Productivity Organization (NPO), Government of Pakistan. He has special- ty in Import, Export, Supply Chain, E-Filling (IGM, Import, Export, Sales Tax Return), e-Support, Income Tax, Sales tax, Customs, ERP’s & Database (SAPR3, SAP B1 ,Microsoft Dynamics AX, Oracle e-business suite R12 ,Oracle11g, Tally ERP, Quick book2012, Peachtree2010, Advanced Excel2010/2013, Access 2010/13, SQL SERVER2008R2/2012).Microsoft office Application Specialist, SharePoint 2010,CBAP,P- MP,ITILV3,Corporate Finance, Analysis of Financial Statement, Strategic in Financial Management , Excel Dashboard Reporting, KPI, Financial Planning & Budgeting, Excel VBA Programming, Financial Modeling, Process Modeling, Workflow, computerized Accounting, Software Project Management, ERP Implement- er, PMO, IT Audit, & SQA. As part from diversified development assignment. He has been actively involved in training and teaching Professional with many Institutions as visiting faculty member, and taught thousands of Professionals. He is a trainer of repute for his unique training style which enables maximum learning & retention in least possible time. He trained large number of employees of prestigious organizations such as MAERSK, PAF, SSGC, KESC, BP Pakistan, HUBCO, BOC Pakistan, WAPDA, State Bank of Pakistan, University of Karachi, IBA, NUST, Hamdard University, Pakistan Tobacco Company, Makro, PEMRA, Philips Pakistan, Mitsubishi Corpora- tion, TRG, State Life Insurance, NAFA Fund, Arif Habib Ltd., MCB Bank Ltd, IGI Investment Bank, Dubai Islamic Bank, First Women Bank, Fatima Group, Shield Corporation, Zafa Pharmaceutical, Askari Cement Ltd, Master Group, PTCL, UNDP,ITL,PARCO, Silk Bank, Services , Hilton Pharma , Bosch , Atlas Honda , Metro , HBL , Agri Auto , International Textile Mills LTD , ENGRO , BYCO, MCB, Agha Khan , NBP , JS BANK, Karachi stock exchange , Abott , DP World Karachi, Geo, SHVERION, Glaxo Smith, Punjab TV, TAPAL,BOP, HSBC, Dalda foods etc. 28,500/-28,500/- Exclusive of GST Workshop Investment 0345-2694109 - 0300-8261193 021-36066977 0345-2694109 - 0300-8261193 021-36066977 Shahid Rehman register@skillstimes.com shahid@skillstimes.com register@skillstimes.com shahid@skillstimes.com For Registration & Details: