SlideShare una empresa de Scribd logo
1 de 15
Descargar para leer sin conexión
Consolidated Financial Results for the Second quarter Ended June 30, 2012
                                                                  (Under Japanese GAAP)
                                                                                                                                                                                                                             August 9, 2012

Company name:                                                                NEXON Co., Ltd.
Stock exchange listing:                                                      Tokyo Stock Exchange
Stock code:                                                                          3659
URL:                                                                         http://www.nexon.co.jp/
Representative:                                                              Seung Woo Choi, President and Chief Executive Officer
Contact:                                                                     Owen Mahoney, Chief Financial Officer and Chief Administrative Officer                              TEL: +81-3-3523-7910
Scheduled date for filing of Quarterly Report:                               August 10, 2012
Scheduled date of dividend payment commencement:                             -
Supplementary documents for quarterly results:                               Yes
Quarterly results briefing:                                                  Yes (for institutional investors and analysts)

                                                                                                                                                         (Amounts of less than one million yen are rounded down to the nearest million yen)
1. Consolidated performance results for the six months ended June 30, 2012 (From January 1, 2012 to June 30, 2012)
(1) Consolidated results of operations (Accumulated total)                                                                                                                                                 (% shows year-on-year changes)
                                                                  Net sales                                  Operating income                                  Ordinary income                           Quarterly net income
Six months ended                                              Million yen                     %           Million yen                         %           Million yen                        %        Million yen                        %
  June 30, 2012                                                    53,253                      -               28,063                          -               27,045                         -            19,146                         -
  June 30, 2011                                                         -                      -                    -                          -                    -                         -                 -                         -
(Note) Comprehensive income                    Six months ended June 30, 2012:                23,501 million yen (-)                               Six months ended June 30, 2011:                      - million yen (-%)


                                                                                            Diluted quarterly net income
                                                   Quarterly net income per share
                                                                                                     per share
Six months ended                                                                     Yen                              Yen
  June 30, 2012                                                                    44.41                            43.12
  June 30, 2011                                                                         -                                -
(Note) As the Company prepared quarterly consolidated financial statements for the first time for the nine-month period ended September 30, 2011, the figures for the six months ended June 30, 2011 and year-on-year changes
are omitted.


(2) Consolidated financial position
                                                                   Total assets                                        Net assets                                 Equity ratio
                                                                                         Million yen                                 Million yen                                           %
  June 30, 2012                                                                             295,793                                     202,656                                         67.3
  December 31, 2011                                                                         235,765                                     177,886                                         73.8
(Reference) Shareholders' equity                           June 30, 2012:                    198,931 Million yen                        December 31, 2011:                            173,979 Million yen

2. Dividends
                                                                                           Annual dividends per share
                                                       End of Q1                    End of Q2            End of Q3           Year-end               Total
Years ended                                                          Yen                      Yen                   Yen                Yen                   Yen
 December 31, 2011                                                     ―                      0.00                    ―                0.00                  0.00
 December 31, 2012                                                     ―                      0.00
 December 31, 2012 (forecast)                                                                                         ―                  ―                     ―
(Note) Revisions to dividend forecast since the latest announcement: None
(Note) The Company's articles incorporation sets forth June 30 and December 31 as the record date, but the amount of forecasted dividends as of these dates is undetermined at this point.

3. Consolidated Forecast for the Fiscal Year Ending December 31, 2012 (From January 1, 2012 to December 31, 2012)
                                                                                                                                      (Percentage figures for the fiscal year represent the changes from the previous year)
                                                              Net sales                          Operating income                   Ordinary income                      Net income               Net income per share
                                                               Million yen            %            Million yen           %           Million yen          %         Million yen             %                          yen
Year ending December 31, 2012                                      104,334          19.1                   47,082      23.1               46,043       24.8               32,737          27.1                       75.88
(Note) Revisions to consolidated forecast since the latest announcement: Yes

4. Other
(1) Changes in material subsidiaries during the current quarter: None
(Note) Changes in the status of specific subsidiaries resulting in changes in the scope of consolidation

(2) Application of specific accounting treatments in preparing quarterly consolidated financial statements: Yes

(3) Changes in accounting policies and estimates and restatements
  (i) Changes in accounting policies due to amendment of accounting standards, etc.: Yes
  (ii) Changes in accounting policies due to reasons other than (i): None
  (iii) Changes in accounting estimates: None
  (iv) Restatements: None

(4) Number of shares issued and outstanding (common stock)
  (i) Number of shares issued and outstanding at end of period (including treasury stock)
          As of June 30, 2012:                             433,685,900 shares
          As of December 31, 2011:                         426,132,900 shares
  (ii) Number of treasury shares at end of period
          As of June 30, 2012:                                        ― shares
          As of December 31, 2011:                                    ― shares
  (iii) Average number of shares during the period (accumulated)
          As of June 30, 2012:                             431,084,043 shares
          As of December 31, 2011:                                    ― shares
(Note) As the Company prepared quarterly consolidated financial statements for the first time for the nine-month period ended September 30, 2011, the average number of shares during the period for the six months ended June
30, 2012 are omitted.
*Status of quarterly review procedures
The consolidated financial results for the second quarter ended June 30, 2012 ("quarterly financial results") is not subject to a quarterly review under the Financial Instruments and Exchange Act. Accordingly, the review
procedures for the quarterly consolidated financial statements are not completed at the time of announcement of the quarterly financial results.

*Explanation and other special notes concerning the appropriate use of the performance results forecasts
(Notes on forward-looking statements)
The forward-looking statements such as performance results forecasts included in this document are based on the information available to the Company at the time of announcement and on certain assumptions considered
reasonable. Actual results may differ significantly due to various factors.

(Supplementary documents for quarterly results)
Supplementary documents for quarterly results are available at our IR website.
Consolidated Forecast for the three months ending September 30, 2012 (From July 1, 2012 to September 30, 2012)

                                                                                                 (Percentages figures for the three months period represent the changes from the same period of the previous year)
                                                            Net sales                        Operating income                 Ordinary income                    Net income              Net income per share
                                                             Million yen            %          Million yen        %            Million yen         %         Million yen            %                         yen
Three months ending September 30, 2012                               24,943        3.3               9,249     -15.5                 9,191       -9.6              6,598          -8.8                      15.24
Besides the consolidated performance forecasts for the Year ending December 31, 2012, the Company also announces the forecast for the next quarter, in this case, the third quarter ending September 30, 2012.
In addition, when the Company calculates the revised performance forecast that operating income, ordinary income, net income to be deviated more than 30% from the latest released forecast,
or revenue to be deviated 10% from the latest released forecast, the Company will release the announcement of updated performance forecast.
○Index of Attachment


  1. Qualitative information on consolidated performance results for the quarter ended June 30, 2012…………………………            1
    (1) Qualitative information on consolidated results of operations……………………………………………………………                              1
    (2) Qualitative information on consolidated financial position………………………………………………………………                                1
    (3) Qualitative information on consolidated performance results forecast………………….…………………………….…                         2
  2. Other information ……………………………………………………………………………………………………………                                                          2
    (1) Changes in material subsidiaries during the six months ended June 30, 2012……………………………………………                       2
    (2) Application of specific accounting treatments in preparing the quarterly consolidated financial statements……………   2
    (3) Changes in accounting policies and estimates, and restatements ……….………………………………………………                             3
  3. Quarterly consolidated financial statements.………………………………..………………………………………………                                         4
    (1) Quarterly consolidated balance sheet...…………………………………….……………………………………………                                           4
    (2) Quarterly consolidated statements of (comprehensive) income…………………………………………………………                                 5
           Quarterly consolidated statement of income
             For the six months ended June 30, 2012……………………………………………………………………………                                          5
           Quarterly consolidated statement of comprehensive income
             For the six months ended June 30, 2012……………………………………………………………………………                                          6
    (3) Quarterly consolidated statements of cash flows…………………………………………………………………………                                       7
    (4) Notes related to going concern assumption………………………………………………………………………………                                           8
    (5) Segment information…. …………………………………………………………………………………………………                                                       8
    (6) Notes on significant changes in Shareholders’ equity, if any……………………………………………………………                               9
    (7) Significant subsequent events……………………………………………………………………………………………                                                  9
1. Qualitative information on consolidated performance results for the quarter ended June 30, 2012
  (1) Qualitative information on consolidated results of operations
      During the six months ended June 30, 2012, the world economy showed a moderate recovery, but the outlook is uncertain
      because of the prolonged financial crisis in Europe, delay in economic recovery in developed countries and slowdown in
      emerging economies’ growth. In Asia, the economic growth is slowing down due to the economic slowdown in Europe and the
      US and sluggish domestic demand.
      In Japan, however, despite concerns over the decline in overseas economies, production activities and individual consumption
      seem to be improving due primarily to reconstruction demands, and the Japanese economy is gradually recovering.
      In such environment, the Group is engaged in primarily online game business, as well as mobile game business and other
      businesses, and has been striving to provide wide range of customers with high quality services and to build or acquire excellent
      contents to accommodate diversifying needs of users through updating existing game titles and distributing new game titles.
      As a result of our efforts, we recorded net sales of ¥53,253 million, operating income of ¥28,063 million, ordinary income of
      ¥27,045 million and net income of ¥19,146 million for the six months ended June 30, 2012.
      Performance results by reportable segments are as follows:
      (a) Japan
      In Japan, while sales from game titles such as “Tales Weaver,” “Counter-Strike Online,” and “Sudden Attack” continued to
      show steady growth, sales from some of the other titles decreased. As a result, net sales amounted to ¥5,917 million and segment
      income amounted to ¥455 million.
      (b) Korea
      In Korea, steady growth of sales from “Sudden Attack” and an increase in royalty income due to significant increase in sales
      from “Dungeon&Fighter” in China contributed to net sales of ¥41,879 million and segment income of ¥26,264 million.
      (c) China
      In China, an increase in consulting income as a result of growth of the online game market in China contributed to net sales of
      ¥2,002 million and segment income of ¥1,360 million.
      (d) North America
      In North America, the delay in update as a consequence of the hacking attempt to “Maple Story” at the end of the previous
      consolidated fiscal year resulted in net sales of ¥2,496 million and segment loss of ¥244 million.
      (e) Other
      In other areas, sales slightly decreased on a year-on-year basis, and the impact of foreign exchange rates resulted in net sales of
      ¥958 million and segment income of ¥246 million.


  (2) Qualitative information on consolidated financial position
      (a) Cash flows
      Cash and cash equivalent (“cash”) at June 30, 2012 was ¥105,940 million.
      Cash flows from each activity for the six months ended June 30, 2012 and their major components are as follows:
      (Cash flows from operating activities)
      Net cash provided by operating activities amounted to ¥23,450 million. Major components included Income before income taxes
      and minority interests of ¥25,737 million, Depreciation and amortization of ¥4,810 million, and Income taxes paid of ¥9,232
      million.
      (Cash flows from investing activities)
      Net cash used in investing activities amounted to ¥73,131 million. Major components included an Increase in time deposits of
      ¥10,020 million, Purchase of stocks of subsidiaries and affiliates of ¥4,482 million, and Purchase of investment securities of
      ¥56,440 million.
      (Cash flows from financing activities)
      Net cash provided by financing activities amounted to ¥37,551 million. Major components included Proceeds from short-term
      loans payable of ¥53,125 million and Repayment of long-term loans payable of ¥17,043 million.


     (b) Analysis of financial position
     (Assets)
     Total assets as of June 30, 2012 totaled ¥295,793 million, an increase of ¥60,027 million from December 31, 2011.
     Current assets as of June 30, 2012 amounted to ¥146,297 million, a decrease of ¥4,424 million mainly due to a decrease of Cash
     and deposits of ¥3,389 million from December 31, 2011.


                                                                  -1-
Noncurrent assets as of June 30, 2012 amounted to ¥149,495 million, an increase of ¥64,452 million due to an increase of
     Investment securities by ¥64,176 million from December 31, 2011.
     (Liabilities)
     Total liabilities amounted to ¥93,136 million, an increase of ¥35,257 million compared to the balance at December 31, 2011.
     Current liabilities at June 30, 2012 totaled ¥72,653 million, an increase of ¥48,091 million from December 31, 2011. This is
     mainly due to an increase of Short-term loans payable of ¥53,095 million, and a decrease of Current portion of Long-term loans
     payable of ¥2,828 million.
     Noncurrent liabilities totaled ¥20,483 million, a decrease of ¥12,833 million from December 31, 2011 due to a decrease of
     Long-term loans payable of ¥13,767 million.
     (Net assets)
     Net assets as of June 30, 2012 totaled ¥202,656 million, an increase of ¥24,769 million from December 31, 2011, mainly due to
     an increase of Retained earnings from recording Net income for the quarter of ¥19,146 million and an increase of Valuation
     difference on available-for-sale securities of ¥3,073 million.


  (3) Qualitative information on consolidated performance results forecast
      We revised our sales revenue for the third quarter and thereafter considering our current situation and actual business
      performance. Revision to consolidated full year business outlook for the fiscal year ending December 31, 2012 is as follows:
      The following business outlook is based on information available at the time the assumption was made, and is subject to various
      risks that could cause actual results to differ from expectations.


     Revisions to consolidated forecast figures for the full fiscal year ending December 31, 2012 are as follows:
                                                                                                             (Units: millions of yen, %)
                                                           Operating                                                   Net Income per
                                      Revenues                              Ordinary Income         Net Income
                                                            Income                                                          share
     Previous forecast (A)                  108,338               52,234               53,011               37,800                87.88
     Revised forecast (B)                   104,334               47,082               46,043               32,737                75.88
     Difference (B-A)                        (4,004)              (5,151)              (6,967)              (5,062)                  ―
     Percentage change (%)                     (3.7)                (9.9)               (13.1)               (13.4)                  ―
     (Reference) Year ended
                                             87,613               38,249               36,905               25,755                71.65
     December 31, 2011


2. Other information
  (1) Changes in material subsidiaries during the six months ended June 30, 2012
     Not applicable.


  (2) Application of specific accounting treatments in preparing the quarterly consolidated financial statements
     Tax expenses are calculated as income before income taxes and minority interests for the quarter multiplied by the estimated
     effective tax rate. The effective tax rate is reasonably estimated taking into consideration deferred tax accounting as the rate
     applicable to income before income taxes and minority interests for the consolidated fiscal year including the quarter ended June
     30, 2012.
     Certain consolidated subsidiaries account for income taxes for the six months ended June 30, 2012 on a basis consistent with the
     accounting for income taxes for the fiscal year.


                                                                 -2-
(3) Changes in accounting policies and estimates, and restatements
(Adoption of Accounting Standard for Net Income per Share, etc.)
   Effective January, 1, 2012, the Company adopted Accounting Standards Board of Japan (“ASBJ”) Statement No.2, “Accounting
   Standard for Net Income per Share”, issued on June 30, 2010 and ASBJ Guidance No.4 (revised 2006), “Guidance on
   Accounting Standard for Net Income per Share” issued on June 30, 2010.
   The Company has changed the method to calculate quarterly diluted net income per share as follows. For stock options that vest
   after a specified service period, the fair value of service expected to be provided to the Company in the future is included in the
   cash proceeds assumed to be received upon exercise of the stock options.


                                                               -3-
3. Quarterly consolidated financial statements
  (1) Quarterly consolidated balance sheet
                                                                                            (Millions of yen)

                                                                        December 31, 2011      June 30, 2012
   Assets
      Current assets
          Cash and deposits                                                      132,479            129,089
          Notes and accounts receivable-trade                                     13,845             12,588
          Short-term investment securities                                            12                  95
          Merchandise                                                                 40                  49
          Other                                                                    4,367              4,482
          Allowance for doubtful accounts                                           (22)                 (8)
          Total current assets                                                   150,722            146,297
      Noncurrent assets
          Property, plant and equipment                                            16,016             17,781
          Intangible assets
               Games Copyright                                                     31,163             28,479
               Goodwill                                                            11,595             12,538
               Other                                                                1,315              1,396
               Total intangible assets                                             44,074             42,413
          Investments and other assets
               Investment securities                                               17,002             81,178
               Other                                                               10,766             10,840
               Allowance for doubtful accounts                                    (2,815)            (2,717)
               Total investments and other assets                                  24,952             89,300
          Total noncurrent assets                                                  85,043           149,495
      Total assets                                                               235,765            295,793
   Liabilities
      Current liabilities
          Notes and accounts payable-trade                                            981                934
          Short-term loans payable                                                     -              53,095
          Current portion of long-term loans payable                                2,994                166
          Income taxes payable                                                      6,671              4,839
          Unearned revenue                                                          8,111              7,896
          Provision for bonuses                                                     1,082                712
          Asset retirement obligations - current                                       47                 17
          Other                                                                     4,672              4,990
          Total current liabilities                                                24,562             72,653
      Noncurrent liabilities
          Long-term loans payable                                                  18,567              4,800
          Long-term unearned revenue                                                5,707              5,038
          Provision for retirement benefits                                           203                179
          Negative goodwill                                                         3,553              3,169
          Asset retirement obligations - noncurrent                                   117                146
          Other                                                                     5,167              7,149
          Total noncurrent liabilities                                             33,316             20,483
      Total liabilities                                                            57,878             93,136
   Net assets
      Shareholders' equity
          Capital stock                                                           50,300             51,054
          Capital surplus                                                         50,162             50,914
          Retained earnings                                                       90,757            109,903
          Total shareholders' equity                                             191,219            211,873
      Accumulated other comprehensive income
          Valuation difference on available-for-sale securities                       471              3,545
          Foreign currency translation adjustment                                (17,711)           (16,487)
          Total accumulated other comprehensive income                           (17,239)           (12,941)
      Subscription rights to shares                                                   455                354
      Minority interests                                                            3,451              3,370
      Total net assets                                                           177,886            202,656
   Total liabilities and net assets                                              235,765            295,793


                                                                  -4-
(2) Quarterly consolidated statements of (comprehensive) income
       (Quarterly consolidated statement of income)
       (For the six months ended June 30, 2012)
                                                                      (Millions of yen)
                                                                     Six months ended
                                                                         June 30, 2012
Net sales                                                                       53,253
Cost of sales                                                                    8,223
Gross profit                                                                    45,030
Selling, general and administrative expenses                                    16,966
Operating income                                                                28,063
Non-operating income
    Interest income                                                                721
    Amortization of negative goodwill                                              460
    Miscellaneous income                                                           311
    Total non-operating income                                                   1,493
Non-operating expenses
    Interest expenses                                                              255
    Foreign exchange losses                                                        277
    Equity in losses of affiliates                                               1,833
    Miscellaneous expenses                                                         143
    Total non-operating expenses                                                 2,510
Ordinary income                                                                 27,045
Extraordinary income
    Gain on sales of noncurrent assets                                               3
    Gain on change in equity                                                        92
    Total extraordinary income                                                      96
Extraordinary loss
    Loss on sales and retirement of noncurrent assets                               40
    Impairment loss                                                              1,354
    Loss on change in equity                                                         9
    Total extraordinary losses                                                   1,404
Income before income taxes and minority interests                               25,737
Income taxes                                                                     6,534
Income before minority interests                                                19,203
Minority interests in income                                                        57
Net income                                                                      19,146


                                                               -5-
(Quarterly consolidated statement of comprehensive income)
       (For the six months ended June 30, 2012)
                                                                            (Millions of yen)
                                                                           Six months ended
                                                                               June 30, 2012
Income before minority interests                                                      19,203
Other comprehensive income
   Valuation difference on available-for-sale securities                               3,073
   Foreign currency translation adjustment                                             1,038
   Share of other comprehensive income of associates accounted for using
                                                                                         185
   equity method
   Total other comprehensive income                                                    4,297
Comprehensive income                                                                  23,501
(Comprehensive income attributable to)
   Comprehensive income attributable to owners of the parent                          23,444
   Comprehensive income attributable to minority interests                                56


                                                               -6-
(3) Quarterly consolidated statements of cash flows
     (For the six months ended June 30, 2012)
                                                                     (Millions of yen)
                                                                     Six months ended
                                                                         June 30, 2012
Operating activities
    Income before income taxes and minority interests                           25,737
    Depreciation and amortization                                                4,810
    Amortization of goodwill                                                     1,200
    Amortization of negative goodwill                                            (460)
    Decrease in allowance for doubtful accounts                                  (169)
    Decrease in provision for bonuses                                            (391)
    Decrease in provision for retirement benefits                                 (28)
    Interest and dividends income                                                (747)
    Interest expenses                                                              255
    Foreign exchange losses                                                        228
    Impairment loss                                                              1,354
    Equity in losses of affiliates                                               1,833
    Decrease in notes and accounts receivable-trade                              1,669
    Increase in other current assets                                           (1,764)
    Decrease in notes and accounts payable-trade                                  (63)
    Decrease in unearned revenue                                               (1,089)
    Decrease in other current liabilities                                        (253)
    Other, net                                                                      36
        Subtotal                                                                32,159
    Interest and dividends income received                                         787
    Interest expenses paid                                                       (263)
    Income taxes paid                                                          (9,232)
    Net cash provided by operating activities                                   23,450
Investing activities
    Increase in time deposits                                                (10,020)
    Increase in short-term investment securities                                 (83)
    Purchase of property, plant and equipment                                 (1,473)
    Proceeds from sales of property, plant and equipment                           43
    Purchase of intangible assets                                               (425)
    Payments for long-term prepaid expenses with increase                       (246)
    Payments of short-term loans receivable                                     (110)
    Collection of short-term loans receivable                                   1,908
    Collection of long-term loans receivable                                        4
    Purchase of investment securities                                        (56,440)
    Proceeds from sales of investment securities                                  389
    Purchase of investments in subsidiaries                                     (559)
    Purchase of stocks of subsidiaries and affiliates                         (4,482)
    Purchase of investments in subsidiaries resulting in change in
                                                                               (1,231)
    scope of consolidation
    Payments for transfer of business                                         (1,750)
    Payments for deposit pledged as collateral                               (14,032)
    Proceeds from deposit released from collateral                             15,043
    Other, net                                                                    335
    Net cash used in investing activities                                    (73,131)
Financing activities
    Increase in short-term loans payable                                       53,125
    Proceeds from long-term loans payable                                         327
    Repayment of long-term loans payable                                     (17,043)
    Repayments of finance lease obligations                                     (276)
    Proceeds from exercise of stock option                                      1,416
    Other, net                                                                      1
    Net cash provided by financing activities                                  37,551
Effect of exchange rate change on cash and cash equivalents                       471
Net decrease in cash and cash equivalents                                    (11,658)
Cash and cash equivalents at beginning of period                             117,598
Cash and cash equivalents at end of period                                   105,940


                                                           -7-
(4)Notes related to going concern assumption
   Not applicable.


(5) Segment information
        (Segment information)
        For the six months ended June 30, 2012 (From January 1, 2012 to June 30, 2012)
        1. Net sales and net income or loss by reportable segments
                                                                                                                (Millions of yen)
                                                                                                                       Quarterly
                                                   Reportable segments
                                                                                                                      consolidate
                                                                                             Other       Adjustments
                                                                                                                       statement
                                                                     North                  (Note 1)      (Note 2)
                                  Japan        Korea      China                   Total                                of income
                                                                    America                                             (Note 3)

         Net sales
         Sales to third party
              customers             5,917       41,879      2,002        2,496    52,295         958              -       53,253
         Intersegment sales or
              transfer between            -      2,337         -           56      2,393             -        (2,393)            -
              segments
                 Total              5,917       44,216      2,002        2,552    54,688         958          (2,393)     53,253

         Segment income               455       26,264      1,360        (244)    27,836         246            (19)      28,063
       (Notes) 1. “Other” includes geographical segments not included in any of the reportable segments, such as Europe.
               2. The adjustment to Segment income/loss of ¥ (19) million represents elimination of intersegment transactions.
               3. Segment income is adjusted to operating income presented in the consolidated statement of income.


          2. Information on impairment loss on noncurrent assets or goodwill by reportable segments
           (Material impairment loss on noncurrent assets)
                                                                                                                 (Millions of yen)
                                                   Reportable segments
                                                                                             Other       Adjustments     Total
                                                                     North
                                  Japan        Korea      China                   Total
                                                                    America
            Impairment loss               14     1,339         -           -       1,354             -           -         1,354


             (Material changes in goodwill)
                                                                                                                 (Millions of yen)
                                                  Reportable segments
                                                                                             Other       Adjustments     Total
                                                                     North
                                  Japan        Korea     China                   Total
                                                                    America
          Amortization during
              the period               80       1,119         -            -       1,200          -              -         1,200
         Ending balance at end
               of period            1,795      10,743         -            -      12,538          -              -        12,538


                                                            -8-
(Material changes in negative goodwill)
                                                                                                                      (Millions of yen)
                                                        Reportable segments
                                                                                                   Other     Adjustments       Total
                                                                            North
                                     Japan        Korea         China                 Total
                                                                           America
          Amortization during
              the period                 -             460            -         -           460         -             -             460
         Ending balance at end
               of period                 -            3,169           -         -       3,169           -             -            3,169


        (Information on gain on negative goodwill)
           Not applicable.


           3. Information by areas
               (Net sales)
                                                                                                                      (Millions of yen)
                Japan                Korea                    China         North America           Other                  Total

                        5,923                15,108               25,912              2,913                 3,396              53,253
       (Notes) 1. Net sales are grouped into countries or areas based on customers’ location.
               2. The segmentation by country or area is based on geological proximity.
               3. Details of countries or areas included in each segment
                   (1) North America: the United States of America and Canada
                   (2) Other: European and Asian countries and Central and South America


(6)Notes on significant changes in Shareholders’ equity, if any
   The disclosure is omitted as there was no major change.


(7)Significant subsequent events
   (Loan refinancing)
   On July 31, 2012, Nexon newly obtained a long-term loan from Sumitomo Mitsui Banking Corporation and simultaneously
   repaid its existing loan of JPY 50,000 million obtained through a special account loan agreement executed on June 29, 2012 to
   Sumitomo Mitsui Banking Corporation. We believe that the refinancing will lower our overall cost of funding in Japanese yen
   and U.S. dollars and provide us with additional strategic flexibility in financing our growth initiatives. Details of the refinancing
   and repayment are as follows:


   (1)Lender
      Sumitomo Mitsui Banking Corporation
   (2)Details of the refinancing
      Debt amount: JPY 34,000 million and USD 200 million
      Period of debt: 5 years (from July 31, 2012 to July 31, 2017)
      Terms of repayment: Nexon shall make its first repayment to Sumitomo Mitsui Banking Corporation on January 31, 2013
                             and thereafter make repayments of JPY 5,000 million on the end date of every six months.
      Interest rate: 1.41%
   (3)Date of refinancing
      July 31, 2012
   (4)Future outlook
      Nexon does not expect its interest expenses to significantly increase or decrease due to the refinancing.
   (5)Property subject to lien
      Investment securities: JPY 60,443 million
       The price above is the book value as of June 30, 2012.


                                                                  -9-
<Regarding to the accounts item in the consolidated financial statement>
With respect to the accounts items stated in this consolidated financial statement, please refer to the following chart with comparison
to offering circular.
(1) Quarterly consolidated balance sheet
             Quarterly Consolidated Financial Results                                            Offering Circular
Assets                                                                Assets
   Current assets                                                        Current assets:
     Cash and deposits                                                      Cash and time deposits
     Notes and accounts receivable-trade                                    Accounts receivable - trade
     Short-term investment securities                                       Trading securities
     Merchandise                                                            Merchandise
     Other                                                                  Other current assets
     Allowance for doubtful accounts                                        Allowance for doubtful accounts
     Total current assets                                                   Total current assets
   Noncurrent assets                                                     -
     Property, plant and equipment                                          Property, plant and equipment:
     Intangible assets                                                      Investments and other assets:
        Games Copyright                                                        Game copyrights
        Goodwill                                                               Goodwill
        Other                                                                  Other
        Total intangible assets                                                -
     Investments and other assets                                           Investments and other assets:
        Investment securities                                                  Investment securities
        Other                                                                  Other
        Allowance for doubtful accounts                                        Allowance for doubtful accounts
        Total investments and other assets                                     -
   Total noncurrent assets                                               -
   Total assets                                                          Total assets
Liabilities                                                           Liabilities and net assets
   Current liabilities                                                   Current liabilities:
     Notes and accounts payable-trade                                       Accounts payable - trade
     Short-term loans payable                                               Short-term borrowings
     Current portion of long-term loans payable                             Current portion of long-term borrowings
     Income taxes payable                                                   Provision for income taxes
     Unearned revenue                                                       Deferred income
     Provision for bonuses                                                  Employees' bonuses
     Asset retirement obligations - current                                 -
     Other                                                                  Other current liabilities
     Total current liabilities                                              Total current liabilities
   Noncurrent liabilities                                                Long-term liabilities:
     Long-term loans payable                                                Long-term borrowings
     Long-term unearned revenue                                             Deferred income
     Provision for retirement benefits                                      Employees' retirement benefits
     Negative goodwill                                                      Negative goodwill
     Asset retirement obligations - noncurrent                              Asset retirement obligations
     Other                                                                  Other non-current liabilities
     Total noncurrent liabilities                                           Total long-term liabilities
   Total liabilities                                                     Total liabilities
Net assets                                                            Net assets:
   Shareholders' equity                                                  Shareholders' equity
     Capital stock                                                          Common stock:
     Capital surplus                                                        Capital surplus
     Retained earnings                                                      Retained earnings
     Total shareholders' equity                                             Total shareholders' equity
   Accumulated other comprehensive income                                -
                                                                             Net unrealized gains (losses) on investment securities, net
     Valuation difference on available-for-sale securities
                                                                             of tax
     Foreign currency translation adjustment                                Foreign currency translation adjustments
     Total accumulated other comprehensive income                           -
   Subscription rights to shares                                         Stock options
   Minority interests                                                    Non-controlling interest
   Total net assets                                                      Total net assets
Total liabilities and net assets                                      Total liabilities and net assets


                                                                  - 10 -
(2) Quarterly consolidated statements of (comprehensive) income
        (Quarterly consolidated statement of income)
              Quarterly Consolidated Financial Results                                   Offering Circular
 Net sales                                                        Revenues
 Cost of sales                                                    Cost of sales
 Gross profit                                                     Gross profit
 Selling, general and administrative expenses                     Selling, general and administrative expenses
 Operating income                                                 Operating income
 Non-operating income                                             Other income (expense):
    Interest income                                                 Interest income
    Amortization of negative goodwill                               Negative goodwill amortization
    Miscellaneous income                                            -
    Total non-operating income                                      -
 Non-operating expenses                                           -
    Interest expenses                                               Interest expense
    Foreign exchange losses                                         Foreign exchange gains (losses)
    Equity in losses of affiliates                                  Equity in earnings (losses) of affiliates
    Miscellaneous expenses                                          -
    Total non-operating expenses                                    -
 Ordinary income                                                  -
 Extraordinary income                                             -
    Gain on sales of noncurrent assets                              Gain (loss) on sales/disposal of fixed assets
    Gain on change in equity                                        -
    Total extraordinary income                                      -
 Extraordinary loss                                               -
    Loss on sales and retirement of noncurrent assets               Gain (loss) on sales/disposal of fixed assets
    Impairment loss                                                 Impairment losses
    Loss on change in equity                                        -
    Total extraordinary losses                                      -
 Income before income taxes and minority interests                Income before income taxes
 Income taxes                                                     Income taxes
 Income before minority interests                                 Income before minority interest
 Minority interests in loss                                       Non-controlling interest in net income (loss)
 Net income                                                       Net income


                                                              - 11 -
(3) Quarterly consolidated statements of cash flows
            Quarterly Consolidated Financial Results                                             Offering Circular
Operating activities                                                    Operating activities
  Income before income taxes and minority interests                       Income before income taxes
  Depreciation and amortization                                           Depreciation and amortization
  Amortization of goodwill                                                Goodwill amortization
  Amortization of negative goodwill                                       Negative goodwill amortization
  Decrease in allowance for doubtful accounts                             Increase (decrease) in allowance for doubtful accounts
  Decrease in provision for bonuses                                       Increase (decrease) in provision for employees' bonuses
  Decrease in provision for retirement benefits                           Decrease in provision for retirement benefit expenses
  Interest and dividends income                                           Interest and dividend income
  Interest expenses                                                       Interest expense
  Foreign exchange losses                                                 Foreign exchange (gains) losses
  Impairment loss                                                         Impairment losses
  Equity in losses of affiliates                                          Equity in losses of affiliates
  Decrease in notes and accounts receivable-trade                         Increase in accounts receivable- trade
  Increase in other current assets                                        Decrease (increase) in other current assets
  Decrease in notes and accounts payable-trade                            Increase in accounts payable- trade
  Decrease in unearned revenue                                            Increase (decrease) in deferred income
  Decrease in other current liabilities                                   Increase (decrease) in other current liabilities
  Other, net                                                              Other - net
     Subtotal                                                                Subtotal
  Interest and dividends income received                                  Interest and dividends received
  Interest expenses paid                                                  Interest paid
  Income taxes paid                                                       Income taxes paid
  Net cash provided by operating activities                               Net cash provided by operating activities
Investing activities                                                    Investing activities
  Increase in time deposits                                               Decrease (increase) in time deposits
  Increase in short-term investment securities                            Decrease (increase) in short-term investment securities
  Purchase of property, plant and equipment                               Purchases of property, plant and equipment
  Proceeds from sales of property, plant and equipment                    Proceeds from sales of property, plant and equipment
  Purchase of intangible assets                                           Purchases of intangible assets
  Payments for long-term prepaid expenses with increase                   Increase in long-term prepaid expenses
  Payments of short-term loans receivable                                 Payments of short-term loans receivable
  Collection of short-term loans receivable                               Collection of short-term loans receivable
  Collection of long-term loans receivable                                Collection of long-term loans receivable
  Purchase of investment securities                                       Purchases of investment securities
  Proceeds from sales of investment securities                            Proceeds from sales of investment securities
  Purchase of investments in subsidiaries                                 Purchases of shares of subsidiaries
  Purchase of stocks of subsidiaries and affiliates                       Purchase of shares of affiliates
   Purchase of investments in subsidiaries resulting in change in         Proceeds from purchase of investments in subsidiaries
   scope of consolidation                                                 resulting in change in scope of consolidation
  Payments for transfer of business                                       -
  Payments for deposit pledged as collateral                              Payments of deposits pledged as collateral
  Proceeds from deposit released from collateral                          Proceeds from withdrawal of deposits pledged as collateral
  Other, net                                                              Other - net
  Net cash used in investing activities                                   Net cash used in investing activities
Financing activities                                                    Financing activities
  Increase in short-term loans payable                                    Proceeds from short-term borrowings
  Proceeds from long-term loans payable                                   Proceeds from long-term borrowings
  Repayment of long-term loans payable                                    Repayments of long-term borrowings
  Repayments of finance lease obligations                                 Repayments of lease obligations
  Proceeds from exercise of stock option                                  -
  Other, net                                                              Other - net
  Net cash provided by financing activities                               Net cash provided by (used in) financing activities
Effect of exchange rate change on cash and cash equivalents             Effect of exchange rate changes on cash and cash equivalents
Net decrease in cash and cash equivalents                               Net increase in cash and cash equivalents
Cash and cash equivalents at beginning of period                        Cash and cash equivalents at beginning of year
Cash and cash equivalents at end of period                              Cash and cash equivalents at end of year


                                                                    - 12 -

Más contenido relacionado

La actualidad más candente

Daily newsletter - October 20, 2011
Daily newsletter - October 20, 2011Daily newsletter - October 20, 2011
Daily newsletter - October 20, 2011Fullerton Securities
 
Economic indicators December 2012 - part 1
Economic indicators December 2012 - part 1Economic indicators December 2012 - part 1
Economic indicators December 2012 - part 1SappiHouston
 
Companies2008 Q4 Results
Companies2008 Q4 ResultsCompanies2008 Q4 Results
Companies2008 Q4 ResultsPeter Lim
 
Daily Newsletter: 01st August, 2011
Daily Newsletter: 01st August, 2011Daily Newsletter: 01st August, 2011
Daily Newsletter: 01st August, 2011Fullerton Securities
 
first energy 4Q 08 Consolidated Report NEW NEW209
first energy 4Q 08 Consolidated Report NEW NEW209first energy 4Q 08 Consolidated Report NEW NEW209
first energy 4Q 08 Consolidated Report NEW NEW209finance21
 
walt disney Quarter 2008 3rd
walt disney   Quarter 2008 3rdwalt disney   Quarter 2008 3rd
walt disney Quarter 2008 3rdfinance7
 
Semiannual Report 30 June 2010
Semiannual Report 30 June 2010Semiannual Report 30 June 2010
Semiannual Report 30 June 2010Edison S.p.A.
 
oneok 2001 Annual Report
oneok 2001 Annual Reportoneok 2001 Annual Report
oneok 2001 Annual Reportfinance20
 

La actualidad más candente (10)

Q1 2009 Earning Report of Canon, Inc.
Q1 2009 Earning Report of Canon, Inc.Q1 2009 Earning Report of Canon, Inc.
Q1 2009 Earning Report of Canon, Inc.
 
Daily newsletter - October 20, 2011
Daily newsletter - October 20, 2011Daily newsletter - October 20, 2011
Daily newsletter - October 20, 2011
 
Economic indicators December 2012 - part 1
Economic indicators December 2012 - part 1Economic indicators December 2012 - part 1
Economic indicators December 2012 - part 1
 
Companies2008 Q4 Results
Companies2008 Q4 ResultsCompanies2008 Q4 Results
Companies2008 Q4 Results
 
Daily Newsletter: 01st August, 2011
Daily Newsletter: 01st August, 2011Daily Newsletter: 01st August, 2011
Daily Newsletter: 01st August, 2011
 
K bank daily feb 7
K bank daily feb 7K bank daily feb 7
K bank daily feb 7
 
first energy 4Q 08 Consolidated Report NEW NEW209
first energy 4Q 08 Consolidated Report NEW NEW209first energy 4Q 08 Consolidated Report NEW NEW209
first energy 4Q 08 Consolidated Report NEW NEW209
 
walt disney Quarter 2008 3rd
walt disney   Quarter 2008 3rdwalt disney   Quarter 2008 3rd
walt disney Quarter 2008 3rd
 
Semiannual Report 30 June 2010
Semiannual Report 30 June 2010Semiannual Report 30 June 2010
Semiannual Report 30 June 2010
 
oneok 2001 Annual Report
oneok 2001 Annual Reportoneok 2001 Annual Report
oneok 2001 Annual Report
 

Similar a Kessan 6043476173461319

Kessan 1708682945115077
Kessan 1708682945115077Kessan 1708682945115077
Kessan 1708682945115077yoshikawa0521
 
Q1 2009 Earning Report of Hitachi Construction Machinery Co., Ltd.
Q1 2009 Earning Report of Hitachi Construction Machinery Co., Ltd. Q1 2009 Earning Report of Hitachi Construction Machinery Co., Ltd.
Q1 2009 Earning Report of Hitachi Construction Machinery Co., Ltd. earningreport earningreport
 
Q3 Results
Q3 Results Q3 Results
Q3 Results Infosys
 
Annual Financial Report 2011/12
Annual Financial Report 2011/12 Annual Financial Report 2011/12
Annual Financial Report 2011/12 AT&S_IR
 
Key figures at September 30, 2011 - Conference call on November 10, 2011
Key figures at September 30, 2011 - Conference call on November 10, 2011Key figures at September 30, 2011 - Conference call on November 10, 2011
Key figures at September 30, 2011 - Conference call on November 10, 2011ve-finance
 
XING AG half year report 2012
XING AG half year report 2012XING AG half year report 2012
XING AG half year report 2012XING SE
 
Infosys Press conference-q3-12
Infosys Press conference-q3-12Infosys Press conference-q3-12
Infosys Press conference-q3-12patilashuna
 
Infosys Q3 Performance
Infosys Q3 PerformanceInfosys Q3 Performance
Infosys Q3 PerformanceInfosys
 
Chapter5 modelling innovation - preview
Chapter5   modelling innovation - previewChapter5   modelling innovation - preview
Chapter5 modelling innovation - previewHugo Mendes Domingos
 
Key figures as of September 30, 2012
Key figures as of September 30, 2012 Key figures as of September 30, 2012
Key figures as of September 30, 2012 ve-finance
 
2011 Half Year Results Presentation
2011 Half Year Results Presentation2011 Half Year Results Presentation
2011 Half Year Results PresentationSGS
 
Key Indicators of Interim Financial Statements prepared in accordance with IF...
Key Indicators of Interim Financial Statements prepared in accordance with IF...Key Indicators of Interim Financial Statements prepared in accordance with IF...
Key Indicators of Interim Financial Statements prepared in accordance with IF...Lenenergo IR
 
Financial analysis of the Toyota Company
Financial analysis of the Toyota CompanyFinancial analysis of the Toyota Company
Financial analysis of the Toyota CompanyLevi Haegebaert
 

Similar a Kessan 6043476173461319 (20)

Fy 2010
Fy 2010Fy 2010
Fy 2010
 
Kessan 1708682945115077
Kessan 1708682945115077Kessan 1708682945115077
Kessan 1708682945115077
 
Q1 2009 Earning Report of Hitachi Construction Machinery Co., Ltd.
Q1 2009 Earning Report of Hitachi Construction Machinery Co., Ltd. Q1 2009 Earning Report of Hitachi Construction Machinery Co., Ltd.
Q1 2009 Earning Report of Hitachi Construction Machinery Co., Ltd.
 
Q3 Results
Q3 Results Q3 Results
Q3 Results
 
2008
20082008
2008
 
Annual Financial Report 2011/12
Annual Financial Report 2011/12 Annual Financial Report 2011/12
Annual Financial Report 2011/12
 
Key figures at September 30, 2011 - Conference call on November 10, 2011
Key figures at September 30, 2011 - Conference call on November 10, 2011Key figures at September 30, 2011 - Conference call on November 10, 2011
Key figures at September 30, 2011 - Conference call on November 10, 2011
 
q2_2010_en[1].pdf
q2_2010_en[1].pdfq2_2010_en[1].pdf
q2_2010_en[1].pdf
 
XING AG half year report 2012
XING AG half year report 2012XING AG half year report 2012
XING AG half year report 2012
 
Infosys Press conference-q3-12
Infosys Press conference-q3-12Infosys Press conference-q3-12
Infosys Press conference-q3-12
 
Infosys Q3 Performance
Infosys Q3 PerformanceInfosys Q3 Performance
Infosys Q3 Performance
 
Q1 2009 Earning Report of Makita Corp.
Q1 2009 Earning Report of Makita Corp.Q1 2009 Earning Report of Makita Corp.
Q1 2009 Earning Report of Makita Corp.
 
Chapter5 modelling innovation - preview
Chapter5   modelling innovation - previewChapter5   modelling innovation - preview
Chapter5 modelling innovation - preview
 
Key figures as of September 30, 2012
Key figures as of September 30, 2012 Key figures as of September 30, 2012
Key figures as of September 30, 2012
 
Fujitec
FujitecFujitec
Fujitec
 
2011 Half Year Results Presentation
2011 Half Year Results Presentation2011 Half Year Results Presentation
2011 Half Year Results Presentation
 
1H 2011 results
1H 2011 results1H 2011 results
1H 2011 results
 
1 h13 hcc eng 검토
1 h13 hcc eng 검토1 h13 hcc eng 검토
1 h13 hcc eng 검토
 
Key Indicators of Interim Financial Statements prepared in accordance with IF...
Key Indicators of Interim Financial Statements prepared in accordance with IF...Key Indicators of Interim Financial Statements prepared in accordance with IF...
Key Indicators of Interim Financial Statements prepared in accordance with IF...
 
Financial analysis of the Toyota Company
Financial analysis of the Toyota CompanyFinancial analysis of the Toyota Company
Financial analysis of the Toyota Company
 

Kessan 6043476173461319

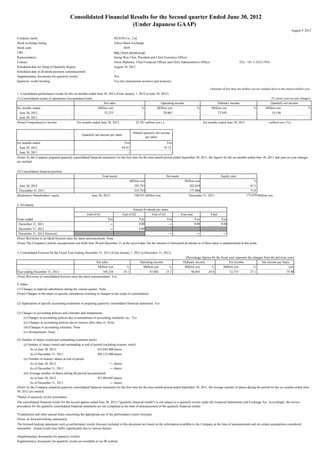
  • 1. Consolidated Financial Results for the Second quarter Ended June 30, 2012 (Under Japanese GAAP) August 9, 2012 Company name: NEXON Co., Ltd. Stock exchange listing: Tokyo Stock Exchange Stock code: 3659 URL: http://www.nexon.co.jp/ Representative: Seung Woo Choi, President and Chief Executive Officer Contact: Owen Mahoney, Chief Financial Officer and Chief Administrative Officer TEL: +81-3-3523-7910 Scheduled date for filing of Quarterly Report: August 10, 2012 Scheduled date of dividend payment commencement: - Supplementary documents for quarterly results: Yes Quarterly results briefing: Yes (for institutional investors and analysts) (Amounts of less than one million yen are rounded down to the nearest million yen) 1. Consolidated performance results for the six months ended June 30, 2012 (From January 1, 2012 to June 30, 2012) (1) Consolidated results of operations (Accumulated total) (% shows year-on-year changes) Net sales Operating income Ordinary income Quarterly net income Six months ended Million yen % Million yen % Million yen % Million yen % June 30, 2012 53,253 - 28,063 - 27,045 - 19,146 - June 30, 2011 - - - - - - - - (Note) Comprehensive income Six months ended June 30, 2012: 23,501 million yen (-) Six months ended June 30, 2011: - million yen (-%) Diluted quarterly net income Quarterly net income per share per share Six months ended Yen Yen June 30, 2012 44.41 43.12 June 30, 2011 - - (Note) As the Company prepared quarterly consolidated financial statements for the first time for the nine-month period ended September 30, 2011, the figures for the six months ended June 30, 2011 and year-on-year changes are omitted. (2) Consolidated financial position Total assets Net assets Equity ratio Million yen Million yen % June 30, 2012 295,793 202,656 67.3 December 31, 2011 235,765 177,886 73.8 (Reference) Shareholders' equity June 30, 2012: 198,931 Million yen December 31, 2011: 173,979 Million yen 2. Dividends Annual dividends per share End of Q1 End of Q2 End of Q3 Year-end Total Years ended Yen Yen Yen Yen Yen December 31, 2011 ― 0.00 ― 0.00 0.00 December 31, 2012 ― 0.00 December 31, 2012 (forecast) ― ― ― (Note) Revisions to dividend forecast since the latest announcement: None (Note) The Company's articles incorporation sets forth June 30 and December 31 as the record date, but the amount of forecasted dividends as of these dates is undetermined at this point. 3. Consolidated Forecast for the Fiscal Year Ending December 31, 2012 (From January 1, 2012 to December 31, 2012) (Percentage figures for the fiscal year represent the changes from the previous year) Net sales Operating income Ordinary income Net income Net income per share Million yen % Million yen % Million yen % Million yen % yen Year ending December 31, 2012 104,334 19.1 47,082 23.1 46,043 24.8 32,737 27.1 75.88 (Note) Revisions to consolidated forecast since the latest announcement: Yes 4. Other (1) Changes in material subsidiaries during the current quarter: None (Note) Changes in the status of specific subsidiaries resulting in changes in the scope of consolidation (2) Application of specific accounting treatments in preparing quarterly consolidated financial statements: Yes (3) Changes in accounting policies and estimates and restatements   (i) Changes in accounting policies due to amendment of accounting standards, etc.: Yes   (ii) Changes in accounting policies due to reasons other than (i): None   (iii) Changes in accounting estimates: None   (iv) Restatements: None (4) Number of shares issued and outstanding (common stock)   (i) Number of shares issued and outstanding at end of period (including treasury stock) As of June 30, 2012: 433,685,900 shares As of December 31, 2011: 426,132,900 shares   (ii) Number of treasury shares at end of period As of June 30, 2012: ― shares As of December 31, 2011: ― shares   (iii) Average number of shares during the period (accumulated) As of June 30, 2012: 431,084,043 shares As of December 31, 2011: ― shares (Note) As the Company prepared quarterly consolidated financial statements for the first time for the nine-month period ended September 30, 2011, the average number of shares during the period for the six months ended June 30, 2012 are omitted. *Status of quarterly review procedures The consolidated financial results for the second quarter ended June 30, 2012 ("quarterly financial results") is not subject to a quarterly review under the Financial Instruments and Exchange Act. Accordingly, the review procedures for the quarterly consolidated financial statements are not completed at the time of announcement of the quarterly financial results. *Explanation and other special notes concerning the appropriate use of the performance results forecasts (Notes on forward-looking statements) The forward-looking statements such as performance results forecasts included in this document are based on the information available to the Company at the time of announcement and on certain assumptions considered reasonable. Actual results may differ significantly due to various factors. (Supplementary documents for quarterly results) Supplementary documents for quarterly results are available at our IR website.
  • 2. Consolidated Forecast for the three months ending September 30, 2012 (From July 1, 2012 to September 30, 2012) (Percentages figures for the three months period represent the changes from the same period of the previous year) Net sales Operating income Ordinary income Net income Net income per share Million yen % Million yen % Million yen % Million yen % yen Three months ending September 30, 2012 24,943 3.3 9,249 -15.5 9,191 -9.6 6,598 -8.8 15.24 Besides the consolidated performance forecasts for the Year ending December 31, 2012, the Company also announces the forecast for the next quarter, in this case, the third quarter ending September 30, 2012. In addition, when the Company calculates the revised performance forecast that operating income, ordinary income, net income to be deviated more than 30% from the latest released forecast, or revenue to be deviated 10% from the latest released forecast, the Company will release the announcement of updated performance forecast.
  • 3. ○Index of Attachment 1. Qualitative information on consolidated performance results for the quarter ended June 30, 2012………………………… 1 (1) Qualitative information on consolidated results of operations…………………………………………………………… 1 (2) Qualitative information on consolidated financial position……………………………………………………………… 1 (3) Qualitative information on consolidated performance results forecast………………….…………………………….… 2 2. Other information …………………………………………………………………………………………………………… 2 (1) Changes in material subsidiaries during the six months ended June 30, 2012…………………………………………… 2 (2) Application of specific accounting treatments in preparing the quarterly consolidated financial statements…………… 2 (3) Changes in accounting policies and estimates, and restatements ……….……………………………………………… 3 3. Quarterly consolidated financial statements.………………………………..……………………………………………… 4 (1) Quarterly consolidated balance sheet...…………………………………….…………………………………………… 4 (2) Quarterly consolidated statements of (comprehensive) income………………………………………………………… 5 Quarterly consolidated statement of income For the six months ended June 30, 2012…………………………………………………………………………… 5 Quarterly consolidated statement of comprehensive income For the six months ended June 30, 2012…………………………………………………………………………… 6 (3) Quarterly consolidated statements of cash flows………………………………………………………………………… 7 (4) Notes related to going concern assumption……………………………………………………………………………… 8 (5) Segment information…. ………………………………………………………………………………………………… 8 (6) Notes on significant changes in Shareholders’ equity, if any…………………………………………………………… 9 (7) Significant subsequent events…………………………………………………………………………………………… 9
  • 4. 1. Qualitative information on consolidated performance results for the quarter ended June 30, 2012 (1) Qualitative information on consolidated results of operations During the six months ended June 30, 2012, the world economy showed a moderate recovery, but the outlook is uncertain because of the prolonged financial crisis in Europe, delay in economic recovery in developed countries and slowdown in emerging economies’ growth. In Asia, the economic growth is slowing down due to the economic slowdown in Europe and the US and sluggish domestic demand. In Japan, however, despite concerns over the decline in overseas economies, production activities and individual consumption seem to be improving due primarily to reconstruction demands, and the Japanese economy is gradually recovering. In such environment, the Group is engaged in primarily online game business, as well as mobile game business and other businesses, and has been striving to provide wide range of customers with high quality services and to build or acquire excellent contents to accommodate diversifying needs of users through updating existing game titles and distributing new game titles. As a result of our efforts, we recorded net sales of ¥53,253 million, operating income of ¥28,063 million, ordinary income of ¥27,045 million and net income of ¥19,146 million for the six months ended June 30, 2012. Performance results by reportable segments are as follows: (a) Japan In Japan, while sales from game titles such as “Tales Weaver,” “Counter-Strike Online,” and “Sudden Attack” continued to show steady growth, sales from some of the other titles decreased. As a result, net sales amounted to ¥5,917 million and segment income amounted to ¥455 million. (b) Korea In Korea, steady growth of sales from “Sudden Attack” and an increase in royalty income due to significant increase in sales from “Dungeon&Fighter” in China contributed to net sales of ¥41,879 million and segment income of ¥26,264 million. (c) China In China, an increase in consulting income as a result of growth of the online game market in China contributed to net sales of ¥2,002 million and segment income of ¥1,360 million. (d) North America In North America, the delay in update as a consequence of the hacking attempt to “Maple Story” at the end of the previous consolidated fiscal year resulted in net sales of ¥2,496 million and segment loss of ¥244 million. (e) Other In other areas, sales slightly decreased on a year-on-year basis, and the impact of foreign exchange rates resulted in net sales of ¥958 million and segment income of ¥246 million. (2) Qualitative information on consolidated financial position (a) Cash flows Cash and cash equivalent (“cash”) at June 30, 2012 was ¥105,940 million. Cash flows from each activity for the six months ended June 30, 2012 and their major components are as follows: (Cash flows from operating activities) Net cash provided by operating activities amounted to ¥23,450 million. Major components included Income before income taxes and minority interests of ¥25,737 million, Depreciation and amortization of ¥4,810 million, and Income taxes paid of ¥9,232 million. (Cash flows from investing activities) Net cash used in investing activities amounted to ¥73,131 million. Major components included an Increase in time deposits of ¥10,020 million, Purchase of stocks of subsidiaries and affiliates of ¥4,482 million, and Purchase of investment securities of ¥56,440 million. (Cash flows from financing activities) Net cash provided by financing activities amounted to ¥37,551 million. Major components included Proceeds from short-term loans payable of ¥53,125 million and Repayment of long-term loans payable of ¥17,043 million. (b) Analysis of financial position (Assets) Total assets as of June 30, 2012 totaled ¥295,793 million, an increase of ¥60,027 million from December 31, 2011. Current assets as of June 30, 2012 amounted to ¥146,297 million, a decrease of ¥4,424 million mainly due to a decrease of Cash and deposits of ¥3,389 million from December 31, 2011. -1-
  • 5. Noncurrent assets as of June 30, 2012 amounted to ¥149,495 million, an increase of ¥64,452 million due to an increase of Investment securities by ¥64,176 million from December 31, 2011. (Liabilities) Total liabilities amounted to ¥93,136 million, an increase of ¥35,257 million compared to the balance at December 31, 2011. Current liabilities at June 30, 2012 totaled ¥72,653 million, an increase of ¥48,091 million from December 31, 2011. This is mainly due to an increase of Short-term loans payable of ¥53,095 million, and a decrease of Current portion of Long-term loans payable of ¥2,828 million. Noncurrent liabilities totaled ¥20,483 million, a decrease of ¥12,833 million from December 31, 2011 due to a decrease of Long-term loans payable of ¥13,767 million. (Net assets) Net assets as of June 30, 2012 totaled ¥202,656 million, an increase of ¥24,769 million from December 31, 2011, mainly due to an increase of Retained earnings from recording Net income for the quarter of ¥19,146 million and an increase of Valuation difference on available-for-sale securities of ¥3,073 million. (3) Qualitative information on consolidated performance results forecast We revised our sales revenue for the third quarter and thereafter considering our current situation and actual business performance. Revision to consolidated full year business outlook for the fiscal year ending December 31, 2012 is as follows: The following business outlook is based on information available at the time the assumption was made, and is subject to various risks that could cause actual results to differ from expectations. Revisions to consolidated forecast figures for the full fiscal year ending December 31, 2012 are as follows: (Units: millions of yen, %) Operating Net Income per Revenues Ordinary Income Net Income Income share Previous forecast (A) 108,338 52,234 53,011 37,800 87.88 Revised forecast (B) 104,334 47,082 46,043 32,737 75.88 Difference (B-A) (4,004) (5,151) (6,967) (5,062) ― Percentage change (%) (3.7) (9.9) (13.1) (13.4) ― (Reference) Year ended 87,613 38,249 36,905 25,755 71.65 December 31, 2011 2. Other information (1) Changes in material subsidiaries during the six months ended June 30, 2012 Not applicable. (2) Application of specific accounting treatments in preparing the quarterly consolidated financial statements Tax expenses are calculated as income before income taxes and minority interests for the quarter multiplied by the estimated effective tax rate. The effective tax rate is reasonably estimated taking into consideration deferred tax accounting as the rate applicable to income before income taxes and minority interests for the consolidated fiscal year including the quarter ended June 30, 2012. Certain consolidated subsidiaries account for income taxes for the six months ended June 30, 2012 on a basis consistent with the accounting for income taxes for the fiscal year. -2-
  • 6. (3) Changes in accounting policies and estimates, and restatements (Adoption of Accounting Standard for Net Income per Share, etc.) Effective January, 1, 2012, the Company adopted Accounting Standards Board of Japan (“ASBJ”) Statement No.2, “Accounting Standard for Net Income per Share”, issued on June 30, 2010 and ASBJ Guidance No.4 (revised 2006), “Guidance on Accounting Standard for Net Income per Share” issued on June 30, 2010. The Company has changed the method to calculate quarterly diluted net income per share as follows. For stock options that vest after a specified service period, the fair value of service expected to be provided to the Company in the future is included in the cash proceeds assumed to be received upon exercise of the stock options. -3-
  • 7. 3. Quarterly consolidated financial statements (1) Quarterly consolidated balance sheet (Millions of yen) December 31, 2011 June 30, 2012 Assets Current assets Cash and deposits 132,479 129,089 Notes and accounts receivable-trade 13,845 12,588 Short-term investment securities 12 95 Merchandise 40 49 Other 4,367 4,482 Allowance for doubtful accounts (22) (8) Total current assets 150,722 146,297 Noncurrent assets Property, plant and equipment 16,016 17,781 Intangible assets Games Copyright 31,163 28,479 Goodwill 11,595 12,538 Other 1,315 1,396 Total intangible assets 44,074 42,413 Investments and other assets Investment securities 17,002 81,178 Other 10,766 10,840 Allowance for doubtful accounts (2,815) (2,717) Total investments and other assets 24,952 89,300 Total noncurrent assets 85,043 149,495 Total assets 235,765 295,793 Liabilities Current liabilities Notes and accounts payable-trade 981 934 Short-term loans payable - 53,095 Current portion of long-term loans payable 2,994 166 Income taxes payable 6,671 4,839 Unearned revenue 8,111 7,896 Provision for bonuses 1,082 712 Asset retirement obligations - current 47 17 Other 4,672 4,990 Total current liabilities 24,562 72,653 Noncurrent liabilities Long-term loans payable 18,567 4,800 Long-term unearned revenue 5,707 5,038 Provision for retirement benefits 203 179 Negative goodwill 3,553 3,169 Asset retirement obligations - noncurrent 117 146 Other 5,167 7,149 Total noncurrent liabilities 33,316 20,483 Total liabilities 57,878 93,136 Net assets Shareholders' equity Capital stock 50,300 51,054 Capital surplus 50,162 50,914 Retained earnings 90,757 109,903 Total shareholders' equity 191,219 211,873 Accumulated other comprehensive income Valuation difference on available-for-sale securities 471 3,545 Foreign currency translation adjustment (17,711) (16,487) Total accumulated other comprehensive income (17,239) (12,941) Subscription rights to shares 455 354 Minority interests 3,451 3,370 Total net assets 177,886 202,656 Total liabilities and net assets 235,765 295,793 -4-
  • 8. (2) Quarterly consolidated statements of (comprehensive) income (Quarterly consolidated statement of income) (For the six months ended June 30, 2012) (Millions of yen) Six months ended June 30, 2012 Net sales 53,253 Cost of sales 8,223 Gross profit 45,030 Selling, general and administrative expenses 16,966 Operating income 28,063 Non-operating income Interest income 721 Amortization of negative goodwill 460 Miscellaneous income 311 Total non-operating income 1,493 Non-operating expenses Interest expenses 255 Foreign exchange losses 277 Equity in losses of affiliates 1,833 Miscellaneous expenses 143 Total non-operating expenses 2,510 Ordinary income 27,045 Extraordinary income Gain on sales of noncurrent assets 3 Gain on change in equity 92 Total extraordinary income 96 Extraordinary loss Loss on sales and retirement of noncurrent assets 40 Impairment loss 1,354 Loss on change in equity 9 Total extraordinary losses 1,404 Income before income taxes and minority interests 25,737 Income taxes 6,534 Income before minority interests 19,203 Minority interests in income 57 Net income 19,146 -5-
  • 9. (Quarterly consolidated statement of comprehensive income) (For the six months ended June 30, 2012) (Millions of yen) Six months ended June 30, 2012 Income before minority interests 19,203 Other comprehensive income Valuation difference on available-for-sale securities 3,073 Foreign currency translation adjustment 1,038 Share of other comprehensive income of associates accounted for using 185 equity method Total other comprehensive income 4,297 Comprehensive income 23,501 (Comprehensive income attributable to) Comprehensive income attributable to owners of the parent 23,444 Comprehensive income attributable to minority interests 56 -6-
  • 10. (3) Quarterly consolidated statements of cash flows (For the six months ended June 30, 2012) (Millions of yen) Six months ended June 30, 2012 Operating activities Income before income taxes and minority interests 25,737 Depreciation and amortization 4,810 Amortization of goodwill 1,200 Amortization of negative goodwill (460) Decrease in allowance for doubtful accounts (169) Decrease in provision for bonuses (391) Decrease in provision for retirement benefits (28) Interest and dividends income (747) Interest expenses 255 Foreign exchange losses 228 Impairment loss 1,354 Equity in losses of affiliates 1,833 Decrease in notes and accounts receivable-trade 1,669 Increase in other current assets (1,764) Decrease in notes and accounts payable-trade (63) Decrease in unearned revenue (1,089) Decrease in other current liabilities (253) Other, net 36 Subtotal 32,159 Interest and dividends income received 787 Interest expenses paid (263) Income taxes paid (9,232) Net cash provided by operating activities 23,450 Investing activities Increase in time deposits (10,020) Increase in short-term investment securities (83) Purchase of property, plant and equipment (1,473) Proceeds from sales of property, plant and equipment 43 Purchase of intangible assets (425) Payments for long-term prepaid expenses with increase (246) Payments of short-term loans receivable (110) Collection of short-term loans receivable 1,908 Collection of long-term loans receivable 4 Purchase of investment securities (56,440) Proceeds from sales of investment securities 389 Purchase of investments in subsidiaries (559) Purchase of stocks of subsidiaries and affiliates (4,482) Purchase of investments in subsidiaries resulting in change in (1,231) scope of consolidation Payments for transfer of business (1,750) Payments for deposit pledged as collateral (14,032) Proceeds from deposit released from collateral 15,043 Other, net 335 Net cash used in investing activities (73,131) Financing activities Increase in short-term loans payable 53,125 Proceeds from long-term loans payable 327 Repayment of long-term loans payable (17,043) Repayments of finance lease obligations (276) Proceeds from exercise of stock option 1,416 Other, net 1 Net cash provided by financing activities 37,551 Effect of exchange rate change on cash and cash equivalents 471 Net decrease in cash and cash equivalents (11,658) Cash and cash equivalents at beginning of period 117,598 Cash and cash equivalents at end of period 105,940 -7-
  • 11. (4)Notes related to going concern assumption Not applicable. (5) Segment information (Segment information) For the six months ended June 30, 2012 (From January 1, 2012 to June 30, 2012) 1. Net sales and net income or loss by reportable segments (Millions of yen) Quarterly Reportable segments consolidate Other Adjustments statement North (Note 1) (Note 2) Japan Korea China Total of income America (Note 3) Net sales Sales to third party customers 5,917 41,879 2,002 2,496 52,295 958 - 53,253 Intersegment sales or transfer between - 2,337 - 56 2,393 - (2,393) - segments Total 5,917 44,216 2,002 2,552 54,688 958 (2,393) 53,253 Segment income 455 26,264 1,360 (244) 27,836 246 (19) 28,063 (Notes) 1. “Other” includes geographical segments not included in any of the reportable segments, such as Europe. 2. The adjustment to Segment income/loss of ¥ (19) million represents elimination of intersegment transactions. 3. Segment income is adjusted to operating income presented in the consolidated statement of income. 2. Information on impairment loss on noncurrent assets or goodwill by reportable segments (Material impairment loss on noncurrent assets) (Millions of yen) Reportable segments Other Adjustments Total North Japan Korea China Total America Impairment loss 14 1,339 - - 1,354 - - 1,354 (Material changes in goodwill) (Millions of yen) Reportable segments Other Adjustments Total North Japan Korea China Total America Amortization during the period 80 1,119 - - 1,200 - - 1,200 Ending balance at end of period 1,795 10,743 - - 12,538 - - 12,538 -8-
  • 12. (Material changes in negative goodwill) (Millions of yen) Reportable segments Other Adjustments Total North Japan Korea China Total America Amortization during the period - 460 - - 460 - - 460 Ending balance at end of period - 3,169 - - 3,169 - - 3,169 (Information on gain on negative goodwill) Not applicable. 3. Information by areas (Net sales) (Millions of yen) Japan Korea China North America Other Total 5,923 15,108 25,912 2,913 3,396 53,253 (Notes) 1. Net sales are grouped into countries or areas based on customers’ location. 2. The segmentation by country or area is based on geological proximity. 3. Details of countries or areas included in each segment (1) North America: the United States of America and Canada (2) Other: European and Asian countries and Central and South America (6)Notes on significant changes in Shareholders’ equity, if any The disclosure is omitted as there was no major change. (7)Significant subsequent events (Loan refinancing) On July 31, 2012, Nexon newly obtained a long-term loan from Sumitomo Mitsui Banking Corporation and simultaneously repaid its existing loan of JPY 50,000 million obtained through a special account loan agreement executed on June 29, 2012 to Sumitomo Mitsui Banking Corporation. We believe that the refinancing will lower our overall cost of funding in Japanese yen and U.S. dollars and provide us with additional strategic flexibility in financing our growth initiatives. Details of the refinancing and repayment are as follows: (1)Lender Sumitomo Mitsui Banking Corporation (2)Details of the refinancing Debt amount: JPY 34,000 million and USD 200 million Period of debt: 5 years (from July 31, 2012 to July 31, 2017) Terms of repayment: Nexon shall make its first repayment to Sumitomo Mitsui Banking Corporation on January 31, 2013 and thereafter make repayments of JPY 5,000 million on the end date of every six months. Interest rate: 1.41% (3)Date of refinancing July 31, 2012 (4)Future outlook Nexon does not expect its interest expenses to significantly increase or decrease due to the refinancing. (5)Property subject to lien Investment securities: JPY 60,443 million The price above is the book value as of June 30, 2012. -9-
  • 13. <Regarding to the accounts item in the consolidated financial statement> With respect to the accounts items stated in this consolidated financial statement, please refer to the following chart with comparison to offering circular. (1) Quarterly consolidated balance sheet Quarterly Consolidated Financial Results Offering Circular Assets Assets Current assets Current assets: Cash and deposits Cash and time deposits Notes and accounts receivable-trade Accounts receivable - trade Short-term investment securities Trading securities Merchandise Merchandise Other Other current assets Allowance for doubtful accounts Allowance for doubtful accounts Total current assets Total current assets Noncurrent assets - Property, plant and equipment Property, plant and equipment: Intangible assets Investments and other assets: Games Copyright Game copyrights Goodwill Goodwill Other Other Total intangible assets - Investments and other assets Investments and other assets: Investment securities Investment securities Other Other Allowance for doubtful accounts Allowance for doubtful accounts Total investments and other assets - Total noncurrent assets - Total assets Total assets Liabilities Liabilities and net assets Current liabilities Current liabilities: Notes and accounts payable-trade Accounts payable - trade Short-term loans payable Short-term borrowings Current portion of long-term loans payable Current portion of long-term borrowings Income taxes payable Provision for income taxes Unearned revenue Deferred income Provision for bonuses Employees' bonuses Asset retirement obligations - current - Other Other current liabilities Total current liabilities Total current liabilities Noncurrent liabilities Long-term liabilities: Long-term loans payable Long-term borrowings Long-term unearned revenue Deferred income Provision for retirement benefits Employees' retirement benefits Negative goodwill Negative goodwill Asset retirement obligations - noncurrent Asset retirement obligations Other Other non-current liabilities Total noncurrent liabilities Total long-term liabilities Total liabilities Total liabilities Net assets Net assets: Shareholders' equity Shareholders' equity Capital stock Common stock: Capital surplus Capital surplus Retained earnings Retained earnings Total shareholders' equity Total shareholders' equity Accumulated other comprehensive income - Net unrealized gains (losses) on investment securities, net Valuation difference on available-for-sale securities of tax Foreign currency translation adjustment Foreign currency translation adjustments Total accumulated other comprehensive income - Subscription rights to shares Stock options Minority interests Non-controlling interest Total net assets Total net assets Total liabilities and net assets Total liabilities and net assets - 10 -
  • 14. (2) Quarterly consolidated statements of (comprehensive) income (Quarterly consolidated statement of income) Quarterly Consolidated Financial Results Offering Circular Net sales Revenues Cost of sales Cost of sales Gross profit Gross profit Selling, general and administrative expenses Selling, general and administrative expenses Operating income Operating income Non-operating income Other income (expense): Interest income Interest income Amortization of negative goodwill Negative goodwill amortization Miscellaneous income - Total non-operating income - Non-operating expenses - Interest expenses Interest expense Foreign exchange losses Foreign exchange gains (losses) Equity in losses of affiliates Equity in earnings (losses) of affiliates Miscellaneous expenses - Total non-operating expenses - Ordinary income - Extraordinary income - Gain on sales of noncurrent assets Gain (loss) on sales/disposal of fixed assets Gain on change in equity - Total extraordinary income - Extraordinary loss - Loss on sales and retirement of noncurrent assets Gain (loss) on sales/disposal of fixed assets Impairment loss Impairment losses Loss on change in equity - Total extraordinary losses - Income before income taxes and minority interests Income before income taxes Income taxes Income taxes Income before minority interests Income before minority interest Minority interests in loss Non-controlling interest in net income (loss) Net income Net income - 11 -
  • 15. (3) Quarterly consolidated statements of cash flows Quarterly Consolidated Financial Results Offering Circular Operating activities Operating activities Income before income taxes and minority interests Income before income taxes Depreciation and amortization Depreciation and amortization Amortization of goodwill Goodwill amortization Amortization of negative goodwill Negative goodwill amortization Decrease in allowance for doubtful accounts Increase (decrease) in allowance for doubtful accounts Decrease in provision for bonuses Increase (decrease) in provision for employees' bonuses Decrease in provision for retirement benefits Decrease in provision for retirement benefit expenses Interest and dividends income Interest and dividend income Interest expenses Interest expense Foreign exchange losses Foreign exchange (gains) losses Impairment loss Impairment losses Equity in losses of affiliates Equity in losses of affiliates Decrease in notes and accounts receivable-trade Increase in accounts receivable- trade Increase in other current assets Decrease (increase) in other current assets Decrease in notes and accounts payable-trade Increase in accounts payable- trade Decrease in unearned revenue Increase (decrease) in deferred income Decrease in other current liabilities Increase (decrease) in other current liabilities Other, net Other - net Subtotal Subtotal Interest and dividends income received Interest and dividends received Interest expenses paid Interest paid Income taxes paid Income taxes paid Net cash provided by operating activities Net cash provided by operating activities Investing activities Investing activities Increase in time deposits Decrease (increase) in time deposits Increase in short-term investment securities Decrease (increase) in short-term investment securities Purchase of property, plant and equipment Purchases of property, plant and equipment Proceeds from sales of property, plant and equipment Proceeds from sales of property, plant and equipment Purchase of intangible assets Purchases of intangible assets Payments for long-term prepaid expenses with increase Increase in long-term prepaid expenses Payments of short-term loans receivable Payments of short-term loans receivable Collection of short-term loans receivable Collection of short-term loans receivable Collection of long-term loans receivable Collection of long-term loans receivable Purchase of investment securities Purchases of investment securities Proceeds from sales of investment securities Proceeds from sales of investment securities Purchase of investments in subsidiaries Purchases of shares of subsidiaries Purchase of stocks of subsidiaries and affiliates Purchase of shares of affiliates Purchase of investments in subsidiaries resulting in change in Proceeds from purchase of investments in subsidiaries scope of consolidation resulting in change in scope of consolidation Payments for transfer of business - Payments for deposit pledged as collateral Payments of deposits pledged as collateral Proceeds from deposit released from collateral Proceeds from withdrawal of deposits pledged as collateral Other, net Other - net Net cash used in investing activities Net cash used in investing activities Financing activities Financing activities Increase in short-term loans payable Proceeds from short-term borrowings Proceeds from long-term loans payable Proceeds from long-term borrowings Repayment of long-term loans payable Repayments of long-term borrowings Repayments of finance lease obligations Repayments of lease obligations Proceeds from exercise of stock option - Other, net Other - net Net cash provided by financing activities Net cash provided by (used in) financing activities Effect of exchange rate change on cash and cash equivalents Effect of exchange rate changes on cash and cash equivalents Net decrease in cash and cash equivalents Net increase in cash and cash equivalents Cash and cash equivalents at beginning of period Cash and cash equivalents at beginning of year Cash and cash equivalents at end of period Cash and cash equivalents at end of year - 12 -