SlideShare una empresa de Scribd logo
1 de 23
Descargar para leer sin conexión
© Michael Brydon (mjbrydon@sfu.ca)
Last update: 02-May-01 1 o f 23
Lesson 3: An introduction to data modeling
3.1 Introduction: The importance of
conceptual models
Before you sit down in front of the keyboard
and start creating a database application, it is
critical that you take a step back and consider
your business problem—in this case, the kitchen
supply scenario presented in Lesson 2— from a
conceptual point of view. To facilitate this
process, a number of conceptual modeling
techniques have been developed by computer
scientists, psychologists, and consultants.
For our purposes, we can think of a
conceptual model as a picture of the
information system we are going to build.
To use an analogy, conceptual models are
to information systems what blueprints
are to buildings.
There are many different conceptual modeling
techniques used in practice. Each technique
uses a different set of symbols and may focus on
a different part of the problem (e.g., data,
processes, information flows, objects, and so
on). Despite differences in notation and focus,
however, the underlying rationale for
conceptual modeling techniques is always the
same: understand the problem before you start
constructing a solution.
There are two important things to keep in mind
when learning about and doing data modeling:
1. Data modeling is first and foremost a tool
for communication.Their is no single “right”
model. Instead, a valuable model highlights
tricky issues, allows users, designers, and
implementors to discuss the issues using the
same vocabulary, and leads to better design
decisions.
2. The modeling process is inherently
iterative: you create a model, check its
assumptions with users, make the necessary
changes, and repeat the cycle until you are
sure you understand the critical issues.
In this background lesson, you are going to use a
data modeling technique—specifically, Entity-
Relationship Diagrams (ERDs)—to model the
business scenario from Lesson 2. The data
model you create in this lesson will form the
foundation of the database that you use
throughout the remaining lessons.
?
Introduction: The importance of conceptualAn introduction to data modeling
3.1.1 What is data modeling?
A data model is a simply a diagram that
describes the most important “things” in your
business environment from a data-centric point
of view. To illustrate, consider the simple ERD
shown in Figure 3.1. The purpose of the diagram
is to describe the relationship between the data
stored about products and the data stored
about the organizations that supply the
products.
3.1.1.1 Entities and attributes
The rectangles in Figure 3.1 are called entity
types (typically shortened to “entities”) and
the ovals are called attributes. The entities are
the “things” in the business environment about
which we want to store data. The attributes
provide us with a means of organizing and
structuring the data. For example, we need to
store certain information about the products
that we sell, such as the typical selling price of
the product (“Unit price”) and the quantity of
the product currently in inventory (“Qty on
hand”). These pieces of data are attributes of
the Product entity.
It is important to note that the precise manner
in which data are used and processed within a
particular business application is a separate
issue from data modeling. For example, the
data model says nothing about how the value of
“Qty on hand” is changed over time. The focus
in data modeling is on capturing data about the
environment. You will learn how to change this
data (e.g., process orders so that the inventory
values are updated) once you have mastered
the art of database design.
A data modeler assumes that if the right
data is available, the other elements of
the application will fall into place
effortlessly and wonderfully. For now, this
is a good working assumption.
FIGURE 3.1: An ERD showing a relationship
between products and suppliers.
Product
supplied
by
Supplier
Unit price
ProductID
Qty on hand
Name
Address
Entity
Attributes
Relationship
Cardinality
?
Introduction: The importance of conceptualAn introduction to data modeling
3.1.1.2 Notation for relationships
In addition to entities and attributes, Figure 3.1
shows a relationship between the two entities
using a line and a diamond. The relationship
construct is used—not surprisingly—to indicate
the existence or absence of a relationship
between entities. A crow’s foot at either end of
a relationship line is used to denote the
cardinality of the relationship.
For example, the crow’s foot on the product
side of the relationship in Figure 3.1 indicates
that a particular supplier may provide your
company with several different products, such
as bowls, spatulas, wire whisks and so on. The
absence of a crow’s foot on the supplier side
indicates that each product in your inventory is
provided by a single supplier. Thus, the
relationship in Figure 3.1 indicates that you
always buy all your wire whisks from the same
company.
3.1.1.3 Modeling assumptions
The relationship shown in Figure 3.1 is called
one-to-many: each supplier supplies many
products (where many means “any number
including zero”) but each product is supplied by
one supplier (where “one” means “at most
one”).
The decision to use a one-to-many relationship
reflects an assumption about the business
environment in which your wholesale company
operates. However, it is easy to imagine a
different environment in which each product is
supplied by multiple suppliers. For example,
many suppliers may carry a particular brand of
wire whisk. When you run out of whisks, it is up
to you to decide where to place your order. In
other words, it is possible that a many-to-many
relationship exists between suppliers and
products.
If multiple supplier exist, attributes of the
product, such as its price and product number
may vary from supplier to supplier. In this
situation, the data requirements of a many-to-
many environment are slightly more complex
than those of the one-to-many environment. If
you design and implement your database around
the one-to-many assumption but then discover
that certain goods are supplied by multiple
suppliers, much effort is going to be required to
fix the problem.
Herein lies the point of drawing an ERD:
The diagram makes your assumptions
about the relationships within a particular
business environment explicit before you
start building things.
3.1.1.4 The role of the modeler
In the environment used in these tutorials, you
are the user, the designer, and the implementor
?
Introduction: The importance of conceptualAn introduction to data modeling
of the system. In a more realistic environment,
however, these roles are played by different
individuals (or groups) with different
backgrounds and priorities. For example, a
common stereotype of implementors
(programmers, database specialists, and so on)
is that they seldom leave their cubicles to
communicate with end-users of the software
they are writing. Similarly, it is generally safe to
assume that users have no interest in, or
understanding of, low-level technical details
(such as the cardinality of relationships on
ERDs, mechanisms to enforce referential
integrity, and so on). Thus, it is up to the
business analyst to bridge the communication
gap between the different groups involved in
the construction, use, and administration of an
information system.
As a business analyst (or more generally, a
designer), it is critical that you walk through
your conceptual models with users and make
sure that your modeling assumptions are
appropriate. In some cases, you may have to
examine sample data from the existing
computer-based or manual system to determine
whether (for instance) there are any products
that are supplied by multiple suppliers.
At the modeling stage, making changes such as
converting a one-to-many relationship to a
many-to-many relationship is trivial—all that is
required is the addition of a crow’s foot to one
end of the relationship, as shown in Figure 3.2.
In contrast, making the same change once you
have implemented tables, built a user
interface, and written code is a time-consuming
and frustrating chore.
Generally, you can count on the 10× rule
of thumb when building software: the
cost of making a change increases by an
order of magnitude for each stage of the
systems development lifecycle that you
complete.
FIGURE 3.2: An ERD for an environment in
which there is a many-to-many relationship
between products and suppliers.
Product
supplied
by
Supplier
Unit price
ProductID
Qty on hand
Name
Address
The addition of a
second crow’s
foot transforms
the one-to-many
relationship into a
many-to-many
relationship.
!
Introduction: The importance of conceptualAn introduction to data modeling
3.1.2 Core modeling constructs and notation
Data modelers typically adopt a set of
notational conventions so that their diagrams
are consistent. For example, large IT
organizations and consultancies typically adopt
a methodology1—a set of tools and procedures
for applying the tools that specifies the
notation used within the organization. Enforcing
standardization in this way facilitates teamwork
on large projects. Similarly, if a computer-
aided software engineering (CASE) tool is used
for conceptual modeling and design, notational
conventions are often enforced by the software.
What follows is a brief summary of the
notational conventions that I use when drawing
ERDs. Keep in mind, however, that ERDs are first
and foremost a tool for communication between
humans. As such, the precise notation you use is
not particularly important as long as people can
read and understand the diagrams. With
experience, you will come to realize that
differences in the shapes of the boxes and lines
have little effect on the core concepts of data
modeling.
3.1.2.1 Entities
Entities are drawn as rectangular boxes
containing a noun in singular form, as shown in
Figure 3.3.
You will see later that each entity you draw
ultimately becomes a table in your database.
You might want to keep this transformation
from entity to table in mind when selecting the
names of your entities. For example, your
entity names should be short but descriptive.
3.1.2.2 Relationships
A relationship between entities is drawn as a
line bisected by a diamond. The diamond
contains a verb (or short verb phrase) that
describes the nature of the relationship
between the entities, as shown in Figure 3.4.
Named relationships are used to make the ERDs
more readable. However, unlike entity names,
relationship names never show up in the final
database. Consequently, it does not really
matter how you label your relationships, as long1
It can be argued that the term “method” is
grammatically preferable. In Europe, for example,
the term “method” tends to be favored.
Customer
FIGURE 3.3: An entity named “Customer”.
Introduction: The importance of conceptualAn introduction to data modeling
as the labels make the diagram easier to
interpret.
To illustrate, consider the relationship between
products and suppliers shown in Figure 3.1. The
relationship is described by the verb phrase
“supplied by”. Although one could have opted
for the shorter relationship name “has” instead,
the resulting diagram (e.g., “Supplier has
product”) would be more difficult for readers of
the diagram to interpret.
3.1.2.3 Relationship direction
One issue that sometimes troubles neophyte
data modelers is that the direction of the
relationship is not made explicit on the
diagram. Returning to Figure 3.1, it is obvious
to me (since I drew the diagram) that the
relationship should be read: “Product is
supplied by supplier.” Reading the relationship
in the other direction (“Supplier is supplied by
product”) makes very little sense to anyone who
is familiar with the particular problem domain.
Generally, ERDs make certain assumptions
about the reader’s knowledge of the underlying
business domain.
A notational convention supported by
some CASE tools is to require two names
for each relationship: one that makes
sense in one direction (e.g., “is supplied
by”), and another that makes sense in the
opposite direction (e.g., “supplies”).
Although double-naming may make the
diagram easier to read, it also adds
clutter (twice as many labels) and
imposes an additional burden on the
modeler.
3.1.2.4 Cardinality
As discussed in Section 3.1.1.2, the cardinality
of a relationship constrains the number of
instances of one entity type that can be
associated with a single instance of the other
entity type.
The cardinality of relationships has an
important impact on number and
structure of the tables in the database.
Consequently, it is important to get the
cardinality right on paper before starting
the implementation.
buys
FIGURE 3.4: A relationship named “buys”.
?
!
Introduction: The importance of conceptualAn introduction to data modeling
There are three fundamental types of
cardinality in ERDs:
• One-to-many — You have already seen an
example of a one-to-many relationship in
Figure 3.1. You will soon discover that one-
to-many relationships are the bread and
butter of relational databases.
• One-to-one — At this point in your data
modeling career, you should avoid one-to-
one relationships. To illustrate the basic
issue, consider the ERD shown in Figure 3.5.
Based on an existing paper-based system,
the modeler has assumed that each
customer is associated with one “customer
record” (i.e., a paper form containing
information about the customer, such as
address, fax number, and so on). Clearly,
each customer has only one customer
record and each customer record belongs to
a single customer. However, if we automate
the system and get rid of the paper form,
then there is no reason not to combine the
Customer and Customer Record entities into
a single entity called Customer.
In many cases, one-to-one relationships
indicate a modeling error. When you have
a one-to-one relationship such as the one
shown in Figure 3.5, you should combine
the two entities into a single entity.
• Many-to-many — The world is full of many-
to-many relationships. A well-used example
is “Student takes course.” Many-to-many
relationships also arise when you consider
the history of an entity. To illustrate,
consider the ERD shown in Figure 3.6. At
first glance, the relationship between
Family and Single-Family Dwelling (SFD)
might seem to be one-to-one since a
particular family can only live in one SFD at
a time and each SFD can (by definition) only
contain a single family. However, it is
possible for a family to live in different
houses over time. Similarly, it is possible
that many families inhabit a particular
house over the years. Thus, if the concept
of time is considered, the relationship
becomes many-to-many.
We will discuss how you go about determining
cardinality in subsequent sections. At this point,
it is sufficient to recognize that there are two
!
FIGURE 3.5: An incorrect one-to-one
relationship
Customer associated
with
Customer
Record
Introduction: The importance of conceptualAn introduction to data modeling
popular (and equivalent) approaches to
denoting “one” and “many” on an ERD: the
crow’s foot notation you have already seen and
the “1:N” notation.
1. Crow’s foot notation — In the crow’s foot
notation, three little lines (resembling a
crow’s foot) are used to indicate “many”.
Not surprisingly, the absence of a crow’s
foot indicates “one”. Thus, the relationship
in Figure 3.7 indicates that “each product is
supplied by at most one supplier,” whereas
“each supplier may supply many products.”.
2. 1:N notation — In the 1:N notation, the
symbol “N” (and/or “M”) is used to indicate
“many” whereas “1” is used to indicate
“one”. An example of the 1:N notation is
shown in Figure 3.8.
The ERD model also supports additional
cardinality information in the form of
cardinality constraints. To keep things
simple, however, the discussion of
cardinality constraints is deferred until
Section 6.3.2.
3.1.2.5 Attributes
Attributes are properties or characteristics of a
particularly entity about which we wish to
collect and store data. In addition, there is
typically one attribute that uniquely identifies
particular instances of the entity. For example,
each of your customers may have a unique
customer ID. Such attributes are known as key
attributes.
FIGURE 3.6: What is the cardinality of this
relationship?
Family lives
in
Single-
Family
Dwelling
Product supplied
by
Supplier
FIGURE 3.7: A one-to-many relationship in
crow’s foot notation
Product supplied
by
Supplier
N 1
FIGURE 3.8: A one-to-many relationship in
1:N notation
?
Learning objectives
9 o f 23
An introduction to data modeling
For ERDs that are drawn manually, attributes
are traditionally shown as ovals containing the
name of the attribute. If the attribute is a key,
it is typically underlined. A number of
attributes for the Customer entity are shown in
Figure 3.9.
Adding attributes to ERDs can result in
very cluttered diagrams. Some CASE tools
list the attributes inside the entity
rectangle (see the discussion of CASE
tools in Section 3.4.5). Another way to
reduce clutter is to only show a handful of
critical attributes on the diagram.
3.2 Learning objectives
! understand the core constructs of the
entity-relationship model
! create an ERD based on your
understanding of a business scenario
! use associative entities to add
attributes to relationships
! gain some familiarity with the role of
data modeling and CASE tools in the
development process
3.3 Exercises
In the sections that follow, we step through the
construction of an ERD for the kitchen supply
scenario. By following along, you should gain a
better understanding of the basic techniques
involved in data modeling as well as some of the
design pitfalls that should be avoided.
If this lesson was on how to play golf, you
would not read it and then assume that
you are a good golfer. Golf is a skill that
requires both theoretical knowledge and
hours of practice. Thus, the only way to
become a good golfer is to acquire a solid
understanding of the fundamentals and
then go out and hit thousands of balls.
The same principles apply to data
modeling.
3.3.1 Starting simple
Let us begin with the simplest and most
essential statement one can make about the
Customer
CustID
Name Phone No.
Contact person
FIGURE 3.9: A number of attributes of the
Customer entity are shown in ovals.
?
!
Exercises
10 o f 23
An introduction to data modeling
wholesaling environment: customers buy
products. It is natural that you would want to
both automate and informate (recall
Section 2.4) this important business process.
3.3.1.1 Step one: identify the entities
Entities are physical things, organizations, roles
and events about which we want to store
information. In the wholesaling scenario, two
entities are immediately obvious: Customer and
Product. However, before we add the entities to
our diagram, it is important that we have a firm
understanding of what exactly these entities
correspond to in the real world:
1. Customers — In the wholesaling
environment, a customer is an organization,
not a person. There may be a single person
at the organization through whom we
conduct our business. We will refer to this
person as the “contact person” for the
customer in order to maintain a clean
distinction between people and
organizations.
2. Products — It is not immediately clear
whether the Product entity refers to a
specific item or a class of similar items. For
example, one of the products you sell is the
“Fat Cat” mug. The Product ID of the mug is
“88 4017” and it normally sells for $5.50.
Note, however, that there are many
individual “Fat Cat” mugs and each one is
slightly different due to irregularities,
variations in painting, and so on. In our
case, there are advantages to ignoring the
individuality of each mug and treating them
all as a single group of interchangeable
items. Thus, when we talk about “a
product” or “a SKU”, we are talking about
an entire class of similar instances, not
individual instances themselves.1
Having made these assumptions explicitly, we
can now create our first ERD.
➨ Take out a piece of paper and a pencil.
Unless you have a special-purpose CASE
tool, it is seldom worth the effort to draw
the early drafts of your conceptual
models on a computer.
ERDs typically require many modifications
so you should not invest much time
making your diagrams look nice. In fact,
the diagram you are about to begin will
1
In some environments, it may be necessary to treat
products as individual items. For example, in the
aerospace industry, there is a requirement to track
individual parts by serial number in case a part fails.
The requirement for “unit effectivity” necessitates a
different set of assumptions about the Product entity
and thus leads to a different database design.
?
!
Exercises
11 o f 23
An introduction to data modeling
end up the in recycle bin by the end of
the lesson.
➨ Add the Customer and Product entities to
your diagram, as shown in Figure 3.10.
3.3.1.2 Steptwo:specify arelationshipbetweenthe
entities
We know that customers buy products and that
products are bought by customers. It is a simple
matter to create a relationship to communicate
this fact.
➨ Add a relationship line between the
Customer and Product entities.
➨ Label the relationship “buys”, as shown in
Figure 3.11.
Unlike flow charts, the arrangement of
boxes and the direction of lines in an ERD
have no significance—any arrangement
that fits on the page is valid. Similarly,
the relationship line does not denote any
type of sequence or flow of information.
3.3.1.3 Step three: determine the cardinality of the
relationship
Each customer can buy many products—indeed,
that is the whole purpose of being in this line of
business. To show this possibility on our ERD, we
add a crow’s foot to the Product side of the
relationship line.
Similarly, each product can be purchased by
many customers. For example, a number of our
customers may chose to stock the “Fat Cat”
mug (keeping in mind that the product refers to
a style of mug, not an individual mug). As a
result, a crow’s foot is added to the Customer
side of the relationship.
➨ Designate the “buys” relationship as many-
to-many using the crow’s foot notation, as
shown in Figure 3.12.
FIGURE 3.10: Add the first two entities to
your ERD.
Customer Product
?
FIGURE 3.11: Add a relationship between
the two entities.
Customer Productbuys
Exercises
12 o f 23
An introduction to data modeling
3.3.1.4 Step four: identify a few important attributes
There is a need to find a balance between the
descriptiveness of the ERD and the ease with
which others can decipher it. As such, I prefer
to show only a handful of attributes on the
ERDs.
➨ Add a small number of important attributes
to your diagram, as shown in Figure 3.13.
By adding attributes such as “Qty on hand” to
the Product entity, it is clear that the entity
refers to a class of products, not an individual
product. In contrast, if “Serial number” were
added to the diagram as an attribute instead of
“Qty on hand”, the reader of the ERD would
come to a different conclusion about the
meaning of the Product entity.
3.3.2 Dealing with many-to-many
relationships
Although the diagram in Figure 3.13 is
technically correct, it is missing a great deal of
information about how a purchase transaction
occurs in reality.
To illustrate, consider the attribute “Unit price”
belonging to the Product entity. Unit price
contains the default selling price of the
product. To understand why it is the default
price, consider the case of a “Fat Cat” mug that
typically sells for $5.50. What if there is a
FIGURE 3.12: Indicate the many-to-many
cardinality of the relationship.
Customer Productbuys
Add a crow’s foot to the customer
side to indicate that each product
is purchased by many customers.
1111
Add a second crow’s foot to the
product side to indicate that each
customer purchases many products.
2222
FIGURE 3.13: An initial ERD for the kitchen
supply environment.
Customer Productbuys
ProductID
Unit price Qty on hand
CustID
Name Contact person
Exercises
13 o f 23
An introduction to data modeling
particular mug that has a minor flaw? Although
the mug can still be sold, the customer may
expect a discounted price to compensate for
the flaw. The question is therefore: Where on
the diagram do we indicate the actual selling
price of a particular mug?
A second example is the purchase quantity.
What if the customer purchases a dozen “Fat
Cat” mugs? Where is this information recorded?
The “Qty ordered” attribute does not belong to
the Customer entity because customers order
many products besides mugs. Similarly, “Qty
ordered” does not belong to the Product entity
because different customers may order
different quantities.
This is a problem that typically arises in many-
to-many relationships: There are certain
important attributes that do not seem to belong
to either of the entities participating in the
relationship. The solution is to assign the
attributes to the relationship itself.
3.3.2.1 Attributes of relationships
The issues surrounding price and order quantity
arise because the attributes belong to the
interaction of the entities in the many-to-many
relationship. Thus, the price of a flawed mug is
an attribute of a particular product being sold
to a particular customer on a particular day.
To summarize, there are a number of attributes
that should be attached to the “buys”
relationship in Figure 3.13:
• Date — the date on which the purchase is
made;
• Actual price — the price at which the item
(or multiple items within the same class of
products) are actually sold to the customer;
• Quantity ordered — the number of items
with a certain product ID requested by the
customer; and,
• Quantity shipped — the actual number of
items shipped to the customer.
3.3.2.2 Associative entities
Given the number and importance of the
attributes attached to the “buys” relationship,
it makes sense to treat the relationship as an
entity in its own right. To transform a
relationship into an entity on an ERD, we use a
special symbol called an associative entity. The
notation for an associative entity is a
relationship diamond nested inside of an entity
rectangle, as shown in Figure 3.14.
To transform your many-to-many relationship
(without attributes) into an associative entity
(with attributes), do the following:
Exercises
14 o f 23
An introduction to data modeling
➨ Draw a rectangle around the “buys”
relationship.
➨ Replace the relationship name “buys” with
an appropriate noun, for example “Sale”.
Remember, entities—including associative
entities—are named with nouns.
➨ Decompose the many-to-many relationship
into two one-to-many relationships.
➨ Add the attributes to the associative entity,
as shown in Figure 3.14.
Although Sale is now treated as an entity,
there is no requirement to add
relationship diamonds between Product
and Sale or Customer and Sale. An
associative entity serves as an entity and
a relationship at the same time.
The meaning of the Sale associative entity in
Figure 3.14 is the following: Each customer can
be involved in many sales transactions, but each
individual sales transaction involves only one
customer. Similarly, each product can be
involved in many sales transactions, but each
sales transaction involves only one type of
product.
3.3.2.3 Illustration
To better understand how an associative entity
works, it is worthwhile to jump ahead a bit and
consider what the data might look like. In
Figure 3.15, sample data for the Customer,
Product, and Sale entities are shown. There are
a couple of interesting things to notice about
the sample data:
1. Each entity contains information relevant to
that entity only. For example, Customer
only contains information about customers;
Product only contains information about
products, and so on.
2. Each row in the Sale entity shows the
details of a single sales transaction. Each
sales transaction consists of a particular
product being sold to a particular customer.
The transaction-specific information (such
FIGURE 3.14: Transform a many-to-many
relationship into an associative entity.
Customer ProductSale
DateQuantity ordered
Quantity shipped Actual price
?
!
Exercises
15 o f 23
An introduction to data modeling
as the actual selling price and quantity
ordered) are attributes of the Sale entity.
3. By using the data for the Sale entity, it is
possible to determine which products have
been purchased by a particular customer.
Similarly, it is possible to determine which
customers have purchased a particular
product.
4. Only the minimum amount of information
required to identify the customer and
product is included in the Sale associative
entity. For example, neither the name of
the customer or the description of the
product appear in Sale since this
information can easily be found elsewhere
using the values of Customer ID and
Product ID respectively. In the context of
FIGURE 3.15: Data showing the role of an associative entity
Each customer can
participate in many
sales transactions.
Each product can
participate in many
sales transactions.
Customer Product
Sale
Exercises
16 o f 23
An introduction to data modeling
the Sale entity, the Customer ID and
Product ID attributes are called foreign
keys (foreign keys are so important that
Lesson 6 is devoted to the topic).
3.3.3 Revising the ERD
There is an important problem with the ERD as
its now stands. The constraint that each sales
transaction involves only a single product
appears to be at odds with the reality of the
business situation described in Lesson 2. For
example, the “sales transactions” with which
we are most familiar—the customer orders you
receive by fax— typically request many
different products: a dozen “Fat Cat” mugs,
two dozen spatulas, some wire whisks, and so
on. The mismatch between the diagram and the
business environment means that the ERD must
be revised.
3.3.3.1 Identifying the problem
The problem with the ERD in Figure 3.14 is that
ignores the technology (broadly speaking) used
by customers to place orders. Specifically,
customers normally wait until they need enough
stock to make an order worthwhile. In addition,
factors such as minimum order values and
shipping costs favor the batching of small,
single-product orders into large, multi-product
orders.
By taking the technology used for ordering into
account, it becomes clear that we have failed
to model an important event entity: the arrival
of an order.
Be careful—not all pieces of paper in the
existing business process are
automatically event entities. For
example, the invoices that we send to our
customers are more properly thought of
as reports (which can be generated from
the information already contained in
other entities). With practice, the
distinction between entities and non-
entities will become clear.
3.3.3.2 Adding the new entity
In this section, you are going to modify your ERD
to include an Order entity.
➨ Create a new ERD consisting of entities for
customers, orders and products.
Here is where a CASE tool pays off: you
can delete entities or move entities
around the screen and the relationships
and connector lines follow automatically.
➨ Create relationships to reflect the fact that
customers place orders and orders consist
of products.
!
?
Exercises
17 o f 23
An introduction to data modeling
➨ Add cardinality symbols to reflect the fact
that each customer can place many orders,
but each order belongs to a single customer.
➨ Add cardinality symbols to reflect the fact
that each order can contain many products
and each product may be contained in many
orders.
➨ Add a handful of attributes to the diagram
to help clarify the meaning of the entities.
The resulting ERD is shown in Figure 3.16.
3.3.3.3 Creating OrderDetails
Although Figure 3.16 is a great improvement
over our previous ERD, much of the same
information missing from Figure 3.13—such as
actual price and quantity ordered—is missing
from the new ERD. As a consequence, we must
transform the “contains” relationship into an
associative entity with its own attributes.
➨ Transform the “contains” relationship into
an associative entity using the procedure
described in Section 3.3.2.2.
To remain consistent with MICROSOFT’s
sample databases, I recommend using the
name “Order Detail” for the associative
entity. Alternatives include “Line Item”
and “Order Item”.
The resulting ERD is shown in Figure 3.17. To
help understand the relationship between the
Order entity and the Order Detail associative
entity, look at the orders included in the project
package. Each order has header information
(such as customer, order date, and so on) and
multiple order details. Each detail has
information such as quantity ordered, quantity
shipped, and price.
?
FIGURE 3.16: Revise the ERD to include an
Order entity.
Customer
Product
places Order
contains
ProductID
Unit price
Qty on hand
CustID Name
Contact person
OrderID
Date
Discussion
18 o f 23
An introduction to data modeling
3.4 Discussion
3.4.1 Logical versus physical models
A distinction is typically made between logical
and physical data models:
• Logical data models — logical models
capture general information about entities
and relationships and are used for
communication with business users.
• Physical data models — physical models
serve as a precise specification for the
implemented system. As a consequence,
the models must take into account the
technology used to store the data. For
example, a given logical data model
translates into very different physical data
models depending on whether the target
technology is a file-based system, a
relational database, or an object-oriented
database.
Normally, you start with a high-level logical
model and refine with the help of users over
several iterations. Once you are happy with the
logical model, you transform it into a physical
model and hand it to a database administrator
(DBA) for implementation as a database.
For relational databases, the translation
process from logical to physical is relatively
straightforward and involves the following
steps:
1. Decompose all many-to-many
relationships — Since the relational
database model does not support many-to-
many relationships, you must replace all
many-to-many relationships with
associative entities as described in
Section 3.3.2.2.
FIGURE 3.17: Create an associative entity to
model individual order details.
Customer
Product
places Order
ProductID
Unit price
Qty on hand
CustID Name
Contact person
OrderID
Date
Order
detail
Actual price
Quantity ordered
Quantity shipped
Discussion
19 o f 23
An introduction to data modeling
2. Add attributes — The data model should be
“fully attributed” before handing it over to
a DBA.
3. Identify primary keys — Each entity
requires an attribute that uniquely
identifies instances.
4. Add foreign keys — In relational databases,
relationships between entities are
implemented using foreign keys.
At this point, it is not critical that you
understand each of these steps (you will get lots
of practice in subsequent lessons). What is
important is that you understand that there is a
clear progression from high-level, graphical,
conceptual models to low-level database
schemas.
3.4.2 ERDs versus the ACCESS relationship
window
If you have used the relationship window in
MICROSOFT ACCESS, you know that the relationship
diagrams used by ACCESS resemble ERDs. The
primary differences between the two are
• The relationships between tables are not
named in ACCESS.
• Many-to-many relationships are not
supported. That is, the relationships
window permits physical data models only.
• ACCESS uses the symbols “1” and “∞” instead
of “1” and “N”, as shown in Figure 3.18.
3.4.3 Why do I need to know about data
modeling?
Clearly, you do not need to know the intricacies
of data modeling to start using a database
package such as MICROSOFT ACCESS. In fact,
MICROSOFT has gone through great lengths
FIGURE 3.18: The relationship window in
ACCESS uses a notation similar to that used in
ERDs.
The ACCESS relationship window supports
physical data modeling. One-to-many
relationships are denoted using “1” and “∞”.
Discussion
20 o f 23
An introduction to data modeling
between the release of ACCESS version 2.0 and
ACCESS 2000 to make the product more
accessible to data modeling neophytes. For
example, there is a table analyzer, a table
design wizard, and all sorts of other aids
intended to automate the database design
process. In my view, there are three problems
with MICROSOFT’s “dumbing-down” strategy:
1. No wizard or add-in tool is going to change
the fact that database management systems
(DBMSs) are specialized software packages
that presuppose an enormous amount of
prior knowledge. Even the error messages
generated by ACCESS (as you will soon
discover) can only be understood if you
have a firm grasp on the theoretical
fundamentals of the relational database
model. For example, what do you do when
you accidentally violate a “referential
integrity constraint”? What is a “primary
key”? What is an “ambiguous outer join”?
2. Trends in application development
increasingly emphasize data and de-
emphasize programming. Thus, a solid
understanding of your data is critical. Put
another way, just about anyone can build a
reasonably sophisticated system if the
underlying database is well designed
(indeed, by doing these tutorials, you will
see just how far you can go without writing
a single line of programming code). In
contrast, if the database design is poor, you
will have to be a programming wizard just
to create the illusion that the application
works.
3. CASE tools from vendors such as ORACLE,
COMPUTER ASSOCIATES, VISIO (now part of
MICROSOFT), and many others translate ERDs
directly into database tables. Thus, if you
know how to draw diagrams similar to the
one shown in Figure 3.17, you know how to
design databases.
In short, the last thing you want to do is rely on
wizards to shelter you from the database design
process. Instead, you want to get in at the
nitty-gritty level and understand the trade-offs
between various designs. Once the design is
complete you can use wizards and shortcuts for
everything else.
3.4.4 How do I learn about data modeling?
One important problem that I perceive as a
university professor is that despite the
importance of data modeling, it is very difficult
to find good practical training as a data
modeler.
In the standard computer science database
course, we tend to focus on theoretical issues
such as relational algebra, set theory, indexing,
normalization, and so on. Although such
knowledge is certainly important for DBAs and
Application to the project
21 o f 23
An introduction to data modeling
other technical professionals, it provides little
guidance when we are faced with real-world
modeling problems.
Conversely, the introductory information
systems (IS) courses that we offer in business
schools provide only cursory treatment of data
modeling and database design. I suppose the
rationale is that it should be possible to hire a
computer science graduate to do the data
modeling!
3.4.5 CASE tools and the design process
Computer-aided software engineering (CASE)
tools are software packages that simplify the
process of creating conceptual models. In
addition, some CASE packages are more than
just drawing tools: they translate the data
models into database tables, programming code
templates, and so on.
To illustrate, consider the diagram in
Figure 3.19 which was drawn using the
“database modeling tool” in VISIO ENTERPRISE.
The database modeling tool allows a designer to
start with a a physical ERD-like diagram and add
implementation-level metadata (data about
data). For example, in Figure 3.20, the
physical-level properties of the ActualPrice
attribute are specified in a dialog box.
Once the physical-level metadata has been
added to the model, many CASE tools can
generate table schemas for the target
database. For example, ORACLE DESIGNER can
generate structured query language (SQL) data
definition commands for ORACLE databases. VISIO
ENTERPRISE can generate SQL or create the tables
in various database packages (including ACCESS)
directly.
Given CASE tools with this type of functionality,
it is clear that the most important skill for
database designers is not a complete knowledge
of SQL syntax. Instead, it is the ability to
analyze a real-world problem and create a data
model that accurately and elegantly captures
the critical elements of the problem.
3.5 Application to the project
➨ Complete your own ERD for the order entry
scenario. Remember that at this point, the
scope of the project is very limited. It will
be expanded somewhat in subsequent
lessons.
HINT: If you get stuck, you can refer to the VISIO
diagram in Figure 3.19. Keep in mind,
however, that Figure 3.19 is a physical
ERD; you should be working with logical
ERDs at this stage of the development
process.
Application to the project
22 o f 23
An introduction to data modeling
CustName
BillingAddress
City
ProvState
PostalCode
RegionCode
ContactPerson
ContactPhone
OnLineOrdering
CustID
Customer
CustID
OrderDate
Processed
OrderID
Order
places
QtyOrdered
QtyShipped
ActualPrice
OrderID
ProductID
OrderDetail
consists of
Description
Unit
UnitPrice
QtyOnHand
ProductID
Product
is a
FIGURE 3.19: An physical database model for the kitchen supply environment created using a CASE
tool.
VISIO ENTERPRISE can
be used to draw
various styles of
logical and physical
data models. This is
an example of a
physical model.
Attributes are
shown within the
body of the entity
and primary keys
are shown in bold.
Crow’s foot
notation is used
indicate the
cardinality of the
relationships.
Since this is a physical database diagram, there
are no many-to-many relationships or associative
entities. For example, the Order Detail associative
entity is shown as a regular entity.
Application to the project
23 o f 23
An introduction to data modeling
FIGURE 3.20: A CASE tool can be used to add implementation details to a graphical model.
The implementation details of
each attribute can be saved with
the model. This information
permits VISIO to automatically
generate the table schema for
the database.

Más contenido relacionado

La actualidad más candente

data modeling and models
data modeling and modelsdata modeling and models
data modeling and modelssabah N
 
OODM-object oriented data model
OODM-object oriented data modelOODM-object oriented data model
OODM-object oriented data modelAnilPokhrel7
 
Summary data modelling
Summary data modellingSummary data modelling
Summary data modellingNovita Sari
 
Formalization & data abstraction during use case modeling in object oriented ...
Formalization & data abstraction during use case modeling in object oriented ...Formalization & data abstraction during use case modeling in object oriented ...
Formalization & data abstraction during use case modeling in object oriented ...csandit
 
Mapping object to_data_models_with_the_uml
Mapping object to_data_models_with_the_umlMapping object to_data_models_with_the_uml
Mapping object to_data_models_with_the_umlIvan Paredes
 
Chapter 7 relation database language
Chapter 7 relation database languageChapter 7 relation database language
Chapter 7 relation database languageJafar Nesargi
 
Critical Writing of Quality Database Design
Critical Writing of Quality Database DesignCritical Writing of Quality Database Design
Critical Writing of Quality Database DesignTraitet Thepbandansuk
 
SCAF – AN EFFECTIVE APPROACH TO CLASSIFY SUBSPACE CLUSTERING ALGORITHMS
SCAF – AN EFFECTIVE APPROACH TO CLASSIFY SUBSPACE CLUSTERING ALGORITHMSSCAF – AN EFFECTIVE APPROACH TO CLASSIFY SUBSPACE CLUSTERING ALGORITHMS
SCAF – AN EFFECTIVE APPROACH TO CLASSIFY SUBSPACE CLUSTERING ALGORITHMSijdkp
 
INTRODUCTION TO Database Management System (DBMS)
INTRODUCTION TO Database Management System (DBMS)INTRODUCTION TO Database Management System (DBMS)
INTRODUCTION TO Database Management System (DBMS)Prof Ansari
 
Asif nosql
Asif nosqlAsif nosql
Asif nosqlAsif Ali
 
Ijatcse71852019
Ijatcse71852019Ijatcse71852019
Ijatcse71852019loki536577
 

La actualidad más candente (18)

Week 9.docx
Week 9.docxWeek 9.docx
Week 9.docx
 
data modeling and models
data modeling and modelsdata modeling and models
data modeling and models
 
1234
12341234
1234
 
OODM-object oriented data model
OODM-object oriented data modelOODM-object oriented data model
OODM-object oriented data model
 
Data modeling
Data modelingData modeling
Data modeling
 
Summary data modelling
Summary data modellingSummary data modelling
Summary data modelling
 
Formalization & data abstraction during use case modeling in object oriented ...
Formalization & data abstraction during use case modeling in object oriented ...Formalization & data abstraction during use case modeling in object oriented ...
Formalization & data abstraction during use case modeling in object oriented ...
 
Mapping object to_data_models_with_the_uml
Mapping object to_data_models_with_the_umlMapping object to_data_models_with_the_uml
Mapping object to_data_models_with_the_uml
 
Chapter 7 relation database language
Chapter 7 relation database languageChapter 7 relation database language
Chapter 7 relation database language
 
Critical Writing of Quality Database Design
Critical Writing of Quality Database DesignCritical Writing of Quality Database Design
Critical Writing of Quality Database Design
 
Lime
LimeLime
Lime
 
Data modeling dbms
Data modeling dbmsData modeling dbms
Data modeling dbms
 
SCAF – AN EFFECTIVE APPROACH TO CLASSIFY SUBSPACE CLUSTERING ALGORITHMS
SCAF – AN EFFECTIVE APPROACH TO CLASSIFY SUBSPACE CLUSTERING ALGORITHMSSCAF – AN EFFECTIVE APPROACH TO CLASSIFY SUBSPACE CLUSTERING ALGORITHMS
SCAF – AN EFFECTIVE APPROACH TO CLASSIFY SUBSPACE CLUSTERING ALGORITHMS
 
INTRODUCTION TO Database Management System (DBMS)
INTRODUCTION TO Database Management System (DBMS)INTRODUCTION TO Database Management System (DBMS)
INTRODUCTION TO Database Management System (DBMS)
 
Excel Datamining Addin Advanced
Excel Datamining Addin AdvancedExcel Datamining Addin Advanced
Excel Datamining Addin Advanced
 
Fundamentals of Data Modeling and Database Design by Dr. Kamal Gulati
Fundamentals of Data Modeling and Database Design by Dr. Kamal GulatiFundamentals of Data Modeling and Database Design by Dr. Kamal Gulati
Fundamentals of Data Modeling and Database Design by Dr. Kamal Gulati
 
Asif nosql
Asif nosqlAsif nosql
Asif nosql
 
Ijatcse71852019
Ijatcse71852019Ijatcse71852019
Ijatcse71852019
 

Similar a Informatica Data Modelling : Importance of Conceptual Models

Data modeling 101 - Basics - Software Domain
Data modeling 101 - Basics - Software DomainData modeling 101 - Basics - Software Domain
Data modeling 101 - Basics - Software DomainAbdul Ahad
 
Data modeling levels and techniques.docx
Data modeling levels and techniques.docxData modeling levels and techniques.docx
Data modeling levels and techniques.docxLanLThThy
 
Data modeling levels and techniques.docx
Data modeling levels and techniques.docxData modeling levels and techniques.docx
Data modeling levels and techniques.docxLanLThThy
 
Data modeling levels and techniques.docx
Data modeling levels and techniques.docxData modeling levels and techniques.docx
Data modeling levels and techniques.docxLanLThThy
 
FORMALIZATION & DATA ABSTRACTION DURING USE CASE MODELING IN OBJECT ORIENTED ...
FORMALIZATION & DATA ABSTRACTION DURING USE CASE MODELING IN OBJECT ORIENTED ...FORMALIZATION & DATA ABSTRACTION DURING USE CASE MODELING IN OBJECT ORIENTED ...
FORMALIZATION & DATA ABSTRACTION DURING USE CASE MODELING IN OBJECT ORIENTED ...cscpconf
 
Itlc hanoi ba day 3 - thai son - data modelling
Itlc hanoi   ba day 3 - thai son - data modellingItlc hanoi   ba day 3 - thai son - data modelling
Itlc hanoi ba day 3 - thai son - data modellingVu Hung Nguyen
 
Exposing a Few of the Data Models in Use Right Now
Exposing a Few of the Data Models in Use Right NowExposing a Few of the Data Models in Use Right Now
Exposing a Few of the Data Models in Use Right NowEW Solutions
 
1.1 Data Modelling - Part I (Understand Data Model).pdf
1.1 Data Modelling - Part I (Understand Data Model).pdf1.1 Data Modelling - Part I (Understand Data Model).pdf
1.1 Data Modelling - Part I (Understand Data Model).pdfRakeshKumar145431
 
Data Models [DATABASE SYSTEMS: Design, Implementation, and Management]
Data Models [DATABASE SYSTEMS: Design, Implementation, and Management]Data Models [DATABASE SYSTEMS: Design, Implementation, and Management]
Data Models [DATABASE SYSTEMS: Design, Implementation, and Management]Usman Tariq
 
software_engg-chap-03.ppt
software_engg-chap-03.pptsoftware_engg-chap-03.ppt
software_engg-chap-03.ppt064ChetanWani
 
Data Modeling PPT
Data Modeling PPTData Modeling PPT
Data Modeling PPTTrinath
 
Schema Integration, View Integration and Database Integration, ER Model & Dia...
Schema Integration, View Integration and Database Integration, ER Model & Dia...Schema Integration, View Integration and Database Integration, ER Model & Dia...
Schema Integration, View Integration and Database Integration, ER Model & Dia...Mobarok Hossen
 
Database Management Systems ( Dbms )
Database Management Systems ( Dbms )Database Management Systems ( Dbms )
Database Management Systems ( Dbms )Patty Buckley
 
54 C o m m u n i C at i o n s o F t h e a C m j u.docx
54    C o m m u n i C at i o n s  o F  t h e  a C m       j u.docx54    C o m m u n i C at i o n s  o F  t h e  a C m       j u.docx
54 C o m m u n i C at i o n s o F t h e a C m j u.docxevonnehoggarth79783
 
Physical Database Requirements.pdf
Physical Database Requirements.pdfPhysical Database Requirements.pdf
Physical Database Requirements.pdfseifusisay06
 
Mastering data-modeling-for-master-data-domains
Mastering data-modeling-for-master-data-domainsMastering data-modeling-for-master-data-domains
Mastering data-modeling-for-master-data-domainsChanukya Mekala
 
What Is Super Key In Dbms
What Is Super Key In DbmsWhat Is Super Key In Dbms
What Is Super Key In DbmsTheresa Singh
 

Similar a Informatica Data Modelling : Importance of Conceptual Models (20)

Data Modeling.docx
Data Modeling.docxData Modeling.docx
Data Modeling.docx
 
Data modeling 101 - Basics - Software Domain
Data modeling 101 - Basics - Software DomainData modeling 101 - Basics - Software Domain
Data modeling 101 - Basics - Software Domain
 
Data modeling levels and techniques.docx
Data modeling levels and techniques.docxData modeling levels and techniques.docx
Data modeling levels and techniques.docx
 
Data modeling levels and techniques.docx
Data modeling levels and techniques.docxData modeling levels and techniques.docx
Data modeling levels and techniques.docx
 
Data modeling levels and techniques.docx
Data modeling levels and techniques.docxData modeling levels and techniques.docx
Data modeling levels and techniques.docx
 
FORMALIZATION & DATA ABSTRACTION DURING USE CASE MODELING IN OBJECT ORIENTED ...
FORMALIZATION & DATA ABSTRACTION DURING USE CASE MODELING IN OBJECT ORIENTED ...FORMALIZATION & DATA ABSTRACTION DURING USE CASE MODELING IN OBJECT ORIENTED ...
FORMALIZATION & DATA ABSTRACTION DURING USE CASE MODELING IN OBJECT ORIENTED ...
 
Itlc hanoi ba day 3 - thai son - data modelling
Itlc hanoi   ba day 3 - thai son - data modellingItlc hanoi   ba day 3 - thai son - data modelling
Itlc hanoi ba day 3 - thai son - data modelling
 
Exposing a Few of the Data Models in Use Right Now
Exposing a Few of the Data Models in Use Right NowExposing a Few of the Data Models in Use Right Now
Exposing a Few of the Data Models in Use Right Now
 
1.1 Data Modelling - Part I (Understand Data Model).pdf
1.1 Data Modelling - Part I (Understand Data Model).pdf1.1 Data Modelling - Part I (Understand Data Model).pdf
1.1 Data Modelling - Part I (Understand Data Model).pdf
 
Data Models [DATABASE SYSTEMS: Design, Implementation, and Management]
Data Models [DATABASE SYSTEMS: Design, Implementation, and Management]Data Models [DATABASE SYSTEMS: Design, Implementation, and Management]
Data Models [DATABASE SYSTEMS: Design, Implementation, and Management]
 
software_engg-chap-03.ppt
software_engg-chap-03.pptsoftware_engg-chap-03.ppt
software_engg-chap-03.ppt
 
Data Modeling PPT
Data Modeling PPTData Modeling PPT
Data Modeling PPT
 
Schema Integration, View Integration and Database Integration, ER Model & Dia...
Schema Integration, View Integration and Database Integration, ER Model & Dia...Schema Integration, View Integration and Database Integration, ER Model & Dia...
Schema Integration, View Integration and Database Integration, ER Model & Dia...
 
Database Management Systems ( Dbms )
Database Management Systems ( Dbms )Database Management Systems ( Dbms )
Database Management Systems ( Dbms )
 
Data Modelling..pptx
Data Modelling..pptxData Modelling..pptx
Data Modelling..pptx
 
54 C o m m u n i C at i o n s o F t h e a C m j u.docx
54    C o m m u n i C at i o n s  o F  t h e  a C m       j u.docx54    C o m m u n i C at i o n s  o F  t h e  a C m       j u.docx
54 C o m m u n i C at i o n s o F t h e a C m j u.docx
 
Physical Database Requirements.pdf
Physical Database Requirements.pdfPhysical Database Requirements.pdf
Physical Database Requirements.pdf
 
Data Warehouse Designing: Dimensional Modelling and E-R Modelling
Data Warehouse Designing: Dimensional Modelling and E-R ModellingData Warehouse Designing: Dimensional Modelling and E-R Modelling
Data Warehouse Designing: Dimensional Modelling and E-R Modelling
 
Mastering data-modeling-for-master-data-domains
Mastering data-modeling-for-master-data-domainsMastering data-modeling-for-master-data-domains
Mastering data-modeling-for-master-data-domains
 
What Is Super Key In Dbms
What Is Super Key In DbmsWhat Is Super Key In Dbms
What Is Super Key In Dbms
 

Más de ZaranTech LLC

Comparison Between Artificial Intelligence, Machine Learning, and Deep Learning
Comparison Between Artificial Intelligence, Machine Learning, and Deep LearningComparison Between Artificial Intelligence, Machine Learning, and Deep Learning
Comparison Between Artificial Intelligence, Machine Learning, and Deep LearningZaranTech LLC
 
6 Steps to Confirm Successful Workday Deployment
6 Steps to Confirm Successful Workday Deployment6 Steps to Confirm Successful Workday Deployment
6 Steps to Confirm Successful Workday DeploymentZaranTech LLC
 
Business Benefits of Robotic Process Automation
Business Benefits of Robotic Process AutomationBusiness Benefits of Robotic Process Automation
Business Benefits of Robotic Process AutomationZaranTech LLC
 
RPA – UiPath Training & Certification Roadmap
RPA – UiPath Training & Certification RoadmapRPA – UiPath Training & Certification Roadmap
RPA – UiPath Training & Certification RoadmapZaranTech LLC
 
Roles and Responsibilities of a DevOps Engineer
Roles and Responsibilities of a DevOps EngineerRoles and Responsibilities of a DevOps Engineer
Roles and Responsibilities of a DevOps EngineerZaranTech LLC
 
Demand For Data Scientist
Demand For Data ScientistDemand For Data Scientist
Demand For Data ScientistZaranTech LLC
 
Introduction To Data Science with Apache Spark
Introduction To Data Science with Apache Spark Introduction To Data Science with Apache Spark
Introduction To Data Science with Apache Spark ZaranTech LLC
 
10 Popular Hadoop Technical Interview Questions
10 Popular Hadoop Technical Interview Questions10 Popular Hadoop Technical Interview Questions
10 Popular Hadoop Technical Interview QuestionsZaranTech LLC
 
SAP HANA Reporting - SAP HANA Tutorial
SAP HANA Reporting - SAP HANA TutorialSAP HANA Reporting - SAP HANA Tutorial
SAP HANA Reporting - SAP HANA TutorialZaranTech LLC
 
SAP HANA Native Application Development
SAP HANA Native Application DevelopmentSAP HANA Native Application Development
SAP HANA Native Application DevelopmentZaranTech LLC
 
INFORMATICA EASY LEARNING ONLINE TRAINING
INFORMATICA EASY LEARNING ONLINE TRAININGINFORMATICA EASY LEARNING ONLINE TRAINING
INFORMATICA EASY LEARNING ONLINE TRAININGZaranTech LLC
 
Qtp selenium Course Instructions & Installation Steps
Qtp selenium Course Instructions & Installation StepsQtp selenium Course Instructions & Installation Steps
Qtp selenium Course Instructions & Installation StepsZaranTech LLC
 
Introduction to NoSQL Databases | Hadoop Quick Introduction
Introduction to NoSQL Databases | Hadoop Quick IntroductionIntroduction to NoSQL Databases | Hadoop Quick Introduction
Introduction to NoSQL Databases | Hadoop Quick IntroductionZaranTech LLC
 
Informatica Power Center - Workflow Manager
Informatica Power Center - Workflow ManagerInformatica Power Center - Workflow Manager
Informatica Power Center - Workflow ManagerZaranTech LLC
 
Informatica Interview Questions & Answers
Informatica Interview Questions & AnswersInformatica Interview Questions & Answers
Informatica Interview Questions & AnswersZaranTech LLC
 
CaseStudy - Business Analyst Project Objectives
CaseStudy - Business Analyst Project ObjectivesCaseStudy - Business Analyst Project Objectives
CaseStudy - Business Analyst Project ObjectivesZaranTech LLC
 
All About Business Analyst Becoming a successful BA
All About Business Analyst Becoming a successful BAAll About Business Analyst Becoming a successful BA
All About Business Analyst Becoming a successful BAZaranTech LLC
 
SAP HANA Architecture Overview | SAP HANA Tutorial
SAP HANA Architecture Overview | SAP HANA TutorialSAP HANA Architecture Overview | SAP HANA Tutorial
SAP HANA Architecture Overview | SAP HANA TutorialZaranTech LLC
 
Learning is Evolving | Enhance your skills with ZaranTech
Learning is Evolving | Enhance your skills with ZaranTechLearning is Evolving | Enhance your skills with ZaranTech
Learning is Evolving | Enhance your skills with ZaranTechZaranTech LLC
 
What does a business analyst do?
What does a business analyst do?What does a business analyst do?
What does a business analyst do?ZaranTech LLC
 

Más de ZaranTech LLC (20)

Comparison Between Artificial Intelligence, Machine Learning, and Deep Learning
Comparison Between Artificial Intelligence, Machine Learning, and Deep LearningComparison Between Artificial Intelligence, Machine Learning, and Deep Learning
Comparison Between Artificial Intelligence, Machine Learning, and Deep Learning
 
6 Steps to Confirm Successful Workday Deployment
6 Steps to Confirm Successful Workday Deployment6 Steps to Confirm Successful Workday Deployment
6 Steps to Confirm Successful Workday Deployment
 
Business Benefits of Robotic Process Automation
Business Benefits of Robotic Process AutomationBusiness Benefits of Robotic Process Automation
Business Benefits of Robotic Process Automation
 
RPA – UiPath Training & Certification Roadmap
RPA – UiPath Training & Certification RoadmapRPA – UiPath Training & Certification Roadmap
RPA – UiPath Training & Certification Roadmap
 
Roles and Responsibilities of a DevOps Engineer
Roles and Responsibilities of a DevOps EngineerRoles and Responsibilities of a DevOps Engineer
Roles and Responsibilities of a DevOps Engineer
 
Demand For Data Scientist
Demand For Data ScientistDemand For Data Scientist
Demand For Data Scientist
 
Introduction To Data Science with Apache Spark
Introduction To Data Science with Apache Spark Introduction To Data Science with Apache Spark
Introduction To Data Science with Apache Spark
 
10 Popular Hadoop Technical Interview Questions
10 Popular Hadoop Technical Interview Questions10 Popular Hadoop Technical Interview Questions
10 Popular Hadoop Technical Interview Questions
 
SAP HANA Reporting - SAP HANA Tutorial
SAP HANA Reporting - SAP HANA TutorialSAP HANA Reporting - SAP HANA Tutorial
SAP HANA Reporting - SAP HANA Tutorial
 
SAP HANA Native Application Development
SAP HANA Native Application DevelopmentSAP HANA Native Application Development
SAP HANA Native Application Development
 
INFORMATICA EASY LEARNING ONLINE TRAINING
INFORMATICA EASY LEARNING ONLINE TRAININGINFORMATICA EASY LEARNING ONLINE TRAINING
INFORMATICA EASY LEARNING ONLINE TRAINING
 
Qtp selenium Course Instructions & Installation Steps
Qtp selenium Course Instructions & Installation StepsQtp selenium Course Instructions & Installation Steps
Qtp selenium Course Instructions & Installation Steps
 
Introduction to NoSQL Databases | Hadoop Quick Introduction
Introduction to NoSQL Databases | Hadoop Quick IntroductionIntroduction to NoSQL Databases | Hadoop Quick Introduction
Introduction to NoSQL Databases | Hadoop Quick Introduction
 
Informatica Power Center - Workflow Manager
Informatica Power Center - Workflow ManagerInformatica Power Center - Workflow Manager
Informatica Power Center - Workflow Manager
 
Informatica Interview Questions & Answers
Informatica Interview Questions & AnswersInformatica Interview Questions & Answers
Informatica Interview Questions & Answers
 
CaseStudy - Business Analyst Project Objectives
CaseStudy - Business Analyst Project ObjectivesCaseStudy - Business Analyst Project Objectives
CaseStudy - Business Analyst Project Objectives
 
All About Business Analyst Becoming a successful BA
All About Business Analyst Becoming a successful BAAll About Business Analyst Becoming a successful BA
All About Business Analyst Becoming a successful BA
 
SAP HANA Architecture Overview | SAP HANA Tutorial
SAP HANA Architecture Overview | SAP HANA TutorialSAP HANA Architecture Overview | SAP HANA Tutorial
SAP HANA Architecture Overview | SAP HANA Tutorial
 
Learning is Evolving | Enhance your skills with ZaranTech
Learning is Evolving | Enhance your skills with ZaranTechLearning is Evolving | Enhance your skills with ZaranTech
Learning is Evolving | Enhance your skills with ZaranTech
 
What does a business analyst do?
What does a business analyst do?What does a business analyst do?
What does a business analyst do?
 

Último

ICS 2208 Lecture Slide Notes for Topic 6
ICS 2208 Lecture Slide Notes for Topic 6ICS 2208 Lecture Slide Notes for Topic 6
ICS 2208 Lecture Slide Notes for Topic 6Vanessa Camilleri
 
How to Fix XML SyntaxError in Odoo the 17
How to Fix XML SyntaxError in Odoo the 17How to Fix XML SyntaxError in Odoo the 17
How to Fix XML SyntaxError in Odoo the 17Celine George
 
Using Grammatical Signals Suitable to Patterns of Idea Development
Using Grammatical Signals Suitable to Patterns of Idea DevelopmentUsing Grammatical Signals Suitable to Patterns of Idea Development
Using Grammatical Signals Suitable to Patterns of Idea Developmentchesterberbo7
 
Q-Factor General Quiz-7th April 2024, Quiz Club NITW
Q-Factor General Quiz-7th April 2024, Quiz Club NITWQ-Factor General Quiz-7th April 2024, Quiz Club NITW
Q-Factor General Quiz-7th April 2024, Quiz Club NITWQuiz Club NITW
 
Expanded definition: technical and operational
Expanded definition: technical and operationalExpanded definition: technical and operational
Expanded definition: technical and operationalssuser3e220a
 
Oppenheimer Film Discussion for Philosophy and Film
Oppenheimer Film Discussion for Philosophy and FilmOppenheimer Film Discussion for Philosophy and Film
Oppenheimer Film Discussion for Philosophy and FilmStan Meyer
 
Beauty Amidst the Bytes_ Unearthing Unexpected Advantages of the Digital Wast...
Beauty Amidst the Bytes_ Unearthing Unexpected Advantages of the Digital Wast...Beauty Amidst the Bytes_ Unearthing Unexpected Advantages of the Digital Wast...
Beauty Amidst the Bytes_ Unearthing Unexpected Advantages of the Digital Wast...DhatriParmar
 
MS4 level being good citizen -imperative- (1) (1).pdf
MS4 level   being good citizen -imperative- (1) (1).pdfMS4 level   being good citizen -imperative- (1) (1).pdf
MS4 level being good citizen -imperative- (1) (1).pdfMr Bounab Samir
 
How to Manage Buy 3 Get 1 Free in Odoo 17
How to Manage Buy 3 Get 1 Free in Odoo 17How to Manage Buy 3 Get 1 Free in Odoo 17
How to Manage Buy 3 Get 1 Free in Odoo 17Celine George
 
Decoding the Tweet _ Practical Criticism in the Age of Hashtag.pptx
Decoding the Tweet _ Practical Criticism in the Age of Hashtag.pptxDecoding the Tweet _ Practical Criticism in the Age of Hashtag.pptx
Decoding the Tweet _ Practical Criticism in the Age of Hashtag.pptxDhatriParmar
 
Grade 9 Quarter 4 Dll Grade 9 Quarter 4 DLL.pdf
Grade 9 Quarter 4 Dll Grade 9 Quarter 4 DLL.pdfGrade 9 Quarter 4 Dll Grade 9 Quarter 4 DLL.pdf
Grade 9 Quarter 4 Dll Grade 9 Quarter 4 DLL.pdfJemuel Francisco
 
Unraveling Hypertext_ Analyzing Postmodern Elements in Literature.pptx
Unraveling Hypertext_ Analyzing  Postmodern Elements in  Literature.pptxUnraveling Hypertext_ Analyzing  Postmodern Elements in  Literature.pptx
Unraveling Hypertext_ Analyzing Postmodern Elements in Literature.pptxDhatriParmar
 
Daily Lesson Plan in Mathematics Quarter 4
Daily Lesson Plan in Mathematics Quarter 4Daily Lesson Plan in Mathematics Quarter 4
Daily Lesson Plan in Mathematics Quarter 4JOYLYNSAMANIEGO
 
Grade Three -ELLNA-REVIEWER-ENGLISH.pptx
Grade Three -ELLNA-REVIEWER-ENGLISH.pptxGrade Three -ELLNA-REVIEWER-ENGLISH.pptx
Grade Three -ELLNA-REVIEWER-ENGLISH.pptxkarenfajardo43
 
Transaction Management in Database Management System
Transaction Management in Database Management SystemTransaction Management in Database Management System
Transaction Management in Database Management SystemChristalin Nelson
 
Textual Evidence in Reading and Writing of SHS
Textual Evidence in Reading and Writing of SHSTextual Evidence in Reading and Writing of SHS
Textual Evidence in Reading and Writing of SHSMae Pangan
 
Team Lead Succeed – Helping you and your team achieve high-performance teamwo...
Team Lead Succeed – Helping you and your team achieve high-performance teamwo...Team Lead Succeed – Helping you and your team achieve high-performance teamwo...
Team Lead Succeed – Helping you and your team achieve high-performance teamwo...Association for Project Management
 
Indexing Structures in Database Management system.pdf
Indexing Structures in Database Management system.pdfIndexing Structures in Database Management system.pdf
Indexing Structures in Database Management system.pdfChristalin Nelson
 

Último (20)

ICS 2208 Lecture Slide Notes for Topic 6
ICS 2208 Lecture Slide Notes for Topic 6ICS 2208 Lecture Slide Notes for Topic 6
ICS 2208 Lecture Slide Notes for Topic 6
 
How to Fix XML SyntaxError in Odoo the 17
How to Fix XML SyntaxError in Odoo the 17How to Fix XML SyntaxError in Odoo the 17
How to Fix XML SyntaxError in Odoo the 17
 
Using Grammatical Signals Suitable to Patterns of Idea Development
Using Grammatical Signals Suitable to Patterns of Idea DevelopmentUsing Grammatical Signals Suitable to Patterns of Idea Development
Using Grammatical Signals Suitable to Patterns of Idea Development
 
Q-Factor General Quiz-7th April 2024, Quiz Club NITW
Q-Factor General Quiz-7th April 2024, Quiz Club NITWQ-Factor General Quiz-7th April 2024, Quiz Club NITW
Q-Factor General Quiz-7th April 2024, Quiz Club NITW
 
Expanded definition: technical and operational
Expanded definition: technical and operationalExpanded definition: technical and operational
Expanded definition: technical and operational
 
Oppenheimer Film Discussion for Philosophy and Film
Oppenheimer Film Discussion for Philosophy and FilmOppenheimer Film Discussion for Philosophy and Film
Oppenheimer Film Discussion for Philosophy and Film
 
Beauty Amidst the Bytes_ Unearthing Unexpected Advantages of the Digital Wast...
Beauty Amidst the Bytes_ Unearthing Unexpected Advantages of the Digital Wast...Beauty Amidst the Bytes_ Unearthing Unexpected Advantages of the Digital Wast...
Beauty Amidst the Bytes_ Unearthing Unexpected Advantages of the Digital Wast...
 
Mattingly "AI & Prompt Design: Large Language Models"
Mattingly "AI & Prompt Design: Large Language Models"Mattingly "AI & Prompt Design: Large Language Models"
Mattingly "AI & Prompt Design: Large Language Models"
 
prashanth updated resume 2024 for Teaching Profession
prashanth updated resume 2024 for Teaching Professionprashanth updated resume 2024 for Teaching Profession
prashanth updated resume 2024 for Teaching Profession
 
MS4 level being good citizen -imperative- (1) (1).pdf
MS4 level   being good citizen -imperative- (1) (1).pdfMS4 level   being good citizen -imperative- (1) (1).pdf
MS4 level being good citizen -imperative- (1) (1).pdf
 
How to Manage Buy 3 Get 1 Free in Odoo 17
How to Manage Buy 3 Get 1 Free in Odoo 17How to Manage Buy 3 Get 1 Free in Odoo 17
How to Manage Buy 3 Get 1 Free in Odoo 17
 
Decoding the Tweet _ Practical Criticism in the Age of Hashtag.pptx
Decoding the Tweet _ Practical Criticism in the Age of Hashtag.pptxDecoding the Tweet _ Practical Criticism in the Age of Hashtag.pptx
Decoding the Tweet _ Practical Criticism in the Age of Hashtag.pptx
 
Grade 9 Quarter 4 Dll Grade 9 Quarter 4 DLL.pdf
Grade 9 Quarter 4 Dll Grade 9 Quarter 4 DLL.pdfGrade 9 Quarter 4 Dll Grade 9 Quarter 4 DLL.pdf
Grade 9 Quarter 4 Dll Grade 9 Quarter 4 DLL.pdf
 
Unraveling Hypertext_ Analyzing Postmodern Elements in Literature.pptx
Unraveling Hypertext_ Analyzing  Postmodern Elements in  Literature.pptxUnraveling Hypertext_ Analyzing  Postmodern Elements in  Literature.pptx
Unraveling Hypertext_ Analyzing Postmodern Elements in Literature.pptx
 
Daily Lesson Plan in Mathematics Quarter 4
Daily Lesson Plan in Mathematics Quarter 4Daily Lesson Plan in Mathematics Quarter 4
Daily Lesson Plan in Mathematics Quarter 4
 
Grade Three -ELLNA-REVIEWER-ENGLISH.pptx
Grade Three -ELLNA-REVIEWER-ENGLISH.pptxGrade Three -ELLNA-REVIEWER-ENGLISH.pptx
Grade Three -ELLNA-REVIEWER-ENGLISH.pptx
 
Transaction Management in Database Management System
Transaction Management in Database Management SystemTransaction Management in Database Management System
Transaction Management in Database Management System
 
Textual Evidence in Reading and Writing of SHS
Textual Evidence in Reading and Writing of SHSTextual Evidence in Reading and Writing of SHS
Textual Evidence in Reading and Writing of SHS
 
Team Lead Succeed – Helping you and your team achieve high-performance teamwo...
Team Lead Succeed – Helping you and your team achieve high-performance teamwo...Team Lead Succeed – Helping you and your team achieve high-performance teamwo...
Team Lead Succeed – Helping you and your team achieve high-performance teamwo...
 
Indexing Structures in Database Management system.pdf
Indexing Structures in Database Management system.pdfIndexing Structures in Database Management system.pdf
Indexing Structures in Database Management system.pdf
 

Informatica Data Modelling : Importance of Conceptual Models

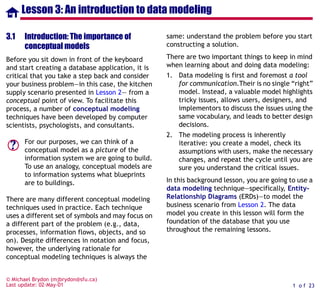
  • 1. © Michael Brydon (mjbrydon@sfu.ca) Last update: 02-May-01 1 o f 23 Lesson 3: An introduction to data modeling 3.1 Introduction: The importance of conceptual models Before you sit down in front of the keyboard and start creating a database application, it is critical that you take a step back and consider your business problem—in this case, the kitchen supply scenario presented in Lesson 2— from a conceptual point of view. To facilitate this process, a number of conceptual modeling techniques have been developed by computer scientists, psychologists, and consultants. For our purposes, we can think of a conceptual model as a picture of the information system we are going to build. To use an analogy, conceptual models are to information systems what blueprints are to buildings. There are many different conceptual modeling techniques used in practice. Each technique uses a different set of symbols and may focus on a different part of the problem (e.g., data, processes, information flows, objects, and so on). Despite differences in notation and focus, however, the underlying rationale for conceptual modeling techniques is always the same: understand the problem before you start constructing a solution. There are two important things to keep in mind when learning about and doing data modeling: 1. Data modeling is first and foremost a tool for communication.Their is no single “right” model. Instead, a valuable model highlights tricky issues, allows users, designers, and implementors to discuss the issues using the same vocabulary, and leads to better design decisions. 2. The modeling process is inherently iterative: you create a model, check its assumptions with users, make the necessary changes, and repeat the cycle until you are sure you understand the critical issues. In this background lesson, you are going to use a data modeling technique—specifically, Entity- Relationship Diagrams (ERDs)—to model the business scenario from Lesson 2. The data model you create in this lesson will form the foundation of the database that you use throughout the remaining lessons. ?
  • 2. Introduction: The importance of conceptualAn introduction to data modeling 3.1.1 What is data modeling? A data model is a simply a diagram that describes the most important “things” in your business environment from a data-centric point of view. To illustrate, consider the simple ERD shown in Figure 3.1. The purpose of the diagram is to describe the relationship between the data stored about products and the data stored about the organizations that supply the products. 3.1.1.1 Entities and attributes The rectangles in Figure 3.1 are called entity types (typically shortened to “entities”) and the ovals are called attributes. The entities are the “things” in the business environment about which we want to store data. The attributes provide us with a means of organizing and structuring the data. For example, we need to store certain information about the products that we sell, such as the typical selling price of the product (“Unit price”) and the quantity of the product currently in inventory (“Qty on hand”). These pieces of data are attributes of the Product entity. It is important to note that the precise manner in which data are used and processed within a particular business application is a separate issue from data modeling. For example, the data model says nothing about how the value of “Qty on hand” is changed over time. The focus in data modeling is on capturing data about the environment. You will learn how to change this data (e.g., process orders so that the inventory values are updated) once you have mastered the art of database design. A data modeler assumes that if the right data is available, the other elements of the application will fall into place effortlessly and wonderfully. For now, this is a good working assumption. FIGURE 3.1: An ERD showing a relationship between products and suppliers. Product supplied by Supplier Unit price ProductID Qty on hand Name Address Entity Attributes Relationship Cardinality ?
  • 3. Introduction: The importance of conceptualAn introduction to data modeling 3.1.1.2 Notation for relationships In addition to entities and attributes, Figure 3.1 shows a relationship between the two entities using a line and a diamond. The relationship construct is used—not surprisingly—to indicate the existence or absence of a relationship between entities. A crow’s foot at either end of a relationship line is used to denote the cardinality of the relationship. For example, the crow’s foot on the product side of the relationship in Figure 3.1 indicates that a particular supplier may provide your company with several different products, such as bowls, spatulas, wire whisks and so on. The absence of a crow’s foot on the supplier side indicates that each product in your inventory is provided by a single supplier. Thus, the relationship in Figure 3.1 indicates that you always buy all your wire whisks from the same company. 3.1.1.3 Modeling assumptions The relationship shown in Figure 3.1 is called one-to-many: each supplier supplies many products (where many means “any number including zero”) but each product is supplied by one supplier (where “one” means “at most one”). The decision to use a one-to-many relationship reflects an assumption about the business environment in which your wholesale company operates. However, it is easy to imagine a different environment in which each product is supplied by multiple suppliers. For example, many suppliers may carry a particular brand of wire whisk. When you run out of whisks, it is up to you to decide where to place your order. In other words, it is possible that a many-to-many relationship exists between suppliers and products. If multiple supplier exist, attributes of the product, such as its price and product number may vary from supplier to supplier. In this situation, the data requirements of a many-to- many environment are slightly more complex than those of the one-to-many environment. If you design and implement your database around the one-to-many assumption but then discover that certain goods are supplied by multiple suppliers, much effort is going to be required to fix the problem. Herein lies the point of drawing an ERD: The diagram makes your assumptions about the relationships within a particular business environment explicit before you start building things. 3.1.1.4 The role of the modeler In the environment used in these tutorials, you are the user, the designer, and the implementor ?
  • 4. Introduction: The importance of conceptualAn introduction to data modeling of the system. In a more realistic environment, however, these roles are played by different individuals (or groups) with different backgrounds and priorities. For example, a common stereotype of implementors (programmers, database specialists, and so on) is that they seldom leave their cubicles to communicate with end-users of the software they are writing. Similarly, it is generally safe to assume that users have no interest in, or understanding of, low-level technical details (such as the cardinality of relationships on ERDs, mechanisms to enforce referential integrity, and so on). Thus, it is up to the business analyst to bridge the communication gap between the different groups involved in the construction, use, and administration of an information system. As a business analyst (or more generally, a designer), it is critical that you walk through your conceptual models with users and make sure that your modeling assumptions are appropriate. In some cases, you may have to examine sample data from the existing computer-based or manual system to determine whether (for instance) there are any products that are supplied by multiple suppliers. At the modeling stage, making changes such as converting a one-to-many relationship to a many-to-many relationship is trivial—all that is required is the addition of a crow’s foot to one end of the relationship, as shown in Figure 3.2. In contrast, making the same change once you have implemented tables, built a user interface, and written code is a time-consuming and frustrating chore. Generally, you can count on the 10× rule of thumb when building software: the cost of making a change increases by an order of magnitude for each stage of the systems development lifecycle that you complete. FIGURE 3.2: An ERD for an environment in which there is a many-to-many relationship between products and suppliers. Product supplied by Supplier Unit price ProductID Qty on hand Name Address The addition of a second crow’s foot transforms the one-to-many relationship into a many-to-many relationship. !
  • 5. Introduction: The importance of conceptualAn introduction to data modeling 3.1.2 Core modeling constructs and notation Data modelers typically adopt a set of notational conventions so that their diagrams are consistent. For example, large IT organizations and consultancies typically adopt a methodology1—a set of tools and procedures for applying the tools that specifies the notation used within the organization. Enforcing standardization in this way facilitates teamwork on large projects. Similarly, if a computer- aided software engineering (CASE) tool is used for conceptual modeling and design, notational conventions are often enforced by the software. What follows is a brief summary of the notational conventions that I use when drawing ERDs. Keep in mind, however, that ERDs are first and foremost a tool for communication between humans. As such, the precise notation you use is not particularly important as long as people can read and understand the diagrams. With experience, you will come to realize that differences in the shapes of the boxes and lines have little effect on the core concepts of data modeling. 3.1.2.1 Entities Entities are drawn as rectangular boxes containing a noun in singular form, as shown in Figure 3.3. You will see later that each entity you draw ultimately becomes a table in your database. You might want to keep this transformation from entity to table in mind when selecting the names of your entities. For example, your entity names should be short but descriptive. 3.1.2.2 Relationships A relationship between entities is drawn as a line bisected by a diamond. The diamond contains a verb (or short verb phrase) that describes the nature of the relationship between the entities, as shown in Figure 3.4. Named relationships are used to make the ERDs more readable. However, unlike entity names, relationship names never show up in the final database. Consequently, it does not really matter how you label your relationships, as long1 It can be argued that the term “method” is grammatically preferable. In Europe, for example, the term “method” tends to be favored. Customer FIGURE 3.3: An entity named “Customer”.
  • 6. Introduction: The importance of conceptualAn introduction to data modeling as the labels make the diagram easier to interpret. To illustrate, consider the relationship between products and suppliers shown in Figure 3.1. The relationship is described by the verb phrase “supplied by”. Although one could have opted for the shorter relationship name “has” instead, the resulting diagram (e.g., “Supplier has product”) would be more difficult for readers of the diagram to interpret. 3.1.2.3 Relationship direction One issue that sometimes troubles neophyte data modelers is that the direction of the relationship is not made explicit on the diagram. Returning to Figure 3.1, it is obvious to me (since I drew the diagram) that the relationship should be read: “Product is supplied by supplier.” Reading the relationship in the other direction (“Supplier is supplied by product”) makes very little sense to anyone who is familiar with the particular problem domain. Generally, ERDs make certain assumptions about the reader’s knowledge of the underlying business domain. A notational convention supported by some CASE tools is to require two names for each relationship: one that makes sense in one direction (e.g., “is supplied by”), and another that makes sense in the opposite direction (e.g., “supplies”). Although double-naming may make the diagram easier to read, it also adds clutter (twice as many labels) and imposes an additional burden on the modeler. 3.1.2.4 Cardinality As discussed in Section 3.1.1.2, the cardinality of a relationship constrains the number of instances of one entity type that can be associated with a single instance of the other entity type. The cardinality of relationships has an important impact on number and structure of the tables in the database. Consequently, it is important to get the cardinality right on paper before starting the implementation. buys FIGURE 3.4: A relationship named “buys”. ? !
  • 7. Introduction: The importance of conceptualAn introduction to data modeling There are three fundamental types of cardinality in ERDs: • One-to-many — You have already seen an example of a one-to-many relationship in Figure 3.1. You will soon discover that one- to-many relationships are the bread and butter of relational databases. • One-to-one — At this point in your data modeling career, you should avoid one-to- one relationships. To illustrate the basic issue, consider the ERD shown in Figure 3.5. Based on an existing paper-based system, the modeler has assumed that each customer is associated with one “customer record” (i.e., a paper form containing information about the customer, such as address, fax number, and so on). Clearly, each customer has only one customer record and each customer record belongs to a single customer. However, if we automate the system and get rid of the paper form, then there is no reason not to combine the Customer and Customer Record entities into a single entity called Customer. In many cases, one-to-one relationships indicate a modeling error. When you have a one-to-one relationship such as the one shown in Figure 3.5, you should combine the two entities into a single entity. • Many-to-many — The world is full of many- to-many relationships. A well-used example is “Student takes course.” Many-to-many relationships also arise when you consider the history of an entity. To illustrate, consider the ERD shown in Figure 3.6. At first glance, the relationship between Family and Single-Family Dwelling (SFD) might seem to be one-to-one since a particular family can only live in one SFD at a time and each SFD can (by definition) only contain a single family. However, it is possible for a family to live in different houses over time. Similarly, it is possible that many families inhabit a particular house over the years. Thus, if the concept of time is considered, the relationship becomes many-to-many. We will discuss how you go about determining cardinality in subsequent sections. At this point, it is sufficient to recognize that there are two ! FIGURE 3.5: An incorrect one-to-one relationship Customer associated with Customer Record
  • 8. Introduction: The importance of conceptualAn introduction to data modeling popular (and equivalent) approaches to denoting “one” and “many” on an ERD: the crow’s foot notation you have already seen and the “1:N” notation. 1. Crow’s foot notation — In the crow’s foot notation, three little lines (resembling a crow’s foot) are used to indicate “many”. Not surprisingly, the absence of a crow’s foot indicates “one”. Thus, the relationship in Figure 3.7 indicates that “each product is supplied by at most one supplier,” whereas “each supplier may supply many products.”. 2. 1:N notation — In the 1:N notation, the symbol “N” (and/or “M”) is used to indicate “many” whereas “1” is used to indicate “one”. An example of the 1:N notation is shown in Figure 3.8. The ERD model also supports additional cardinality information in the form of cardinality constraints. To keep things simple, however, the discussion of cardinality constraints is deferred until Section 6.3.2. 3.1.2.5 Attributes Attributes are properties or characteristics of a particularly entity about which we wish to collect and store data. In addition, there is typically one attribute that uniquely identifies particular instances of the entity. For example, each of your customers may have a unique customer ID. Such attributes are known as key attributes. FIGURE 3.6: What is the cardinality of this relationship? Family lives in Single- Family Dwelling Product supplied by Supplier FIGURE 3.7: A one-to-many relationship in crow’s foot notation Product supplied by Supplier N 1 FIGURE 3.8: A one-to-many relationship in 1:N notation ?
  • 9. Learning objectives 9 o f 23 An introduction to data modeling For ERDs that are drawn manually, attributes are traditionally shown as ovals containing the name of the attribute. If the attribute is a key, it is typically underlined. A number of attributes for the Customer entity are shown in Figure 3.9. Adding attributes to ERDs can result in very cluttered diagrams. Some CASE tools list the attributes inside the entity rectangle (see the discussion of CASE tools in Section 3.4.5). Another way to reduce clutter is to only show a handful of critical attributes on the diagram. 3.2 Learning objectives ! understand the core constructs of the entity-relationship model ! create an ERD based on your understanding of a business scenario ! use associative entities to add attributes to relationships ! gain some familiarity with the role of data modeling and CASE tools in the development process 3.3 Exercises In the sections that follow, we step through the construction of an ERD for the kitchen supply scenario. By following along, you should gain a better understanding of the basic techniques involved in data modeling as well as some of the design pitfalls that should be avoided. If this lesson was on how to play golf, you would not read it and then assume that you are a good golfer. Golf is a skill that requires both theoretical knowledge and hours of practice. Thus, the only way to become a good golfer is to acquire a solid understanding of the fundamentals and then go out and hit thousands of balls. The same principles apply to data modeling. 3.3.1 Starting simple Let us begin with the simplest and most essential statement one can make about the Customer CustID Name Phone No. Contact person FIGURE 3.9: A number of attributes of the Customer entity are shown in ovals. ? !
  • 10. Exercises 10 o f 23 An introduction to data modeling wholesaling environment: customers buy products. It is natural that you would want to both automate and informate (recall Section 2.4) this important business process. 3.3.1.1 Step one: identify the entities Entities are physical things, organizations, roles and events about which we want to store information. In the wholesaling scenario, two entities are immediately obvious: Customer and Product. However, before we add the entities to our diagram, it is important that we have a firm understanding of what exactly these entities correspond to in the real world: 1. Customers — In the wholesaling environment, a customer is an organization, not a person. There may be a single person at the organization through whom we conduct our business. We will refer to this person as the “contact person” for the customer in order to maintain a clean distinction between people and organizations. 2. Products — It is not immediately clear whether the Product entity refers to a specific item or a class of similar items. For example, one of the products you sell is the “Fat Cat” mug. The Product ID of the mug is “88 4017” and it normally sells for $5.50. Note, however, that there are many individual “Fat Cat” mugs and each one is slightly different due to irregularities, variations in painting, and so on. In our case, there are advantages to ignoring the individuality of each mug and treating them all as a single group of interchangeable items. Thus, when we talk about “a product” or “a SKU”, we are talking about an entire class of similar instances, not individual instances themselves.1 Having made these assumptions explicitly, we can now create our first ERD. ➨ Take out a piece of paper and a pencil. Unless you have a special-purpose CASE tool, it is seldom worth the effort to draw the early drafts of your conceptual models on a computer. ERDs typically require many modifications so you should not invest much time making your diagrams look nice. In fact, the diagram you are about to begin will 1 In some environments, it may be necessary to treat products as individual items. For example, in the aerospace industry, there is a requirement to track individual parts by serial number in case a part fails. The requirement for “unit effectivity” necessitates a different set of assumptions about the Product entity and thus leads to a different database design. ? !
  • 11. Exercises 11 o f 23 An introduction to data modeling end up the in recycle bin by the end of the lesson. ➨ Add the Customer and Product entities to your diagram, as shown in Figure 3.10. 3.3.1.2 Steptwo:specify arelationshipbetweenthe entities We know that customers buy products and that products are bought by customers. It is a simple matter to create a relationship to communicate this fact. ➨ Add a relationship line between the Customer and Product entities. ➨ Label the relationship “buys”, as shown in Figure 3.11. Unlike flow charts, the arrangement of boxes and the direction of lines in an ERD have no significance—any arrangement that fits on the page is valid. Similarly, the relationship line does not denote any type of sequence or flow of information. 3.3.1.3 Step three: determine the cardinality of the relationship Each customer can buy many products—indeed, that is the whole purpose of being in this line of business. To show this possibility on our ERD, we add a crow’s foot to the Product side of the relationship line. Similarly, each product can be purchased by many customers. For example, a number of our customers may chose to stock the “Fat Cat” mug (keeping in mind that the product refers to a style of mug, not an individual mug). As a result, a crow’s foot is added to the Customer side of the relationship. ➨ Designate the “buys” relationship as many- to-many using the crow’s foot notation, as shown in Figure 3.12. FIGURE 3.10: Add the first two entities to your ERD. Customer Product ? FIGURE 3.11: Add a relationship between the two entities. Customer Productbuys
  • 12. Exercises 12 o f 23 An introduction to data modeling 3.3.1.4 Step four: identify a few important attributes There is a need to find a balance between the descriptiveness of the ERD and the ease with which others can decipher it. As such, I prefer to show only a handful of attributes on the ERDs. ➨ Add a small number of important attributes to your diagram, as shown in Figure 3.13. By adding attributes such as “Qty on hand” to the Product entity, it is clear that the entity refers to a class of products, not an individual product. In contrast, if “Serial number” were added to the diagram as an attribute instead of “Qty on hand”, the reader of the ERD would come to a different conclusion about the meaning of the Product entity. 3.3.2 Dealing with many-to-many relationships Although the diagram in Figure 3.13 is technically correct, it is missing a great deal of information about how a purchase transaction occurs in reality. To illustrate, consider the attribute “Unit price” belonging to the Product entity. Unit price contains the default selling price of the product. To understand why it is the default price, consider the case of a “Fat Cat” mug that typically sells for $5.50. What if there is a FIGURE 3.12: Indicate the many-to-many cardinality of the relationship. Customer Productbuys Add a crow’s foot to the customer side to indicate that each product is purchased by many customers. 1111 Add a second crow’s foot to the product side to indicate that each customer purchases many products. 2222 FIGURE 3.13: An initial ERD for the kitchen supply environment. Customer Productbuys ProductID Unit price Qty on hand CustID Name Contact person
  • 13. Exercises 13 o f 23 An introduction to data modeling particular mug that has a minor flaw? Although the mug can still be sold, the customer may expect a discounted price to compensate for the flaw. The question is therefore: Where on the diagram do we indicate the actual selling price of a particular mug? A second example is the purchase quantity. What if the customer purchases a dozen “Fat Cat” mugs? Where is this information recorded? The “Qty ordered” attribute does not belong to the Customer entity because customers order many products besides mugs. Similarly, “Qty ordered” does not belong to the Product entity because different customers may order different quantities. This is a problem that typically arises in many- to-many relationships: There are certain important attributes that do not seem to belong to either of the entities participating in the relationship. The solution is to assign the attributes to the relationship itself. 3.3.2.1 Attributes of relationships The issues surrounding price and order quantity arise because the attributes belong to the interaction of the entities in the many-to-many relationship. Thus, the price of a flawed mug is an attribute of a particular product being sold to a particular customer on a particular day. To summarize, there are a number of attributes that should be attached to the “buys” relationship in Figure 3.13: • Date — the date on which the purchase is made; • Actual price — the price at which the item (or multiple items within the same class of products) are actually sold to the customer; • Quantity ordered — the number of items with a certain product ID requested by the customer; and, • Quantity shipped — the actual number of items shipped to the customer. 3.3.2.2 Associative entities Given the number and importance of the attributes attached to the “buys” relationship, it makes sense to treat the relationship as an entity in its own right. To transform a relationship into an entity on an ERD, we use a special symbol called an associative entity. The notation for an associative entity is a relationship diamond nested inside of an entity rectangle, as shown in Figure 3.14. To transform your many-to-many relationship (without attributes) into an associative entity (with attributes), do the following:
  • 14. Exercises 14 o f 23 An introduction to data modeling ➨ Draw a rectangle around the “buys” relationship. ➨ Replace the relationship name “buys” with an appropriate noun, for example “Sale”. Remember, entities—including associative entities—are named with nouns. ➨ Decompose the many-to-many relationship into two one-to-many relationships. ➨ Add the attributes to the associative entity, as shown in Figure 3.14. Although Sale is now treated as an entity, there is no requirement to add relationship diamonds between Product and Sale or Customer and Sale. An associative entity serves as an entity and a relationship at the same time. The meaning of the Sale associative entity in Figure 3.14 is the following: Each customer can be involved in many sales transactions, but each individual sales transaction involves only one customer. Similarly, each product can be involved in many sales transactions, but each sales transaction involves only one type of product. 3.3.2.3 Illustration To better understand how an associative entity works, it is worthwhile to jump ahead a bit and consider what the data might look like. In Figure 3.15, sample data for the Customer, Product, and Sale entities are shown. There are a couple of interesting things to notice about the sample data: 1. Each entity contains information relevant to that entity only. For example, Customer only contains information about customers; Product only contains information about products, and so on. 2. Each row in the Sale entity shows the details of a single sales transaction. Each sales transaction consists of a particular product being sold to a particular customer. The transaction-specific information (such FIGURE 3.14: Transform a many-to-many relationship into an associative entity. Customer ProductSale DateQuantity ordered Quantity shipped Actual price ? !
  • 15. Exercises 15 o f 23 An introduction to data modeling as the actual selling price and quantity ordered) are attributes of the Sale entity. 3. By using the data for the Sale entity, it is possible to determine which products have been purchased by a particular customer. Similarly, it is possible to determine which customers have purchased a particular product. 4. Only the minimum amount of information required to identify the customer and product is included in the Sale associative entity. For example, neither the name of the customer or the description of the product appear in Sale since this information can easily be found elsewhere using the values of Customer ID and Product ID respectively. In the context of FIGURE 3.15: Data showing the role of an associative entity Each customer can participate in many sales transactions. Each product can participate in many sales transactions. Customer Product Sale
  • 16. Exercises 16 o f 23 An introduction to data modeling the Sale entity, the Customer ID and Product ID attributes are called foreign keys (foreign keys are so important that Lesson 6 is devoted to the topic). 3.3.3 Revising the ERD There is an important problem with the ERD as its now stands. The constraint that each sales transaction involves only a single product appears to be at odds with the reality of the business situation described in Lesson 2. For example, the “sales transactions” with which we are most familiar—the customer orders you receive by fax— typically request many different products: a dozen “Fat Cat” mugs, two dozen spatulas, some wire whisks, and so on. The mismatch between the diagram and the business environment means that the ERD must be revised. 3.3.3.1 Identifying the problem The problem with the ERD in Figure 3.14 is that ignores the technology (broadly speaking) used by customers to place orders. Specifically, customers normally wait until they need enough stock to make an order worthwhile. In addition, factors such as minimum order values and shipping costs favor the batching of small, single-product orders into large, multi-product orders. By taking the technology used for ordering into account, it becomes clear that we have failed to model an important event entity: the arrival of an order. Be careful—not all pieces of paper in the existing business process are automatically event entities. For example, the invoices that we send to our customers are more properly thought of as reports (which can be generated from the information already contained in other entities). With practice, the distinction between entities and non- entities will become clear. 3.3.3.2 Adding the new entity In this section, you are going to modify your ERD to include an Order entity. ➨ Create a new ERD consisting of entities for customers, orders and products. Here is where a CASE tool pays off: you can delete entities or move entities around the screen and the relationships and connector lines follow automatically. ➨ Create relationships to reflect the fact that customers place orders and orders consist of products. ! ?
  • 17. Exercises 17 o f 23 An introduction to data modeling ➨ Add cardinality symbols to reflect the fact that each customer can place many orders, but each order belongs to a single customer. ➨ Add cardinality symbols to reflect the fact that each order can contain many products and each product may be contained in many orders. ➨ Add a handful of attributes to the diagram to help clarify the meaning of the entities. The resulting ERD is shown in Figure 3.16. 3.3.3.3 Creating OrderDetails Although Figure 3.16 is a great improvement over our previous ERD, much of the same information missing from Figure 3.13—such as actual price and quantity ordered—is missing from the new ERD. As a consequence, we must transform the “contains” relationship into an associative entity with its own attributes. ➨ Transform the “contains” relationship into an associative entity using the procedure described in Section 3.3.2.2. To remain consistent with MICROSOFT’s sample databases, I recommend using the name “Order Detail” for the associative entity. Alternatives include “Line Item” and “Order Item”. The resulting ERD is shown in Figure 3.17. To help understand the relationship between the Order entity and the Order Detail associative entity, look at the orders included in the project package. Each order has header information (such as customer, order date, and so on) and multiple order details. Each detail has information such as quantity ordered, quantity shipped, and price. ? FIGURE 3.16: Revise the ERD to include an Order entity. Customer Product places Order contains ProductID Unit price Qty on hand CustID Name Contact person OrderID Date
  • 18. Discussion 18 o f 23 An introduction to data modeling 3.4 Discussion 3.4.1 Logical versus physical models A distinction is typically made between logical and physical data models: • Logical data models — logical models capture general information about entities and relationships and are used for communication with business users. • Physical data models — physical models serve as a precise specification for the implemented system. As a consequence, the models must take into account the technology used to store the data. For example, a given logical data model translates into very different physical data models depending on whether the target technology is a file-based system, a relational database, or an object-oriented database. Normally, you start with a high-level logical model and refine with the help of users over several iterations. Once you are happy with the logical model, you transform it into a physical model and hand it to a database administrator (DBA) for implementation as a database. For relational databases, the translation process from logical to physical is relatively straightforward and involves the following steps: 1. Decompose all many-to-many relationships — Since the relational database model does not support many-to- many relationships, you must replace all many-to-many relationships with associative entities as described in Section 3.3.2.2. FIGURE 3.17: Create an associative entity to model individual order details. Customer Product places Order ProductID Unit price Qty on hand CustID Name Contact person OrderID Date Order detail Actual price Quantity ordered Quantity shipped
  • 19. Discussion 19 o f 23 An introduction to data modeling 2. Add attributes — The data model should be “fully attributed” before handing it over to a DBA. 3. Identify primary keys — Each entity requires an attribute that uniquely identifies instances. 4. Add foreign keys — In relational databases, relationships between entities are implemented using foreign keys. At this point, it is not critical that you understand each of these steps (you will get lots of practice in subsequent lessons). What is important is that you understand that there is a clear progression from high-level, graphical, conceptual models to low-level database schemas. 3.4.2 ERDs versus the ACCESS relationship window If you have used the relationship window in MICROSOFT ACCESS, you know that the relationship diagrams used by ACCESS resemble ERDs. The primary differences between the two are • The relationships between tables are not named in ACCESS. • Many-to-many relationships are not supported. That is, the relationships window permits physical data models only. • ACCESS uses the symbols “1” and “∞” instead of “1” and “N”, as shown in Figure 3.18. 3.4.3 Why do I need to know about data modeling? Clearly, you do not need to know the intricacies of data modeling to start using a database package such as MICROSOFT ACCESS. In fact, MICROSOFT has gone through great lengths FIGURE 3.18: The relationship window in ACCESS uses a notation similar to that used in ERDs. The ACCESS relationship window supports physical data modeling. One-to-many relationships are denoted using “1” and “∞”.
  • 20. Discussion 20 o f 23 An introduction to data modeling between the release of ACCESS version 2.0 and ACCESS 2000 to make the product more accessible to data modeling neophytes. For example, there is a table analyzer, a table design wizard, and all sorts of other aids intended to automate the database design process. In my view, there are three problems with MICROSOFT’s “dumbing-down” strategy: 1. No wizard or add-in tool is going to change the fact that database management systems (DBMSs) are specialized software packages that presuppose an enormous amount of prior knowledge. Even the error messages generated by ACCESS (as you will soon discover) can only be understood if you have a firm grasp on the theoretical fundamentals of the relational database model. For example, what do you do when you accidentally violate a “referential integrity constraint”? What is a “primary key”? What is an “ambiguous outer join”? 2. Trends in application development increasingly emphasize data and de- emphasize programming. Thus, a solid understanding of your data is critical. Put another way, just about anyone can build a reasonably sophisticated system if the underlying database is well designed (indeed, by doing these tutorials, you will see just how far you can go without writing a single line of programming code). In contrast, if the database design is poor, you will have to be a programming wizard just to create the illusion that the application works. 3. CASE tools from vendors such as ORACLE, COMPUTER ASSOCIATES, VISIO (now part of MICROSOFT), and many others translate ERDs directly into database tables. Thus, if you know how to draw diagrams similar to the one shown in Figure 3.17, you know how to design databases. In short, the last thing you want to do is rely on wizards to shelter you from the database design process. Instead, you want to get in at the nitty-gritty level and understand the trade-offs between various designs. Once the design is complete you can use wizards and shortcuts for everything else. 3.4.4 How do I learn about data modeling? One important problem that I perceive as a university professor is that despite the importance of data modeling, it is very difficult to find good practical training as a data modeler. In the standard computer science database course, we tend to focus on theoretical issues such as relational algebra, set theory, indexing, normalization, and so on. Although such knowledge is certainly important for DBAs and
  • 21. Application to the project 21 o f 23 An introduction to data modeling other technical professionals, it provides little guidance when we are faced with real-world modeling problems. Conversely, the introductory information systems (IS) courses that we offer in business schools provide only cursory treatment of data modeling and database design. I suppose the rationale is that it should be possible to hire a computer science graduate to do the data modeling! 3.4.5 CASE tools and the design process Computer-aided software engineering (CASE) tools are software packages that simplify the process of creating conceptual models. In addition, some CASE packages are more than just drawing tools: they translate the data models into database tables, programming code templates, and so on. To illustrate, consider the diagram in Figure 3.19 which was drawn using the “database modeling tool” in VISIO ENTERPRISE. The database modeling tool allows a designer to start with a a physical ERD-like diagram and add implementation-level metadata (data about data). For example, in Figure 3.20, the physical-level properties of the ActualPrice attribute are specified in a dialog box. Once the physical-level metadata has been added to the model, many CASE tools can generate table schemas for the target database. For example, ORACLE DESIGNER can generate structured query language (SQL) data definition commands for ORACLE databases. VISIO ENTERPRISE can generate SQL or create the tables in various database packages (including ACCESS) directly. Given CASE tools with this type of functionality, it is clear that the most important skill for database designers is not a complete knowledge of SQL syntax. Instead, it is the ability to analyze a real-world problem and create a data model that accurately and elegantly captures the critical elements of the problem. 3.5 Application to the project ➨ Complete your own ERD for the order entry scenario. Remember that at this point, the scope of the project is very limited. It will be expanded somewhat in subsequent lessons. HINT: If you get stuck, you can refer to the VISIO diagram in Figure 3.19. Keep in mind, however, that Figure 3.19 is a physical ERD; you should be working with logical ERDs at this stage of the development process.
  • 22. Application to the project 22 o f 23 An introduction to data modeling CustName BillingAddress City ProvState PostalCode RegionCode ContactPerson ContactPhone OnLineOrdering CustID Customer CustID OrderDate Processed OrderID Order places QtyOrdered QtyShipped ActualPrice OrderID ProductID OrderDetail consists of Description Unit UnitPrice QtyOnHand ProductID Product is a FIGURE 3.19: An physical database model for the kitchen supply environment created using a CASE tool. VISIO ENTERPRISE can be used to draw various styles of logical and physical data models. This is an example of a physical model. Attributes are shown within the body of the entity and primary keys are shown in bold. Crow’s foot notation is used indicate the cardinality of the relationships. Since this is a physical database diagram, there are no many-to-many relationships or associative entities. For example, the Order Detail associative entity is shown as a regular entity.
  • 23. Application to the project 23 o f 23 An introduction to data modeling FIGURE 3.20: A CASE tool can be used to add implementation details to a graphical model. The implementation details of each attribute can be saved with the model. This information permits VISIO to automatically generate the table schema for the database.