Citalopram improves response inhibition in more severe Parkinson’s disease
•
1 like•379 views

Presented in the Impulse Control Disorders in Parkinson's Disease meeting of the Movement Disorder Society (Boston, 2012)

Recommended
More Related Content
What's hot
What's hot (20)
Similar to Citalopram improves response inhibition in more severe Parkinson’s disease
Similar to Citalopram improves response inhibition in more severe Parkinson’s disease (20)
Recently uploaded
Recently uploaded (20)
Citalopram improves response inhibition in more severe Parkinson’s disease
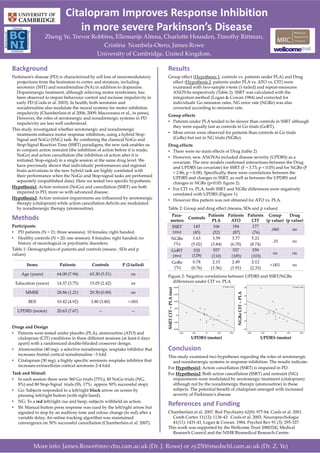
- 1. Citalopram Improves Response Inhibition in more severe Parkinson’s Disease Zheng Ye, Trevor Robbins, Ellemarije Altena, Charlotte Housden, Timothy Rittman, Cristina Nombela-Otero, James Rowe University of Cambridge, United Kingdom. More info: James.Rowe@mrc-cbu.cam.ac.uk (Dr. J. Rowe) or zy250@medschl.cam.ac.uk (Dr. Z. Ye) Methods Participants • PD patients (N = 21; three sessions): 10 females; right handed. • Healthy controls (N = 20; one session): 8 females; right handed; no history of neurological or psychiatric disorders. Table 1: Demographics of patients and controls (means , SDs and p values) Background Parkinson’s disease (PD) is characterized by cell loss of neuromodulatory projections from the brainstem to cortex and striatum, including serotonin (5HT) and noradrenaline (NA) in addition to dopamine. Dopaminergic treatment, although relieving motor syndromes, has been observed to impair behaviour control and increase impulsivity in early PD (Cools et al. 2003). In health, both serotonin and noradrenaline also modulate the neural systems for motor inhibition impulsivity (Chamberlain et al 2006, 2009; Macoveanu et al., in press). However, the roles of serotonergic and noradrenergic systems in PD impulsivity are less well understood. This study investigated whether serotonergic and noradrenergic treatments enhance motor response inhibition, using a hybrid Stop- Signal and NoGo (SNG) task. By combining the classical NoGo and Stop-Signal Reaction Time (SSRT) paradigms, the new task enables us to compare action restraint (the inhibition of action before it is made; NoGo) and action cancellation (the inhibition of action after it is initiated; Stop-signal) in a single session at the same drug level. We have previously shown that individuals’ performances and regional brain activations in the new hybrid task are highly correlated with their performance when the NoGo and Stop-signal tasks are performed separately (unpublished data). Here we tested two specific hypothesis. Hypothesis1: Action restraint (NoGo) and cancellation (SSRT) are both impaired in PD, more so with advanced disease. Hypothesis2: Action restraint impairments are influenced by serotonergic therapy (citalopram) while action cancellation deficits are modulated by noradrenergic therapy (atomoxetine). References and Funding Chamberlain et al. 2007. Biol Psychiatry 62(9): 977-84. Cools et al. 2001. Cereb Cortex 11(12): 1136-43. Cools et al. 2003. Neuropsychologia 41(11): 1431-41. Logan & Cowan. 1984. Psychol Rev 91 (3): 295-327. This work was supported by the Wellcome Trust {088324}, Medical Research Council and the NIHR Biomedical Research Centre. Conclusion This study examined two hypotheses regarding the roles of serotonergic and noradrenergic systems in response inhibition. The results indicate: For Hypothesis1: Action cancellation (SSRT) is impaired in PD. For Hypothesis2: Both action cancellation (SSRT) and restraint (NG) impairments were modulated by serotonergic treatment (citalopram) although not by the noradrenergic therapy (atomoxetine) in these subjects. The potential benefit of citalopram emerged with increased severity of Parkinson's disease Drugs and Design • Patients were tested under placebo (PLA), atomoxetine (ATO) and citalopram (CIT) conditions in three different sessions (at least 6 days apart) with a randomized double-blinded crossover design. • Atomoxetine (40 mg): a selective noradrenergic reuptake inhibitor that increases frontal cortical noradrenaline ~3 fold • Citalopram (30 mg): a highly specific serotonin reuptake inhibitor that increases extracellular cortical serotonin 2-4 fold Task and Stimuli • In each session there were 360 Go trials (75%), 40 NoGo trials (NG, 8%) and 80 Stop-Signal trials (SS, 17%; approx 50% successful stop). • Go: Subjects responded to a left/right black arrow on screen by pressing left/right button (with right hand). • NG: To a red left/right cue and beep, subjects withheld an action. • SS: Manual button press response was cued by the left/right arrow but signaled to stop by an auditory tone and colour change (to red) after a variable delay. An online tracking algorithm was maintained convergence on 50% successful cancellation (Chamberlain et al. 2007). Items Patients Controls P (2-tailed) Age (years) 64.00 (7.94) 65.30 (5.51) ns Education (years) 14.57 (3.75) 15.05 (2.42) ns MMSE 28.86 (1.21) 29.30 (0.90) ns BDI 10.42 (4.92) 3.80 (3.80) <.001 UPDRS (motor) 20.63 (7.67) -- -- Results Group effect (Hypothesis 1: controls vs. patients under PLA) and Drug effect (Hypothesis 2: patients under PLA vs. ATO vs. CIT) were examined with two-sample t-tests (1-tailed) and repeat-measures ANOVAs respectively (Table 2). SSRT was calculated with the integration method (Logan & Cowan 1984) and corrected for individuals’ Go omission rates. NG error rate (NGRe) was also corrected according to omission rate. Group effects • Patients under PLA tended to be slower than controls in SSRT although they were equally fast as controls in Go trials (GoRT). • More errors were observed for patients than controls in Go trials (GoRe) but not in NG trials (NGRe). Drug effects • There were no main effects of Drug (table 2) • However, new ANOVAs included disease severity (UPDRS) as a covariate. The new models confirmed interactions between the Drug and UPDRS (as covariate) for SSRT (F = 3.73, p < 0.05) and for NGRe (F = 2.86, p = 0.08). Specifically, there were correlations between the UPDRS and changes in SSRT, as well as between the UPDRS and changes in NGRe (p<0.05: figure 2). • For CIT vs. PLA, both SSRT and NGRe differences were negatively correlated with UPDRS (Figure 1). • However this pattern was not obtained for ATO vs. PLA. Table 2: Group and drug effect (means, SDs and p values) Para- meters Controls Patients PLA Patients ATO Patients CIT Group (p value) Drug (p value) SSRT (ms) 143 (45) 166 (52) 184 (87) 177 (76) .060 ns NGRe (%) 1.63 (5.02) 3.59 (3.84) 3.77 (6.70) 5.21 (8.74) .10 ns GoRT (ms) 532 (129) 557 (110) 557 (105) 559 (103) ns ns GoRe (%) 0.78 (0.76) 2.15 (1.56) 2.49 (1.91) 2.12 (2.33) <.001 ns NGReCIT–PLA SSRTCIT–PLA(ms) UPDRS (motor) UPDRS (motor) Figure 2: Negative correlations between UPDRS and SSRT/NGRe differences under CIT vs. PLA