
Recomendados
Recomendados
Más contenido relacionado
La actualidad más candente
La actualidad más candente (20)
Destacado
Similar a Physics irp analysis
Similar a Physics irp analysis (20)
Más de 12903
Más de 12903 (15)
Último
Último (20)
Physics irp analysis
- 1. RahatMadarasmi October 3, 2011 Period 1 Eales Independent Research Project: Pressure and Kinetic Energy of a Soccer Ball Introduction: A soccer ball can contain different pressures within it. When kicking a soccer ball, it is important that the ball is filled up to a certain point at which, when kicked, will travel at a great velocity with high kinetic energy so that the goalie has difficulty stopping it, thus resulting in a goal. What is to be investigated here is the relationship between the pressure and the velocity and kinetic energy of the ball. When the pressure within a soccer ball is altered, the velocity at which it travels when struck also changes. Due to this change in velocity, there is also a change in the kinetic energy that the ball possesses when struck at different pressures. When pressure is withdrawn from a soccer ball, the skin tends to fold and cause friction, thus when the ball is kicked in this state, the ball deforms and there is a loss in energy due to the friction. The greater the deformation of the ball, the greater the energy loss in the skin. In order to find out the relationship between the change in pressure and the kinetic energy, the velocity of the ball must be measured for it is a component that is required in the formula to find kinetic energy. The formula for kinetic energy is: Ek= ½ mv2 (1) Where Ekis the kinetic enery, m is the mass and v is the velocity. The predicted outcome that can be gathered from the information presented above is that due to the fact that the less the pressure the greater the friction, as the pressure increases, the kinetic energy of the ball will increase as well.
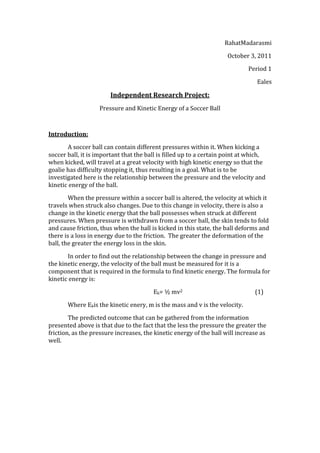
- 2. Design: Research Question: How does the pressure within a soccer ball effect the kinetic energy of the ball when struck by a pendulum at a constant velocity? Independent & Dependent Variables: The independent variable is the pressure because the pressure is what we are changing. The pressures that are measured are 19,600 Pascals, 39,300 Pascals, 58,800 Pascals, 73,500 Pascals, 98,000 Pascals, and 117,600 Pascals. The dependent variable is the kinetic energy of the ball because it is what is affected by the change in pressure (independent variable). Controlled Variables: There were a number of variables that had to be controlled. One control was the soccer ball that was used had to be the same for the entire experiment. The pendulum that was used was another control, as it had to remain the same for the entire experiment. The height from which the hammer was released had to remain constant in order to ensure that it was traveling at the same velocity for every trial when it struck the ball. In order to control this, a bar was clamped onto the pendulum, protruding out at the point where the pendulum (hammer) would be released. The spot in which the ball was placed had to be controlled so that the pendulum would strike the ball at the same point for each trial. To do this, a piece of masking tape was taped on the spot at which the ball was placed for each trial. Figure 1: Experimental set-up Figure 2: Experimental set-up. Motion Detector is visible. Materials and Procedure: Begin by creating the pendulum. Model the pendulum after Figures 1 and 2 above. First, take two clamp stands and connect them by clamping a bar loosely across them (loosely so that it the bar can swing). Then use duct tape to tape the hammer to the bar and test to see if the bar will swing with the hammer on it.
- 3. Take this entire set up and mount it on two text books, one for each clamp stand, and use clamps to clamp the set up to the table. Then use another clamp to clamp a platform (on which the ball will rest) to the table in the middle of the two clamp stands and in front of the hammer. Then take a small piece of duct tape and tape it onto the front of the platform so that the position of the soccer ball remains constant. Once this is done, in order to control the height from which the pendulum is dropped, take a bar and clamp it perpendicular to the bar that is resting across the two clamp stands (does not necessarily have to be perpendicular. It can be greater than 90 degrees according to how high you want to raise the hammer). Once this is done, set up the motion detector on another table approximately 1 meter in front of the set up so that it can measure the motion of the ball. Once all of the set-up is done, the data collection process can begin. For each measure of pressure, the ball must be massed on a scale because the mass is essential to calculating the kinetic energy. Place the ball on the platform where the duct tape marking is. Then raise the hammer to the protruding bar and release the hammer so it swings and makes contact with the soccer ball. Record your results that were picked up by the motion detector and proceed with the rest of the trials. There will be three trials for each of the six different pressure measures. Data Collection & Processing: Figure 3: Sample graph of the Position vs Time graphs of the ball being hit by the hammer. This is the graph from the second trial of 1 kg/cm2.
- 4. Gauge Pressure Mass (kg) Velocity (±0.2m/s) Average (±0.001kg/cm2) Velocity Trial 1 Trial 2 Trial 3 (±0.2m/s) 0.200 0.430 2.157 2.463 2.399 2.34 0.400 0.431 2.391 2.443 2.508 2.45 0.600 0.432 2.548 2.494 2.524 2.53 0.750 0.433 2.524 2.563 2.566 2.55 1.000 0.434 2.576 2.598 2.587 2.59 1.200 0.435 2.489 2.402 2.424 2.44 Table 1: Raw data collected from all the trials in the experiment. Data shows each pressure value and for each pressure value the mass of the ball and the velocities of the three trials. Also shows the average velocities. In order to find the uncertainty of the velocity, the ranges of the trials for each pressure value had to be divided by 2. Then the greatest value would be the uncertainty. Pressure Average (±100 Kinetic Pascals) Energy (±0.2 J) 19,600 1.2 39,300 1.3 58,800 1.4 73,500 1.4 98,000 1.5 117,600 1.3 Table 2: Table that shows the Average Kinetic Energy for each pressure value within the ball. In order to find the Kinetic Energy, the values from Table 1 were plugged into the formula: ½ mv2. In order to obtain the pressure value in its
- 5. correct units (pascals), the Gauge Pressure value in (kg/cm2) had to be multiplied by 9.8*104. Sample Calculations: Calculating uncertainty for velocities: Trials 1 and 2 for the pressure value 0.2kg/cm2 had the largest range. 2.463 - 2.157 = 0.153 = ± 0.2m/s uncertainty for velocities 2 Actual Value for Kinetic Energy= ½ (0.43kg)(2.3m/s)2 = 1.177 J Highest Value for Kinetic Energy= ½ (0.43+0.001kg)(2.3+0.2m/s)2= 1.347J Lowest Value for Kinetic Energy= ½ (0.43-0.001kg)(2.3-0.2)2= 0.946J Uncertainty = (1.347J – 0.946J)/2 = ± 0.2J Figure 4: Graph of the Pressure compared to Average Kinetic Energy. Linear fit function is utilized to show the slope of the graph.
- 6. Figure 5: High-Low fit graph of Pressure compared to Kinetic Energy of the ball. Conclusion: According to Figure 4, it can be seen that the relationship between the pressure within the ball and the kinetic energy is linear. Due to this, it can be concluded that, although there is an outlying point at the end, as the pressure within the ball increases, the kinetic energy of the ball increases as well. From the graph in Figure 4, an equation for the relationship between pressure with a soccer ball and kinetic energy was found: y= (0.0669 0.099)x + (1.140 0.2965) (2) Apart from the final outlying point, the equation of the graph supports the initial theory that the kinetic energy of the ball would increase as its pressure increases. In order to attain this equation, the linear fit on the graph only included the first five points and not the sixth point because it was an outlier. Although it was not included in the calculations of the equation, the outlier is in fact quite significant as it explains the flaws of having too much pressure within the ball. The outlier (sixth point) is not inaccurate data as it is explained to be the point at which there is too much pressure within the ball. When the pressure within the ball is increased too much (in this case to 117,600 Pascals) the kinetic energy within the ball actually decreases because although a certain amount of elasticity is good, too much elasticity does not allow for as much contact time when struck. This means that the pendulum was not able to strike the ball fully before the ball’s great amount of elasticity resulted in the ball rapidly bouncing off the hammer before it could follow through.
- 7. Due to the considerably low uncertainty in the graph, the confidence level of the results is fairly high as the experiment was carried out quite accurately. Also, the data collected correlates very well with the linear fit, thus suggesting that this data is fairly reliable. These results only apply as long as the same soccer ball is used and the same pendulum (same hammer) is used. It is also important that the height from which the hammer is released remains the same. The same pressure values must also be used. Evaluation: There were a number of things that could have been improved over the duration of the experiment. Firstly, when collecting data, the ball placement on the platform could have been better if it was more accurately placed each time. The problem was that the ball was often not perfectly centered with the hammer because the main challenge was stabilizing the ball. Due to this challenge of stabilizing the ball, whenever the ball was stable, whether central or not, we proceeded with the collection of the data. In order to improve on this, a dent could have been made in the platform in order for the ball to sit nicely for each and every trial. In order to have minimal interference from the dent, it is important that the dent is not very deep. Another thing that could have been improved in this experiment was the movement of the hammer. Because the hammer was attached to a bar that was loose (so that it could swing), it also was loose enough to slide from side to side. Due to these minor horizontal movements, the point at which the hammer struck the ball was not always the same as it was often shifting from left to right. In order to improve this, barriers could have been installed on either side of the bar in the attempt to halt or minimize horizontal movement. One final flaw that could have been improved upon was the security of the hammer onto the metal bar. Because duct tape was used to fasten the hammer onto the bar, as the experiment progressed, due to the mass of the hammer, the tape loosened allowing the hammer to wiggle as it swung. In order to avoid this, a more secure way of attaching the hammer to the bar must be developed. In order to maximize security of the hammer, the hammer could be bolted to a piece of metal and the piece of metal could be welded to the bar. This would make sure that the hammer stays completely still throughout the experiment. Analysis: In my Independent Research Project for Physics, I used Reason and Perception when analyzing my data to make sure that my results were accurate, or were what I perceived as accurate. Primarily when looking at the data that I got, I used perception to know what was supposed to be the correct data and then I used reason to see whether the data that I got out of the experiment matched these perceived values. In order to attain the information that was supposed to be
- 8. correct, research had to be done and based on this research, my perception was altered to fit what I had learned. Thus it is the research that shaped my perception and this perception was what I relied on to compare my results to. I used deductive reasoning when analyzing my data in order for it to seem correct and accurate. Deductive reasoning allowed me look at what the data was ideally supposed to be like, and thus I shaped my data accordingly. My reasoning actually a product of my perception because, depending on my perception I would use reason accordingly in order to match up the data. Had I perceived the correct data differently, I would have used reason accordingly and concluded with different results.