SlideShare una empresa de Scribd logo
1 de 4
2013/05/07
1
STATISTICS
X-Kit Textbook
Chapter 8 (Making sense of Sample Data)
Precalculus Textbook
Appendix B: Concepts in Statistics
Par B.1 (Representing Data)
ORGANISE& SUMMARISERAW DATA
Raw Data
Discrete Data
Ungrouped
Frequency
Table
Grouped (low
frequency)
Continuous
Data
Grouped
Frequency
Table
Number of fraudulent cheques receivedat a
bank each week for 30 weeks
Week
1
2 3 4 5 6 7 8 9 10
5 3 8 3 3 1 10 4 6 8
Week
11
12 13 14 15 16 17 18 19 20
3 5 4 7 6 6 9 3 4 5
Week
21
22 23 24 25 26 27 28 29 30
7 9 4 5 8 6 4 4 10 4
DISCRETEDATA
TERMINOLOGY EXPLANATION
Variable of Interest? It is the number of fraudulent cheques
in a week.
Continuous or Discrete
Data?
Discrete Data because cheques can only
exist in whole numbers.
Raw Data? A list of different values. Data has not
been processed in any way.
Data Point or Observation? Each of the values in the raw data.
Frequency? The number of times a data value
appears.
Frequency Table Table to organise and summarise data.
FREQUENCYTABLE
Distinct Values Tally Marks Frequency
1 / 1
2 0
3 //// 5
4 //// // 7
5 //// 4
6 //// 4
7 // 2
8 /// 3
9 // 2
10 // 2
GRAPH
0
1
2
3
4
5
6
7
8
1 2 3 4 5 6 7 8 9 10
Frequency
Frequency
2013/05/07
2
Truck Data: weights(in tonnes) of 20 fully
loaded trucks
Truck
1
2 3 4 5 6 7 8 9 10
Weight
4.54
3.81 4.29 5.16 2.51 4.63 4.75 3.98 5.04 2.80
Truck
11
12 13 14 15 16 17 18 19 20
Weight
2.52
5.88 2.95 3.59 3.87 4.17 3.30 5.48 4.26 3.53
CONTINUOUSDATA
TERMINOLOGY EXPLANATION
Variable of Interest? The weight of a loaded truck.
Continuous or Discrete
Data?
Continuous Data, you can get any
number of values between two
given values.
Frequency Table Table to organise and summarise
data.
Grouped Frequency Table
FREQUENCYTABLE
Class Intervals Tally Marks Frequency
𝟐. 𝟓 ≤ 𝒙 ≤ 𝟑. 𝟎 //// 4
𝟑. 𝟎 ≤ 𝒙 ≤ 𝟑. 𝟓 / 1
𝟑. 𝟓 ≤ 𝒙 ≤ 𝟒. 𝟎 //// 5
𝟒. 𝟎 ≤ 𝒙 ≤ 𝟒. 𝟓 /// 3
𝟒. 𝟓 ≤ 𝒙 ≤ 𝟓. 𝟎 /// 3
𝟓. 𝟎 ≤ 𝒙 ≤ 𝟓. 𝟓 // 2
𝟓. 𝟓 ≤ 𝒙 ≤ 𝟔. 𝟎 // 2
GRAPH
0
1
2
3
4
5
6
0 - 2.5 2.5 - 3.0 3.0 - 3.5 3.5 - 4.0 4.0 - 4.5 4.5 - 5.0 5.0 - 5.5 5.5 - 6.0
Frequency
Frequency
PRESENTATIONOF DATA
Frequency
Table
Pictogram
Bar
Graphs
Histogram
Pie
Chart
Line
Graphs
Stem-and-
Leaf
Ogive
FREQUENCYTABLE
Class Intervals Frequency Cumulative
Frequency
𝟐. 𝟓 ≤ 𝒙 ≤ 𝟑. 𝟎 4 4
𝟑. 𝟎 ≤ 𝒙 ≤ 𝟑. 𝟓 1 5
𝟑. 𝟓 ≤ 𝒙 ≤ 𝟒. 𝟎 5 10
𝟒. 𝟎 ≤ 𝒙 ≤ 𝟒. 𝟓 3 13
𝟒. 𝟓 ≤ 𝒙 ≤ 𝟓. 𝟎 3 16
𝟓. 𝟎 ≤ 𝒙 ≤ 𝟓. 𝟓 3 19
𝟓. 𝟓 ≤ 𝒙 ≤ 𝟔. 𝟎 1 20
2013/05/07
3
OGIVE
0
5
10
15
20
25
2.5 3 3.5 4 4.5 5 5.5 6
Cumulative Frequency
Pictogram: Net Worthof America'sRichest Billionaires
Pie Chart: Average Annual Expenses in a U.S. Household
EXAMPLE
In a class with 30 pupils there are 12 with
blue eyes; 9 with brown eyes; 4 with dark
brown eyes and 5 with green eyes.
1. Draw a pie chart showing this
information.
2. Calculate the fraction and percentage
represented by each eye colour.
EXAMPLE: SOLUTION
Colour of
Eyes
Frequency Angle at Centre Percentage
Blue 12 𝟏𝟐
𝟑𝟎
× 𝟑𝟔𝟎°
= 𝟏𝟒𝟒°
𝟏𝟐
𝟑𝟎
× 𝟏𝟎𝟎 = 𝟒𝟎%
Brown 9 𝟗
𝟑𝟎
× 𝟑𝟔𝟎°
= 𝟏𝟎𝟖°
𝟗
𝟑𝟎
× 𝟏𝟎𝟎 = 𝟑𝟎%
Dark Brown 4 𝟒
𝟑𝟎
× 𝟑𝟔𝟎°
= 𝟒𝟖°
𝟒
𝟑𝟎
× 𝟏𝟎𝟎 = 𝟏𝟑, 𝟑%
Green 5 𝟓
𝟑𝟎
× 𝟑𝟔𝟎°
= 𝟔𝟎°
𝟓
𝟑𝟎
× 𝟏𝟎𝟎 = 𝟏𝟔, 𝟕%
Total 30 𝟑𝟔𝟎° 𝟏𝟎𝟎%
PIE CHART
Blue
Brown
Dark Brown
Green
2013/05/07
4
Bar Graph: Expected U.S. PopulationAged 100 and Over DoubleBar Graph: Fuel Efficiency
LineGraph: Effectof Inflationon the Valueof a $100,000
LifeInsurance Policy
DoubleLineGraph: Populationsof Californiaand Texas
Stem-and-Leaf Plot
Represent the data below in a stem-and-leaf plot:
152; 165; 143; 139; 138;
144; 150; 158; 161; 157;
143; 156; 162; 165; 139;
158; 151; 167; 166; 160;
170; 132; 145; 151; 148;
147; 171; 155; 146; 141.
Stem-and-Leaf Plot
STEM LEAVES
13 9; 8; 9; 2
14 3; 4; 3; 5; 8; 7; 6; 1
15 2; 0; 8; 7; 6; 8; 1; 1; 5
16 5; 1; 2; 5; 7; 6; 0
17 0; 1

Más contenido relacionado

Destacado

Chapter 5 more about interest edulink
Chapter 5 more about interest edulinkChapter 5 more about interest edulink
Chapter 5 more about interest edulinkME MALULEKE
 
03 Simple ideograms
03  Simple ideograms03  Simple ideograms
03 Simple ideogramsHaibiao Miao
 
Guatemala Presentation
Guatemala PresentationGuatemala Presentation
Guatemala Presentationandramlowe
 
Mayan Writing & the Long Count
Mayan Writing & the Long CountMayan Writing & the Long Count
Mayan Writing & the Long CountDokka Srinivasu
 
The Archaeology Of Mayan Civilization
The Archaeology Of Mayan CivilizationThe Archaeology Of Mayan Civilization
The Archaeology Of Mayan CivilizationFaiza Rehman
 
Mayan Center for Peace: Guatemala to Minnesota
Mayan Center for Peace:  Guatemala to MinnesotaMayan Center for Peace:  Guatemala to Minnesota
Mayan Center for Peace: Guatemala to Minnesotaadam.utley
 

Destacado (7)

Chapter 5 more about interest edulink
Chapter 5 more about interest edulinkChapter 5 more about interest edulink
Chapter 5 more about interest edulink
 
03 Simple ideograms
03  Simple ideograms03  Simple ideograms
03 Simple ideograms
 
Guatemala Presentation
Guatemala PresentationGuatemala Presentation
Guatemala Presentation
 
Mayan Writing & the Long Count
Mayan Writing & the Long CountMayan Writing & the Long Count
Mayan Writing & the Long Count
 
Mayan Presentation
Mayan PresentationMayan Presentation
Mayan Presentation
 
The Archaeology Of Mayan Civilization
The Archaeology Of Mayan CivilizationThe Archaeology Of Mayan Civilization
The Archaeology Of Mayan Civilization
 
Mayan Center for Peace: Guatemala to Minnesota
Mayan Center for Peace:  Guatemala to MinnesotaMayan Center for Peace:  Guatemala to Minnesota
Mayan Center for Peace: Guatemala to Minnesota
 

Similar a Organising and Summarising Raw Data

maft0a2_Statistics_lecture2_2021.pptx
maft0a2_Statistics_lecture2_2021.pptxmaft0a2_Statistics_lecture2_2021.pptx
maft0a2_Statistics_lecture2_2021.pptxTshegofatso Mphake
 
Willie Evangelista - Presentation of data
Willie Evangelista -  Presentation of data Willie Evangelista -  Presentation of data
Willie Evangelista - Presentation of data Willie Evangelista
 
Presentationofdata 120111034007-phpapp02
Presentationofdata 120111034007-phpapp02Presentationofdata 120111034007-phpapp02
Presentationofdata 120111034007-phpapp02Alex Robianes Hernandez
 
20- Tabular & Graphical Presentation of data(UG2017-18).ppt
20- Tabular & Graphical Presentation of data(UG2017-18).ppt20- Tabular & Graphical Presentation of data(UG2017-18).ppt
20- Tabular & Graphical Presentation of data(UG2017-18).pptRAJESHKUMAR428748
 
Stat 200 week 6 homework problems9.1.2 many high school student
Stat 200 week 6 homework problems9.1.2 many high school studentStat 200 week 6 homework problems9.1.2 many high school student
Stat 200 week 6 homework problems9.1.2 many high school studentrock73
 
Type of data @ web mining discussion
Type of data @ web mining discussionType of data @ web mining discussion
Type of data @ web mining discussionCherryBerry2
 
Type of data @ Web Mining Discussion
Type of data @ Web Mining DiscussionType of data @ Web Mining Discussion
Type of data @ Web Mining DiscussionCherryBerry2
 
Frequency Tables, Frequency Distributions, and Graphic Presentation
Frequency Tables, Frequency Distributions, and Graphic PresentationFrequency Tables, Frequency Distributions, and Graphic Presentation
Frequency Tables, Frequency Distributions, and Graphic PresentationConflagratioNal Jahid
 
Algebra unit 9.2
Algebra unit 9.2Algebra unit 9.2
Algebra unit 9.2Mark Ryder
 
2 biostatistics presenting data
2  biostatistics presenting data2  biostatistics presenting data
2 biostatistics presenting dataDr. Nazar Jaf
 
Penggambaran Data dengan Grafik
Penggambaran Data dengan GrafikPenggambaran Data dengan Grafik
Penggambaran Data dengan Grafikanom0164
 
03 ch ken black solution
03 ch ken black solution03 ch ken black solution
03 ch ken black solutionKrunal Shah
 
frequency distribution
 frequency distribution frequency distribution
frequency distributionUnsa Shakir
 
Graphs that Enlighten and Graphs that Deceive
Graphs that Enlighten and Graphs that DeceiveGraphs that Enlighten and Graphs that Deceive
Graphs that Enlighten and Graphs that DeceiveLong Beach City College
 
Basic Stat Notes
Basic Stat NotesBasic Stat Notes
Basic Stat Notesroopcool
 
Teoria y problemas de tabla de frecuencias tf221 ccesa007
Teoria y problemas de tabla de frecuencias  tf221  ccesa007Teoria y problemas de tabla de frecuencias  tf221  ccesa007
Teoria y problemas de tabla de frecuencias tf221 ccesa007Demetrio Ccesa Rayme
 
measure of dispersion
measure of dispersion measure of dispersion
measure of dispersion som allul
 

Similar a Organising and Summarising Raw Data (20)

maft0a2_Statistics_lecture2_2021.pptx
maft0a2_Statistics_lecture2_2021.pptxmaft0a2_Statistics_lecture2_2021.pptx
maft0a2_Statistics_lecture2_2021.pptx
 
Willie Evangelista - Presentation of data
Willie Evangelista -  Presentation of data Willie Evangelista -  Presentation of data
Willie Evangelista - Presentation of data
 
Presentationofdata 120111034007-phpapp02
Presentationofdata 120111034007-phpapp02Presentationofdata 120111034007-phpapp02
Presentationofdata 120111034007-phpapp02
 
20- Tabular & Graphical Presentation of data(UG2017-18).ppt
20- Tabular & Graphical Presentation of data(UG2017-18).ppt20- Tabular & Graphical Presentation of data(UG2017-18).ppt
20- Tabular & Graphical Presentation of data(UG2017-18).ppt
 
Stat 200 week 6 homework problems9.1.2 many high school student
Stat 200 week 6 homework problems9.1.2 many high school studentStat 200 week 6 homework problems9.1.2 many high school student
Stat 200 week 6 homework problems9.1.2 many high school student
 
Type of data @ web mining discussion
Type of data @ web mining discussionType of data @ web mining discussion
Type of data @ web mining discussion
 
Type of data @ Web Mining Discussion
Type of data @ Web Mining DiscussionType of data @ Web Mining Discussion
Type of data @ Web Mining Discussion
 
Frequency Tables, Frequency Distributions, and Graphic Presentation
Frequency Tables, Frequency Distributions, and Graphic PresentationFrequency Tables, Frequency Distributions, and Graphic Presentation
Frequency Tables, Frequency Distributions, and Graphic Presentation
 
statistic.ppt
statistic.pptstatistic.ppt
statistic.ppt
 
Algebra unit 9.2
Algebra unit 9.2Algebra unit 9.2
Algebra unit 9.2
 
2 biostatistics presenting data
2  biostatistics presenting data2  biostatistics presenting data
2 biostatistics presenting data
 
Penggambaran Data dengan Grafik
Penggambaran Data dengan GrafikPenggambaran Data dengan Grafik
Penggambaran Data dengan Grafik
 
03 ch ken black solution
03 ch ken black solution03 ch ken black solution
03 ch ken black solution
 
Data presentation
Data presentationData presentation
Data presentation
 
frequency distribution
 frequency distribution frequency distribution
frequency distribution
 
Graphs that Enlighten and Graphs that Deceive
Graphs that Enlighten and Graphs that DeceiveGraphs that Enlighten and Graphs that Deceive
Graphs that Enlighten and Graphs that Deceive
 
Basic Stat Notes
Basic Stat NotesBasic Stat Notes
Basic Stat Notes
 
Freq & Histo
Freq & HistoFreq & Histo
Freq & Histo
 
Teoria y problemas de tabla de frecuencias tf221 ccesa007
Teoria y problemas de tabla de frecuencias  tf221  ccesa007Teoria y problemas de tabla de frecuencias  tf221  ccesa007
Teoria y problemas de tabla de frecuencias tf221 ccesa007
 
measure of dispersion
measure of dispersion measure of dispersion
measure of dispersion
 

Último

Disha NEET Physics Guide for classes 11 and 12.pdf
Disha NEET Physics Guide for classes 11 and 12.pdfDisha NEET Physics Guide for classes 11 and 12.pdf
Disha NEET Physics Guide for classes 11 and 12.pdfchloefrazer622
 
Measures of Dispersion and Variability: Range, QD, AD and SD
Measures of Dispersion and Variability: Range, QD, AD and SDMeasures of Dispersion and Variability: Range, QD, AD and SD
Measures of Dispersion and Variability: Range, QD, AD and SDThiyagu K
 
Z Score,T Score, Percential Rank and Box Plot Graph
Z Score,T Score, Percential Rank and Box Plot GraphZ Score,T Score, Percential Rank and Box Plot Graph
Z Score,T Score, Percential Rank and Box Plot GraphThiyagu K
 
Accessible design: Minimum effort, maximum impact
Accessible design: Minimum effort, maximum impactAccessible design: Minimum effort, maximum impact
Accessible design: Minimum effort, maximum impactdawncurless
 
microwave assisted reaction. General introduction
microwave assisted reaction. General introductionmicrowave assisted reaction. General introduction
microwave assisted reaction. General introductionMaksud Ahmed
 
Explore beautiful and ugly buildings. Mathematics helps us create beautiful d...
Explore beautiful and ugly buildings. Mathematics helps us create beautiful d...Explore beautiful and ugly buildings. Mathematics helps us create beautiful d...
Explore beautiful and ugly buildings. Mathematics helps us create beautiful d...christianmathematics
 
Nutritional Needs Presentation - HLTH 104
Nutritional Needs Presentation - HLTH 104Nutritional Needs Presentation - HLTH 104
Nutritional Needs Presentation - HLTH 104misteraugie
 
Beyond the EU: DORA and NIS 2 Directive's Global Impact
Beyond the EU: DORA and NIS 2 Directive's Global ImpactBeyond the EU: DORA and NIS 2 Directive's Global Impact
Beyond the EU: DORA and NIS 2 Directive's Global ImpactPECB
 
Key note speaker Neum_Admir Softic_ENG.pdf
Key note speaker Neum_Admir Softic_ENG.pdfKey note speaker Neum_Admir Softic_ENG.pdf
Key note speaker Neum_Admir Softic_ENG.pdfAdmir Softic
 
Paris 2024 Olympic Geographies - an activity
Paris 2024 Olympic Geographies - an activityParis 2024 Olympic Geographies - an activity
Paris 2024 Olympic Geographies - an activityGeoBlogs
 
BASLIQ CURRENT LOOKBOOK LOOKBOOK(1) (1).pdf
BASLIQ CURRENT LOOKBOOK  LOOKBOOK(1) (1).pdfBASLIQ CURRENT LOOKBOOK  LOOKBOOK(1) (1).pdf
BASLIQ CURRENT LOOKBOOK LOOKBOOK(1) (1).pdfSoniaTolstoy
 
Russian Escort Service in Delhi 11k Hotel Foreigner Russian Call Girls in Delhi
Russian Escort Service in Delhi 11k Hotel Foreigner Russian Call Girls in DelhiRussian Escort Service in Delhi 11k Hotel Foreigner Russian Call Girls in Delhi
Russian Escort Service in Delhi 11k Hotel Foreigner Russian Call Girls in Delhikauryashika82
 
Activity 01 - Artificial Culture (1).pdf
Activity 01 - Artificial Culture (1).pdfActivity 01 - Artificial Culture (1).pdf
Activity 01 - Artificial Culture (1).pdfciinovamais
 
SOCIAL AND HISTORICAL CONTEXT - LFTVD.pptx
SOCIAL AND HISTORICAL CONTEXT - LFTVD.pptxSOCIAL AND HISTORICAL CONTEXT - LFTVD.pptx
SOCIAL AND HISTORICAL CONTEXT - LFTVD.pptxiammrhaywood
 
Class 11th Physics NEET formula sheet pdf
Class 11th Physics NEET formula sheet pdfClass 11th Physics NEET formula sheet pdf
Class 11th Physics NEET formula sheet pdfAyushMahapatra5
 
Q4-W6-Restating Informational Text Grade 3
Q4-W6-Restating Informational Text Grade 3Q4-W6-Restating Informational Text Grade 3
Q4-W6-Restating Informational Text Grade 3JemimahLaneBuaron
 
IGNOU MSCCFT and PGDCFT Exam Question Pattern: MCFT003 Counselling and Family...
IGNOU MSCCFT and PGDCFT Exam Question Pattern: MCFT003 Counselling and Family...IGNOU MSCCFT and PGDCFT Exam Question Pattern: MCFT003 Counselling and Family...
IGNOU MSCCFT and PGDCFT Exam Question Pattern: MCFT003 Counselling and Family...PsychoTech Services
 
Software Engineering Methodologies (overview)
Software Engineering Methodologies (overview)Software Engineering Methodologies (overview)
Software Engineering Methodologies (overview)eniolaolutunde
 

Último (20)

Disha NEET Physics Guide for classes 11 and 12.pdf
Disha NEET Physics Guide for classes 11 and 12.pdfDisha NEET Physics Guide for classes 11 and 12.pdf
Disha NEET Physics Guide for classes 11 and 12.pdf
 
Measures of Dispersion and Variability: Range, QD, AD and SD
Measures of Dispersion and Variability: Range, QD, AD and SDMeasures of Dispersion and Variability: Range, QD, AD and SD
Measures of Dispersion and Variability: Range, QD, AD and SD
 
Z Score,T Score, Percential Rank and Box Plot Graph
Z Score,T Score, Percential Rank and Box Plot GraphZ Score,T Score, Percential Rank and Box Plot Graph
Z Score,T Score, Percential Rank and Box Plot Graph
 
Accessible design: Minimum effort, maximum impact
Accessible design: Minimum effort, maximum impactAccessible design: Minimum effort, maximum impact
Accessible design: Minimum effort, maximum impact
 
microwave assisted reaction. General introduction
microwave assisted reaction. General introductionmicrowave assisted reaction. General introduction
microwave assisted reaction. General introduction
 
Explore beautiful and ugly buildings. Mathematics helps us create beautiful d...
Explore beautiful and ugly buildings. Mathematics helps us create beautiful d...Explore beautiful and ugly buildings. Mathematics helps us create beautiful d...
Explore beautiful and ugly buildings. Mathematics helps us create beautiful d...
 
Nutritional Needs Presentation - HLTH 104
Nutritional Needs Presentation - HLTH 104Nutritional Needs Presentation - HLTH 104
Nutritional Needs Presentation - HLTH 104
 
Beyond the EU: DORA and NIS 2 Directive's Global Impact
Beyond the EU: DORA and NIS 2 Directive's Global ImpactBeyond the EU: DORA and NIS 2 Directive's Global Impact
Beyond the EU: DORA and NIS 2 Directive's Global Impact
 
Key note speaker Neum_Admir Softic_ENG.pdf
Key note speaker Neum_Admir Softic_ENG.pdfKey note speaker Neum_Admir Softic_ENG.pdf
Key note speaker Neum_Admir Softic_ENG.pdf
 
Paris 2024 Olympic Geographies - an activity
Paris 2024 Olympic Geographies - an activityParis 2024 Olympic Geographies - an activity
Paris 2024 Olympic Geographies - an activity
 
BASLIQ CURRENT LOOKBOOK LOOKBOOK(1) (1).pdf
BASLIQ CURRENT LOOKBOOK  LOOKBOOK(1) (1).pdfBASLIQ CURRENT LOOKBOOK  LOOKBOOK(1) (1).pdf
BASLIQ CURRENT LOOKBOOK LOOKBOOK(1) (1).pdf
 
Russian Escort Service in Delhi 11k Hotel Foreigner Russian Call Girls in Delhi
Russian Escort Service in Delhi 11k Hotel Foreigner Russian Call Girls in DelhiRussian Escort Service in Delhi 11k Hotel Foreigner Russian Call Girls in Delhi
Russian Escort Service in Delhi 11k Hotel Foreigner Russian Call Girls in Delhi
 
Activity 01 - Artificial Culture (1).pdf
Activity 01 - Artificial Culture (1).pdfActivity 01 - Artificial Culture (1).pdf
Activity 01 - Artificial Culture (1).pdf
 
SOCIAL AND HISTORICAL CONTEXT - LFTVD.pptx
SOCIAL AND HISTORICAL CONTEXT - LFTVD.pptxSOCIAL AND HISTORICAL CONTEXT - LFTVD.pptx
SOCIAL AND HISTORICAL CONTEXT - LFTVD.pptx
 
Código Creativo y Arte de Software | Unidad 1
Código Creativo y Arte de Software | Unidad 1Código Creativo y Arte de Software | Unidad 1
Código Creativo y Arte de Software | Unidad 1
 
Class 11th Physics NEET formula sheet pdf
Class 11th Physics NEET formula sheet pdfClass 11th Physics NEET formula sheet pdf
Class 11th Physics NEET formula sheet pdf
 
Mattingly "AI & Prompt Design: Structured Data, Assistants, & RAG"
Mattingly "AI & Prompt Design: Structured Data, Assistants, & RAG"Mattingly "AI & Prompt Design: Structured Data, Assistants, & RAG"
Mattingly "AI & Prompt Design: Structured Data, Assistants, & RAG"
 
Q4-W6-Restating Informational Text Grade 3
Q4-W6-Restating Informational Text Grade 3Q4-W6-Restating Informational Text Grade 3
Q4-W6-Restating Informational Text Grade 3
 
IGNOU MSCCFT and PGDCFT Exam Question Pattern: MCFT003 Counselling and Family...
IGNOU MSCCFT and PGDCFT Exam Question Pattern: MCFT003 Counselling and Family...IGNOU MSCCFT and PGDCFT Exam Question Pattern: MCFT003 Counselling and Family...
IGNOU MSCCFT and PGDCFT Exam Question Pattern: MCFT003 Counselling and Family...
 
Software Engineering Methodologies (overview)
Software Engineering Methodologies (overview)Software Engineering Methodologies (overview)
Software Engineering Methodologies (overview)
 

Organising and Summarising Raw Data

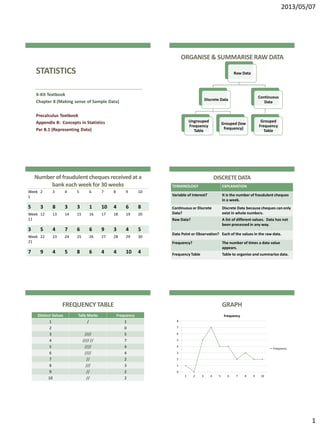
  • 1. 2013/05/07 1 STATISTICS X-Kit Textbook Chapter 8 (Making sense of Sample Data) Precalculus Textbook Appendix B: Concepts in Statistics Par B.1 (Representing Data) ORGANISE& SUMMARISERAW DATA Raw Data Discrete Data Ungrouped Frequency Table Grouped (low frequency) Continuous Data Grouped Frequency Table Number of fraudulent cheques receivedat a bank each week for 30 weeks Week 1 2 3 4 5 6 7 8 9 10 5 3 8 3 3 1 10 4 6 8 Week 11 12 13 14 15 16 17 18 19 20 3 5 4 7 6 6 9 3 4 5 Week 21 22 23 24 25 26 27 28 29 30 7 9 4 5 8 6 4 4 10 4 DISCRETEDATA TERMINOLOGY EXPLANATION Variable of Interest? It is the number of fraudulent cheques in a week. Continuous or Discrete Data? Discrete Data because cheques can only exist in whole numbers. Raw Data? A list of different values. Data has not been processed in any way. Data Point or Observation? Each of the values in the raw data. Frequency? The number of times a data value appears. Frequency Table Table to organise and summarise data. FREQUENCYTABLE Distinct Values Tally Marks Frequency 1 / 1 2 0 3 //// 5 4 //// // 7 5 //// 4 6 //// 4 7 // 2 8 /// 3 9 // 2 10 // 2 GRAPH 0 1 2 3 4 5 6 7 8 1 2 3 4 5 6 7 8 9 10 Frequency Frequency
  • 2. 2013/05/07 2 Truck Data: weights(in tonnes) of 20 fully loaded trucks Truck 1 2 3 4 5 6 7 8 9 10 Weight 4.54 3.81 4.29 5.16 2.51 4.63 4.75 3.98 5.04 2.80 Truck 11 12 13 14 15 16 17 18 19 20 Weight 2.52 5.88 2.95 3.59 3.87 4.17 3.30 5.48 4.26 3.53 CONTINUOUSDATA TERMINOLOGY EXPLANATION Variable of Interest? The weight of a loaded truck. Continuous or Discrete Data? Continuous Data, you can get any number of values between two given values. Frequency Table Table to organise and summarise data. Grouped Frequency Table FREQUENCYTABLE Class Intervals Tally Marks Frequency 𝟐. 𝟓 ≤ 𝒙 ≤ 𝟑. 𝟎 //// 4 𝟑. 𝟎 ≤ 𝒙 ≤ 𝟑. 𝟓 / 1 𝟑. 𝟓 ≤ 𝒙 ≤ 𝟒. 𝟎 //// 5 𝟒. 𝟎 ≤ 𝒙 ≤ 𝟒. 𝟓 /// 3 𝟒. 𝟓 ≤ 𝒙 ≤ 𝟓. 𝟎 /// 3 𝟓. 𝟎 ≤ 𝒙 ≤ 𝟓. 𝟓 // 2 𝟓. 𝟓 ≤ 𝒙 ≤ 𝟔. 𝟎 // 2 GRAPH 0 1 2 3 4 5 6 0 - 2.5 2.5 - 3.0 3.0 - 3.5 3.5 - 4.0 4.0 - 4.5 4.5 - 5.0 5.0 - 5.5 5.5 - 6.0 Frequency Frequency PRESENTATIONOF DATA Frequency Table Pictogram Bar Graphs Histogram Pie Chart Line Graphs Stem-and- Leaf Ogive FREQUENCYTABLE Class Intervals Frequency Cumulative Frequency 𝟐. 𝟓 ≤ 𝒙 ≤ 𝟑. 𝟎 4 4 𝟑. 𝟎 ≤ 𝒙 ≤ 𝟑. 𝟓 1 5 𝟑. 𝟓 ≤ 𝒙 ≤ 𝟒. 𝟎 5 10 𝟒. 𝟎 ≤ 𝒙 ≤ 𝟒. 𝟓 3 13 𝟒. 𝟓 ≤ 𝒙 ≤ 𝟓. 𝟎 3 16 𝟓. 𝟎 ≤ 𝒙 ≤ 𝟓. 𝟓 3 19 𝟓. 𝟓 ≤ 𝒙 ≤ 𝟔. 𝟎 1 20
  • 3. 2013/05/07 3 OGIVE 0 5 10 15 20 25 2.5 3 3.5 4 4.5 5 5.5 6 Cumulative Frequency Cumulative Frequency Pictogram: Net Worthof America'sRichest Billionaires Pie Chart: Average Annual Expenses in a U.S. Household EXAMPLE In a class with 30 pupils there are 12 with blue eyes; 9 with brown eyes; 4 with dark brown eyes and 5 with green eyes. 1. Draw a pie chart showing this information. 2. Calculate the fraction and percentage represented by each eye colour. EXAMPLE: SOLUTION Colour of Eyes Frequency Angle at Centre Percentage Blue 12 𝟏𝟐 𝟑𝟎 × 𝟑𝟔𝟎° = 𝟏𝟒𝟒° 𝟏𝟐 𝟑𝟎 × 𝟏𝟎𝟎 = 𝟒𝟎% Brown 9 𝟗 𝟑𝟎 × 𝟑𝟔𝟎° = 𝟏𝟎𝟖° 𝟗 𝟑𝟎 × 𝟏𝟎𝟎 = 𝟑𝟎% Dark Brown 4 𝟒 𝟑𝟎 × 𝟑𝟔𝟎° = 𝟒𝟖° 𝟒 𝟑𝟎 × 𝟏𝟎𝟎 = 𝟏𝟑, 𝟑% Green 5 𝟓 𝟑𝟎 × 𝟑𝟔𝟎° = 𝟔𝟎° 𝟓 𝟑𝟎 × 𝟏𝟎𝟎 = 𝟏𝟔, 𝟕% Total 30 𝟑𝟔𝟎° 𝟏𝟎𝟎% PIE CHART Blue Brown Dark Brown Green
  • 4. 2013/05/07 4 Bar Graph: Expected U.S. PopulationAged 100 and Over DoubleBar Graph: Fuel Efficiency LineGraph: Effectof Inflationon the Valueof a $100,000 LifeInsurance Policy DoubleLineGraph: Populationsof Californiaand Texas Stem-and-Leaf Plot Represent the data below in a stem-and-leaf plot: 152; 165; 143; 139; 138; 144; 150; 158; 161; 157; 143; 156; 162; 165; 139; 158; 151; 167; 166; 160; 170; 132; 145; 151; 148; 147; 171; 155; 146; 141. Stem-and-Leaf Plot STEM LEAVES 13 9; 8; 9; 2 14 3; 4; 3; 5; 8; 7; 6; 1 15 2; 0; 8; 7; 6; 8; 1; 1; 5 16 5; 1; 2; 5; 7; 6; 0 17 0; 1