Effect of land use and land cover change on some soil chemical and physical properties in ameleke watershed, south ethiopia
•
2 recomendaciones•576 vistas

The International Institute for Science, Technology and Education (IISTE). Science, Technology and Medicine Journals Call for Academic Manuscripts

Recomendados
Recomendados
Más contenido relacionado
La actualidad más candente
La actualidad más candente (20)
Similar a Effect of land use and land cover change on some soil chemical and physical properties in ameleke watershed, south ethiopia
Similar a Effect of land use and land cover change on some soil chemical and physical properties in ameleke watershed, south ethiopia (19)
Más de Alexander Decker
Más de Alexander Decker (20)
Último
Último (20)
Effect of land use and land cover change on some soil chemical and physical properties in ameleke watershed, south ethiopia
- 1. Journal of Environment and Earth Science www.iiste.org ISSN 2224-3216 (Paper) ISSN 2225-0948 (Online) Vol.4, No.13, 2014 32 Effect of Land Use and Land Cover Change on Some Soil Chemical and Physical Properties in Ameleke Watershed, South Ethiopia Gebrekidan Worku1 , Amare Bantider (Ph.D)2 and Habtamu Temesgen3 1. Debretabor University, Department of Natural Resource Management, ETHIOPIA kidanw1@gmail.com 2. Dilla University, Sustainable Land Management (Ph.D), ETHIOPIA amare_zerfe@yahoo.com 3. Dilla University, Department of Land Resource Management, ETHIOPIA habte023@yahoo.com Abstract This study investigates the effect of land use and land cover change on some soil chemical and physical properties. Soil samples were collected from six sample sites. From these sample sites, composite soil samples were collected from agroforestry, crop land, grass land and shrub lands in three replications at 0-15cm and 15-30 cm depth. Soil samples’ chemical and physical properties were analyzed in soil laboratory. Laboratory result shows that there is a significant difference (p < 0.05) in soil available K, TN, OC, OM, available P, silt and sand content among land use and land covers of study watershed. There is also a difference in soil colour among land use and land covers. But there is no significant difference in soil pH and CEC among land use and land covers. The difference in soil properties among land use land covers is more significant at 0-15cm depth than at 15- 30cm depth. Most soil nutrients subject to laboratory analysis are low at croplands of Cheketa sub catchment and grass lands of Debeka sub catchment. This study recommends a need to promote sustainable soil management practices and improving management of grass and shrub land uses in the watershed. Key words:land use and land cover change, changes in soil properties 1. Introduction Soils resources response to changes in land use and land cover is tried to study at different times and spatial scale. In tropical region, conversion of climax vegetation to human managed land use system trigger low soil structure stability, loss of organic matter, reduction in nutrient stock, reduction in soil organic carbon1 . Besides to this, conversion of natural vegetation to other land uses exposes the land for erosion in sloping areas. In this region, shifting cultivation and establishment of rubber tree plantations showed a decline in concentrations and stocks of soil organic carbon and total nitrogen than natural forest2 . In Bale, South east Ethiopia soil organic carbon and total nitrogen were high in natural forest while these were low in cultivated fields3 . Contrary to the above studies, in Mexico land-use change did not lead to change in some soil chemical properties rather only change in soil physical properties4 . There were no significant differences in available phosphorus, organic carbon, and total nitrogen while soils in pastureland were significantly more compacted in all layers than soils in agriculture land. From the above literatures we can understand that it is hardly possible to draw conclusion on the effect of land cover and land use change on properties of soil resource. So it is strongly necessary to take studies at local spatial scale. Because, the physical and chemical properties of soil has different implications ranging from productivity of the land to quality of water. For instance the concentrations of some chemicals in the soil were considered as a potential threat of aquatic organisms5. The upper stream of Ameleke watershed is under agroforestry and crop land while the lower and middle streams of the watershed are grass land and shrub land use and land cover types. In the uppers stream of the watershed natural forests and grass land are changing in to agroforestry and crop lands. In the middle and lower part of the watershed, there is overgrazing on grass lands and shrub lands and recently croplands are expanding. More woresly removal of vegetation cover in this area has a twofold effect on soil of this catchment. Vegetation in this area is a means to increase soil fertility and also serves the soil to protect from erosion. Standing from this existing condition this study tried to examine the effect of land use and land cover change on some soil chemical and physical properties. 2. Materials and Methods 2.1 Description of Study Area Ameleke watershed is located between 6°15’N to 6°26’N latitude and 38°10’E to 38°12’E longitude. The watershed has an area of 69. 69 km. sq. Ameleke watershed is one of the tributary of Gidabo River. The mean monthly temperature of this watershed ranges from 23.2 0 C in July to 30.2 0 C in January. Regarding rainfall, mean annual rainfall ranges from 800 to 1400 mm in the upper part of the watershed while it is 105.5 mm in the
- 2. Journal of Environment and Earth Science www.iiste.org ISSN 2224-3216 (Paper) ISSN 2225-0948 (Online) Vol.4, No.13, 2014 33 lower stream of the watershed. The rain has bimodal pattern where March to June and September to November are rainy seasons. The rainfall variability is very high. Seasonally Bega has high rainfall variability than Belg and kiremt. In Ameleke watershed altitude ranges from 1200 to 2000 masl. In The upper stream of the watershed coffee, Enset, maize and teff are major crops where as in the lower and middle stream of the watershed livestock production is the main stay of the community. 2.2 Methods of the Study Biosequential soil sampling approach was followed rather than chronosequential soil sampling approach. Having this soil sampling approach, soil samples were collected from six sample sites of three sub catchments. A composite soil samples from five pits were taken from crop land, grass land, agroforestry and shrub land at 0- 15cm and 15cm-30cm depth in three replications. From each sub catchment 36 soil samples, totally 108 soil samples (3 replications ×6 sample sites ×3 land use/land covers × 2 soil depths) were collected for soil laboratory analysis. Tools and materials used were; Munsell color notation, soil survey sheet format, GPS, spatula, auger, back hoe, camera and appropriate size sample containers (polyethylene bags). Procedures and precautions were taken during sampling. Among these samples were not taken from manure areas, litters were removed by spatula before sampling, samples were taken from similar elevation, slope and micro topography for each sample site. In the soil laboratory soil pH, texture, available Potassium, Cation Exchange Capacity, Total Nitrogen, Organic Carbon, Organic Matter and available Phosphorus were analyzed. The samples were prepared and analyzed using the standard procedures in laboratory of Oromia Water Works Design & Supervision Enterprise. Texture was determined by Bouyoucos Hydrometer method, pH by using pH meter, organic carbon by titration with ferrous ammonium sulphate using diphenylamine indicator6. Total nitrogen was determined by Kjeldahl method7 , available phosphorus by Olsen extraction method 8 , CEC 9 and available Potassium were by ammonium acetate method and through Kreading using Atomic Absorption Spectrometer 10 . Finally the soil properties in one sample site under agroforestry, cropland, grass land and shrub land were compared. This enables us to see the impact of spatial land use and land cover change on soil properties. After having data of land use and cover change and soil chemical and physical properties, effect of land use and land cover on soil properties were analyzed by ANOVA. Beside to this, LSD post hoc multiple comparisons tests of means was used to see the mean significance difference level between land uses and soil properties. 3. Result and Discussion After the collection of soil samples from different land use and land cover types at 0-15 cm and 15-30 cm depths, soils texture, pH, CEC, available K, TN, OC, OM and total available P content was tested. Laboratory result showed some soil properties are low while other soil properties are higher in comparison with soils of tropical region and other parts of Ethiopia. Except soil pH and Cation Exchange Capacity, there is a significance difference in soil properties on different land use and land covers (Table 1 & table2). The difference is more pronounced on the top soil (0-15cm depth) than 15-30cm depth. It indicates land use and land cover change is active determinant of soil properties. If geology, climate and soil type are significant factors for change in soil properties, we could not found this much difference in soil properties within this small difference of depth. 3.1 Soil organic carbon (OC) and organic matter (OM) ANOVA and post hoc multiple comparisons firmly show that there is a significant difference (P<0.01) of soil OC and OM content in different land use/land cover types (Table 1 and table 2). The difference is very strong between agroforestry and cropland. They are relatively highest on soils of agroforestry (the overall mean being 2.4±1.0 for OC and 4.3±1.8 for OM) and shrub lands (the overall mean being 2.06±0.63 for OC and 3.56±1.08 for OM) than soils in cropland (1.49±0.73 for OC and 2.57±1.26 for OM) and grazing lands (1.71±0.81 for OC and 2.95±1.48 for OM). It implies there is more supply of litters and return of OM to the soils under agroforestry and shrub land system and low OC on crop lands is due to removal of biomass from the field. In agreement to this, in Southern Ethiopia, OC content of soils in _Birbira_ (Millettia ferruginea) dominated agroforestry was higher than the carbon content of soils of open fields11 . In Ameleke micro-watershed, a soil on the agroforestry and shrub lands seems good terrestrial sequesters, though carbon content is declining with depth. This might be because it is on the top soil where more biological processes take place. By scientific community, it is frequently cited that clay soil has high organic carbon. But croplands of Cheketa Area in Ameleke micro- watershed have clay soil and in parallel low organic carbon. This might be due to relatively more tillage practices on cropland. Tillage practice is responsible for reduction in organic matter of the soil12 . 3.2 Total Nitrogen (TN) In Ameleke micro-watershed, TN content of the surface soil is mostly greater than 0.1% and of course, there is a variation of it among different land uses and land cover types. ANOVA showed there is significant difference (P< 0.01) in TN among land use/ land cover types. Low TN is observed on croplands. This is due to more tillage
- 3. Journal of Environment and Earth Science www.iiste.org ISSN 2224-3216 (Paper) ISSN 2225-0948 (Online) Vol.4, No.13, 2014 34 and no addition of fertilizer that replaced the removed TN by continuous tillage. The result of this study agrees with several studies conducted in Ethiopia and elsewhere (e.g. 3, 13) . 3.3 Available Phosphorus (AP) Among the properties of soil subject to laboratory analysis, AP content of the soil in Ameleke micro-watershed showed a large deviation among land use/land cover types. For instance at 0-15 cm soil depth, it appeared 1.83ppm on grazing land and 43.72ppm on agroforestry land of Cheketa Area. AP is highest on agroforestry and shrub lands while it is lowest on grass lands of all case study areas, which is similar to organic carbon and organic matter. In agreement to this, in Costa Rica, Phosphorus content of the surface- 25cm depth of soil of agroforestry was higher than soil in pasture land14 . In Southern Ethiopia, phosphorus content of soils in Birbira (Millettia ferruginea) dominated agroforestry was higher than the phosphorus content of open fields11 . In contrast to this study, there was no difference on the phosphorus content of the soil under primary and secondary forest, seasonal agricultural land, pasture land and fruit plantation on tropical soils, southeast Mexico4 . Phosphorus could be found and transported in different form. In an Amazonian Meromictic Black-Water Lake, forest streams have played significant role in transporting the dissolved phosphorus from forests15 . 3.4 Available Potassium (AK) Potassium content of soils in Ameleke micro-watershed have slightly higher available potassium with the average value of 1.94 Cmole/kg than Potassium content of tropical soils with the average value of 1.65Cmole/kg 16 . The ANOVA analysis revealed that there is significant difference (P<0.01) of AK among land use/ land cover types. It is highest on agroforestry and lowest on cropland. Similar to this study, potassium content was among the soil properties showed a significant difference on the top soils of _Bisana_ (Croton macrostachyus) trees dominated agroforestry land and lands away from Bisana (Croton macrostachyus) trees in north-western Ethiopia17 . 3.5 Soil pH The overall pH value of the studied watershed ranges from moderately acidic (pH 5.56 on cropland of Cheketa Area) to neutral (pH 7.16 on agroforestry land of Debeka Area). ANOVA and LSD post hoc multiple comparisons revealed that there is insignificant difference (at 0.01 probability level) in pH value of soils found on different land use and land cover classes. 3.6 Cation Exchange Capacity (CEC) The soils of Ameleke micro-watershed have good CEC than tropical soils. In tropical region, soils of bush vegetation and permanent cropping have CEC of 12.5 Cmole/kg and 8.8 Cmole/kg respectively on the top 15cm depth 16 . But CEC of soil of Ameleke micro- watershed ranges from 29.2 in croplands at Cheketa Area and 55.6 on the grass lands of Gololcha Area. The ANOVA test did not yield significant difference at 0.01 probability levels among land use/ land cover types. This result is different from several studies for instance18 . 3.7 Soil Texture In the croplands of Cheketa Area, the soil constitute on the average 48% clay, 27% sand and 24 % silt. While in the croplands of Gololcha Area the soil constitute on the average 46 % sand, 27 % s clay and 27% silt. ANOVA further ensures soil texture is significantly changing within land uses of in the study areas within the watersheds. This finding is different from the general accepted knowledge that ‘soil texture is the property of soil which is not subject to easy modification’19 . Similar studies concluded that LUCC significantly determine soil texture on their study in Cameron20 . But in Bako area of western Oromia, Ethiopia, soil texture did not show any change between ‘Zigba’ (Cordia africana) dominated agroforestry and open fields21 . 3.8 Soil Color Soil color helps to indicate OM content, water content, and oxidation states of iron and manganese oxides in the soil. In Ameleke, there is a difference in soil colour between different land uses (Figure 2). 2.5YR2.5/4 and 10YR3/3 from crop lands, 10YR2/1 and 2.5Y3/2 from agroforestry land and 5YR4/3 from grass lands were identified. On agroforestry land the soil has relatively black color and at the same time the soil has high organic matter content. On crop land soil has dark reddish brown color. It seems that there is oxidation of iron on cropland use. The soil has reddish black and grayish color on shrub land. In agreement to this study, vegetation cover type was among the principal factors of soil color change and soil color is strongly correlated with texture, organic carbon content, Cation Exchange in the Mediterranean region22 . 4. Conclusion Soils of Ameleke watershed are good in their CEC, available K, and available P content in comparison with soils of tropical region16 and organic carbon and organic matter in comparison with FAO recommendation12 . Total Nitrogen in the soils of Ameleke watershed is also good as it is expected from 0.02%- 5% of Total nitrogen from a representative soil 19 . In Ameleke watershed, there is a significant difference in soil properties among LULCs. Soil available K, total N, OC, OM, texture and color are significantly different when compared among the LULCs of the entire watershed and within the LULCs of sub catchments. The difference is mostly found between agroforestry land and cropland, agroforestry and grass land, shrub land and crop land and shrub land
- 4. Journal of Environment and Earth Science www.iiste.org ISSN 2224-3216 (Paper) ISSN 2225-0948 (Online) Vol.4, No.13, 2014 35 and grass land. But there is no significant difference in soil CEC and pH among land use and land cover types of Ameleke watershed. The difference in soil properties among LULCs is more significant on 0-15 soil depth than on 15- 30cm soil depth. 5. Acknowledgement This is my gratitude to acknowledge Dilla University NUFFIC Project, Abaya woreda World Lutheran Organization, Oromia water works and design enterprise and Farmers and DAs of the watershed. References 1.Hartemink, A.E., Veldkamp,T. & Bai, Z.. Land Cover Change and Soil Fertility Decline in Tropical Regions. Turk J Agric For , 32, 195-213(2008) 2.Yang, J.C., Huang, J.H., Pan, Q.M., Tang, J.W. & Han, X.G., Long-term impacts of land-use change on dynamics of tropical soil carbon and nitrogen pools. Journal of Environmental Science, 16(2), 256-61 (2004) 3.Yifru, A.,& Taye, B., Effects of land use on soil organic carbon and nitrogen in soils of Bale, Southeastern Ethiopia. Tropical and Subtropical Agroecosystems, 14, 229 – 235 (2011) 4.Geissen, V., Hernández, R.S., Kampichler , C R. Ramos-Reyes, R., Sepulveda, A., Goana, S.O., Jong , E.B. , Lwanga, H. & Daumas, H., Effects of land-use change on some properties of tropical soils — An example from Southeast Mexico. Geoderma, 151, 87–97 (2009) 5.Manthan, A.T., and Mankodi Pradeep, C. M., Physico-Chemical status of Danteshwar pond of Vadodara City, Gujarat India and its Environmental Implications. Int. Res. J. Environment Sci., 2(10), 58-62, (2013). 6.Schnitzer , M. , Total carbon, organic matter, and carbon. In: Miller RH, Keeney DR.editors. Methods of soil analysis, part II, 2nd ed. Agronomy monograph. American Society of Agronomy , 9, 539-577 (1982) 7.Bremner, JM. And Mulvaney ,CS., Nitrogen Total. In : Miller RH, Keeney DR.editors. Methods of soil analysis. American Society of Agronomy. 2, 595-624(1982) 8.Olsen, PA., Cole CV., Watanabe FS. And Dean LA., 1954. Estimation of available phosphorous in soils by extraction with sodium bicarbonate. US Department of Agriculture, USDA. 9.Chapman, HD., Cation exchange capacity by ammonium satuaration. In Black CA (ed). Methods of soil analysis. Part II. American Society of Agronomy, 891-901(1965) 10.Black , CA., Evans, DD., White, JL., Ensminger ,LE and Clark, FE., 1965. Methods of soil analysis, part I. Physical and mineralogical properties including statistics of measurement and sampling. Madison, WI: Am.Soc. Agro., Inc.. 11.Hailu, T., Negash L., & Olsson, M., Millettia ferruginea from southern Ethiopia: Impacts on soil fertility and growth of maize. Agroforestry Systems, 48, 9-24(2000) 12.FAO 2005. The Importance of soil organic matter. Key to drought-resistant soil and sustained food and production. Rome. 13.Eyayu M, Heluf G, Tekalign M and Mohammed A., Effects of land-use change on selected soil properties in the Tara Gedam catchment and adjacent agro-ecosystems, North-West Ethiopia. Ethiopian Journal of Natural Resources 11(1), 35-62 (2009) 14.Tornquist, C.G., Hons, F.M., Feagley, S.E. & Haggar. J.. Agroforestry system effects on soil characteristics of the SarapiquõÂ region of Costa Rica. Agriculture, Ecosystems and Environment, 73, 19 – 28 (1999) 15.Aprile F.1* and Darwich A.J., Dynamics of Phosphorous in an Amazonian Meromictic Black-Water Lake. Int. Res. J. Environment Sci., 2(10), 28-38 (2013). 16. Hartemink, A.E., Assessing soil fertility decline in the tropics using soil chemical data. Advances in Agronomy, 89, 179-225 (2006) 17.Yeshanew, A., Tekalign, M. & Olsson, M., Changes in some soil chemical properties under scattered Croton macrostachyus trees in the traditional agroforestry system in north-western Ethiopia. EJNR, 1(2), 215-233 (1999) 18.Nega E, and Heluf G., Influence of land use changes and soil depth on cation exchange capacity and contents of exchangeable bases in the soils of Senbat watershed, West Ethiopia. Ethiopian Jornal of Natural Resources, 11(2), 195-206 (2009) 19.Brady NC. 2002. The nature and properties of soils, 10th edition. The Eastern Economy Edition. New Delhi, India: Asoke K. Ghosh, Prentice-Hall, Inc. 20.Agoumé, V. & Birang,A.M., Impact of Land-use Systems on some Physical and Chemical Soil Properties of an Oxisol in the Humid Forest Zone of Southern Cameroon. TROPICULTURA, 27(1), 15-20(2009) 21.Abebe, Y., Fisseha, I. & Olsson, M., Contribution of indigenous trees to soil properties: the case of scattered trees of Cordia africana in croplands of western Oromia. EJNR, 3(2), 245-270 (2001) 22.Maranon S, Delgado M, Melgosa G, Hita M, Delgado R. 1997. Cielab color parameters and their relationship to soil characteristics in Mediterranean red soils. Soil Science, 162(11), 833-842 (1997)
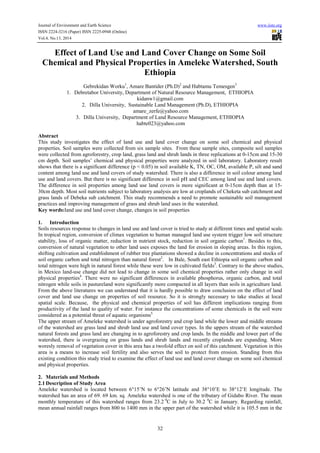
- 5. Journal of Environment and Earth Science www.iiste.org ISSN 2224-3216 (Paper) ISSN 2225-0948 (Online) Vol.4, No.13, 2014 36 Tables and figures Figure - 1 Map of Ameleke watershed A. Soil colour on cropland (left) and agroforesty B. Munsell soil colour Char Land (right) Figure -2 soil colour study
- 6. Journal of Environment and Earth Science www.iiste.org ISSN 2224-3216 (Paper) ISSN 2225-0948 (Online) Vol.4, No.13, 2014 37 Table- 1 Soil properties in relation to land use and land covers ( mean ± Sd) LULC Depth in cm pH AV. K (Cmol(+)/kg) CEC (Cmol (+)/kg) TN (%) OC (%) OM (%) Av. P(ppm) SAND (%) SILT (%) CLAY (%) Crop land 0-15 6.34 ± 0.7 1.41 ± 1.1 36.82 ± 8.7 0.150 ± .06 1.78 0 ± .7 3.081 ± .3 6.044 ± .8 40.55 ± .5 27.05 ± 5.3 32.381 ± 1.5 15-30 6.20 ± .70 0.96 ± 0.8 36.951 ± .02 0.100 ± .04 1.190 ± .5 2.05 ± 0.9 3.83 ± 4.9 39.11 ± 1.07 22.61 ± 2.7 38.28 ± 1.1 Over all 6.30 ± 0.7 1.18 ± 0.99 36.89 ± 9.38 0.12 ± .06 1.49 ± 0.73 2.57 ± 1.26 4.93 ± 4.95 39.831.29 24.83-4.74 35.33 ± 1.33 Grass land 0-15 6.29 ± .5 1.03 ± 0.2 42.35 ± 1.1 .17 0 ± .07 2.00 0 ± .9 3.461 ± .57 2.242 ± .06 39.505 ± .86 23.77 ± 7.6 36.72 ± 9.7 15-30 6.37 ± 0.6 0.74 ± 0.26 43.07 ± 1.16 0.12 ± 0.5 1.42 0 ± .6 2.44 ± 1.0 0.92 ± 0.5 37.39 ± 5.9 22.22 ± 7.8 40.39 ± 1.0 Over all 6.34 ± 0.5 0.88 ± 0.27 42.71 ± 1.12 0.15 ± 0.07 1.71 ± 0.81 2.95 ± 1.40 1.58 ± 1.63 38.44 ± 5.92 23.00 ± 7.70 38.55 ± 1.01 Agro forestry 0-15 6.61 ± 0.5 3.66 ± 1.9 44.07 ± 7.9 0.28 ± 0.06 3.25 ± 0.73 5.60 ± 1.27 33.2 ± 1.72 49.66 ± .83 30.92 ± 4.66 19.42 ± 1.54 15-30 6.66 ± 0.6 1.92 ± 1.14 38.00 5 ± .2 0.13 ± 0.03 1.54 ± 0.4 2.67 ± 0.69 17.37 ± 1.9 42.33 ± 1.02 25.58 ± 4.29 32.08 ± 9.2 Over all 6.66 ± 0.5 2.79 ± 1.87 41.03-7.25 0.20 ± 0.09 2.40 ± 1.0 4.13 ± 1.8 23.66 ± 2.01 52.91 ± 8.83 28.25 ± 5.16 25.75 ± 1.40 Shrub land 0-15 6.32 ± 0.3 2.78 ± 1.6 36.30 ± 1.3 .20 ± 005 2.34 ± 0.6 4.04 ± 1.13 22.15 ± 1.13 54.50 ± 9.89 35.33 ± 8.52 10.16 ± 7.02 15-30 6.45 ± 0.5 1.57 ± 0.8 40.16 ± 8.6 0.15 ± 0.45 1.79 ± 0.5 3.08 ± 0.88 12.01 ± 1.34 51.33 ± 8.23 32.83 ± 9.55 15.83 ± 4.85 Over all 6.38 ± 0.4 2.17 ± 1.3 38.23 ± 1.06 0.18 ± 0.05 2.06 ± 0.63 3.56 ± 1.08 17.08 ± 1.36 42.0 ± 1.20 34.00 ± 8.73 13.00 ± 6.48 Over all 0-15 6.38 ± 0.57 1.94 ± .16 40.21 ± 1.01 0.19 ± 0.83 2.24 ± 0.9 3.87 ± 1.67 12.61 ± 1.56 43.78 ± 1.4 27.74 ± 7.29 28.48 ± 1.55 15-30 6.410 ± .63 1.17 ± 0.97 39.58 ± 9.89 .12 ± 0.64 1.41 ± 0.54 2.43 ± 0.93 6.78 ± 1.21 40.61 ± 9.74 24.28 ± 6.80 35.11 ± 1.23 Table-2 ANOVA between land use and land covers and soil properties *- significant at 0.05 Sum of Squares Df Mean Square F Sig. PH Between Groups 2.138 3 .713 2.009 .117 Within Groups 36.900 104 .355 Total 39.039 107 TN Between Groups .096 3 .032 6.328 .001* Within Groups .525 104 .005 Total .621 107 OC Between Groups 13.141 3 4.380 6.379 .001* Within Groups 71.412 104 .687 Total 84.553 107 OM Between Groups 39.030 3 13.010 6.375 .001* Within Groups 212.231 104 2.041 Total 251.261 107 AVP Between Groups 8506.657 3 2835.552 23.857 .000* Within Groups 12360.958 104 118.855 Total 20867.615 107 AVK Between Groups 62.551 3 20.850 15.547 .000* Within Groups 139.479 104 1.341 Total 202.030 107 CEC Between Groups 675.049 3 225.016 2.346 .077 Within Groups 9975.211 104 95.915 Total 10650.260 107 SAND Between Groups 2434.111 3 811.370 6.437 .000* Within Groups 13108.806 104 126.046 Total 15542.917 107 SILT Between Groups 1278.574 3 426.191 10.259 .000* Within Groups 4320.417 104 41.542 Total 5598.991 107 CLAY Between Groups 7212.130 3 2404.043 16.830 .000* Within Groups 14855.389 104 142.840 Total 22067.519 107
- 7. The IISTE is a pioneer in the Open-Access hosting service and academic event management. The aim of the firm is Accelerating Global Knowledge Sharing. More information about the firm can be found on the homepage: http://www.iiste.org CALL FOR JOURNAL PAPERS There are more than 30 peer-reviewed academic journals hosted under the hosting platform. Prospective authors of journals can find the submission instruction on the following page: http://www.iiste.org/journals/ All the journals articles are available online to the readers all over the world without financial, legal, or technical barriers other than those inseparable from gaining access to the internet itself. Paper version of the journals is also available upon request of readers and authors. MORE RESOURCES Book publication information: http://www.iiste.org/book/ IISTE Knowledge Sharing Partners EBSCO, Index Copernicus, Ulrich's Periodicals Directory, JournalTOCS, PKP Open Archives Harvester, Bielefeld Academic Search Engine, Elektronische Zeitschriftenbibliothek EZB, Open J-Gate, OCLC WorldCat, Universe Digtial Library , NewJour, Google Scholar
- 8. Business, Economics, Finance and Management Journals PAPER SUBMISSION EMAIL European Journal of Business and Management EJBM@iiste.org Research Journal of Finance and Accounting RJFA@iiste.org Journal of Economics and Sustainable Development JESD@iiste.org Information and Knowledge Management IKM@iiste.org Journal of Developing Country Studies DCS@iiste.org Industrial Engineering Letters IEL@iiste.org Physical Sciences, Mathematics and Chemistry Journals PAPER SUBMISSION EMAIL Journal of Natural Sciences Research JNSR@iiste.org Journal of Chemistry and Materials Research CMR@iiste.org Journal of Mathematical Theory and Modeling MTM@iiste.org Advances in Physics Theories and Applications APTA@iiste.org Chemical and Process Engineering Research CPER@iiste.org Engineering, Technology and Systems Journals PAPER SUBMISSION EMAIL Computer Engineering and Intelligent Systems CEIS@iiste.org Innovative Systems Design and Engineering ISDE@iiste.org Journal of Energy Technologies and Policy JETP@iiste.org Information and Knowledge Management IKM@iiste.org Journal of Control Theory and Informatics CTI@iiste.org Journal of Information Engineering and Applications JIEA@iiste.org Industrial Engineering Letters IEL@iiste.org Journal of Network and Complex Systems NCS@iiste.org Environment, Civil, Materials Sciences Journals PAPER SUBMISSION EMAIL Journal of Environment and Earth Science JEES@iiste.org Journal of Civil and Environmental Research CER@iiste.org Journal of Natural Sciences Research JNSR@iiste.org Life Science, Food and Medical Sciences PAPER SUBMISSION EMAIL Advances in Life Science and Technology ALST@iiste.org Journal of Natural Sciences Research JNSR@iiste.org Journal of Biology, Agriculture and Healthcare JBAH@iiste.org Journal of Food Science and Quality Management FSQM@iiste.org Journal of Chemistry and Materials Research CMR@iiste.org Education, and other Social Sciences PAPER SUBMISSION EMAIL Journal of Education and Practice JEP@iiste.org Journal of Law, Policy and Globalization JLPG@iiste.org Journal of New Media and Mass Communication NMMC@iiste.org Journal of Energy Technologies and Policy JETP@iiste.org Historical Research Letter HRL@iiste.org Public Policy and Administration Research PPAR@iiste.org International Affairs and Global Strategy IAGS@iiste.org Research on Humanities and Social Sciences RHSS@iiste.org Journal of Developing Country Studies DCS@iiste.org Journal of Arts and Design Studies ADS@iiste.org