SlideShare una empresa de Scribd logo
1 de 12
Descargar para leer sin conexión
Information and Knowledge Management                                                                        www.iiste.org
ISSN 2224-5758 (Paper) ISSN 2224-896X (Online)
Vol 2, No.5, 2012


 Innovative Logistics Management under Uncertainty using Markov
                             Model
                             Varanya Tilokavichai1 Peraphon Sophatsathit2* Achara Chandrachai3
    1.   Technopreneurship and Innovation Management Program, Chulalongkorn University, Thailand
    2.   Advanced Virtual and Intelligent Computing Center, Department of Mathematics and Computer Science,
         Faculty of Science, Chulalongkorn University, Bangkok, 10330, Thailand
    3.   Faculty of Commerce and Accountancy, Chulalongkorn University, Thailand
    * E-mail of the corresponding author: speraphon@gmail.com


The research is financed by Graduate School, Chulalongkorn University, Thailand.


Abstract
This paper proposes an innovative uncertainty management using a stochastic model to formulate logistics network
starting from order processing, purchasing, inventory management, transportation, and reverse logistics activities. As
this activity chain fits well with Markov process, we exploit the very principle to represent not only the transition
among various activities, but also the inherent uncertainty that has plagued logistics activities across the board. The
logistics network model is thus designed to support logistics management by retrieving and analyzing logistics
performance in a timely and cost effective manner. The application of information technology entails this network to
become a Markovian information model that is stochastically predictable and flexibly manageable. A case study is
presented to highlight the significance of the model.
Keywords: Logistics network; Markov process; Risk management; Uncertainty management.


1. Introduction
Logistics management concerns with how to optimize the efficiency of logistics activity in a timely and cost effective
manner. This can be accomplished through a well-designed logistics network. Traditional logistics network design
transfers products from manufacturers to customers and accepts return of disposed products from customers to
manufacturers (Lee et al., 2010). Consequently, the logistic network management can be categorized into two types
with respect to the product flow, namely, outbound and inbound logistics flows. S.A (2008) claimed that capacitated
network could be used to analyze possible long-term transportation to reduce the distribution cost, having demand as
an uncertain parameter. The distributors who serve as middlemen in the network of suppliers, warehouses, and
customers must be reliable, flexible, and cost awareness. Their role is to select suppliers that will deliver products to
destination stores or warehouses and to assign warehouse to customers (Erol and Ferrell Jr, 2004). From the
distributor’s standpoint, their net profit will increase if logistics support increases the profit margins or reduces
expenses or inventory (Magrath and Hardy, 1992). Problems arise when distributors frequently have conflicting
objectives such as minimizing cost and maximizing customer’s satisfaction. They must find a proper mix of cost
effectiveness and level of customer’s satisfaction (Erol and Ferrell Jr, 2004). The key to this right mix is management
and control of distribution costs. Many firms use enterprise resource planning (ERP) and information systems (IS) as
logistics management tools to attain better perceived competitive advantages (Tilokavichai and Sophatsathit, 2011).
The increased emphasis on supply chain management, ERP, and the need to develop models with appropriate
representation of transportation considerations must be further enhanced to achieve any measurable logistics support
(Swenseth and Godfrey, 2002). Rodriguez and Vecchietti (2010) agreed that the inventory, purchasing, delivery,
demand and price uncertainties were major contributing problems of the supply chain. They solved the problem using
non-linear programming technique. Another essential issue in logistics management is inventory management which
poses an important problem in every industry as a tradeoff between customer’s satisfaction and capital investment. The
research conducted by Swenseth and Godfrey (2002) demonstrated that economic order quantity models could be

                                                          19
Information and Knowledge Management                                                                          www.iiste.org
ISSN 2224-5758 (Paper) ISSN 2224-896X (Online)
Vol 2, No.5, 2012

incorporated into inventory replenishment decisions. As the buyer and seller marketplace can be handled through
e-commerce or third-party logistics providers in order to maximize customer’s satisfaction (Nevins and Money, 2008),
many models and methods have been developed to accommodate such an optimization problem. However, few studies
have addressed the comprehensive design of logistics networks under uncertainty.
Although some research endeavors attempt to describe uncertainty that involves in logistics activities, the analyses are
conducted on pair-wise or adjacent activities. This fails to capture cross-relationships among various activities in the
logistics network. We envision such intertwined relationships that are inherent to the logistics chain. We propose a
working stochastic model to represent the overall logistics perspective and pertinent indicators for firms to improve
logistics performance toward better business decisions. The model makes use of Markov process to link order
processing, purchasing, inventory management, transportation, and reverse logistics activities under uncertainty.
Analysis detail will be described in subsequent sections.
The organization of this paper is as follows. Section 2 recounts some related literature and important issues in the area.
Section 3 presents the Markov model, including notation used, the meaning of parameters, variables, constraints, and
others. Section 4 describes a case study to demonstrate the viability of the proposed model. Section 5 discusses some
essential findings and potential future course of action.


2. Literature Review
2.1 Logistics Network Model
Traditional business model is articulated in three stages: production, distribution, and sales. Each one of these stages is
usually managed by a different company, or by a different branch of the same company (S.A, 2008). Logistics activities
for distribution products start from order processing, inventory management, purchasing and procurement,
transportation, and reverse logistics (Lai et al., 2010; Wu and Huang, 2007; Aptel and Pourjalali, 2001; Ngai et al.,
2008). A logistics network model thus becomes very important in logistics management (Listes, 2007). Lee, et al.
(2010) developed a sustainable logistics network under uncertainty using stochastic programming to attain cost savings
and pollution reduction as a result of sharing material handling equipment and infrastructure. El-Sayed, et al. (2010)
developed forward-reverse logistics network design under risk model to maximize the total expected profit. The
problem was formulated in a stochastic mixed integer programming and decision making process. Pishvaee, et al.
(2009) applied a stochastic programming model with an integrated forward/reverse logistics network design under
uncertainty to minimize the total costs including fixed opening cost, transportation cost, and processing costs. S.A.
(2008) applied stochastic programming to design capacitated network analyzing possible long-term transportation of
oil derivatives by pipeline, truck, railway, and ship so as to reduce the distribution cost. Moreover, Wilcox, et al. (2011)
applied Markov model to handle reverse logistics operations and related financial management of the reverse
logistics/return processes. Lee, et al. (2010) applied stochastic programming in reverse logistics to minimize cost and
time. Listes (2007) developed a supply and return network using stochastic programming in demand and forecasting,
transportation, and reverse logistics. One of the reasons why the transportation issue has become the mainstay of
logistics management is because the annual transportation costs are the largest expense in logistic system where the
majority of costs incurred depend on volume of products (S.A, 2008). The aforementioned models have wide range of
applications in logistics reliability, liquidity, cost efficiency, time reduction, etc. However, previous researches
assumed that the logistics network was a continuous process, and hence the design parameters for the logistics network
mostly focused on forward logistics or reverse logistics. Table 1 summarizes some of the techniques and logistics
activities for logistics models from previous studies.
2.2 Risk Management
Logistics have become a major component of competitive strategy to enhance organizational productivity and
profitability. Unfortunately, the constituent activities in the logistics chain do not operate without chances of failure to
meet the desired objective. This window of missing the pre-established target is known as risk. Hence, risk
management in logistics activities is a very important factor of competitive advantage formula. El-Sayed, et al. (2010)
proposed a multi-period multi-echelon forward and reverse logistics network model under risk to maximize the total
expected profit. Ramanathan (2010) explored the relationships between logistics performance and customer loyalty
that affected by risk characteristics of products and efficiencies of the websites in terms of price and ambiguity of


                                                            20
Information and Knowledge Management                                                                          www.iiste.org
ISSN 2224-5758 (Paper) ISSN 2224-896X (Online)
Vol 2, No.5, 2012

products. Cope, et al. (2010) delivered actionable policy recommendations based on consumer preferences for different
approaches to food management by risk communication such as sharing knowledge of consumer risk perceptions and
information needs. Tsao (2011) developed an inventory model with non-instantaneous delivery under trade credit and
logistics risk. The model determined the optimal replenishment policy for a retailer, given uncertainties in a supply
chain which were due to unforeseeable disruption or various types of defect such as shipping damage, missing parts,
misplaced products and disasters, etc.
2.3 Stochastic process and Markov model
Stochastic programming is an optimizing technique using probabilistic information to solve large scale probabilistic
optimization problems (Yu and Li, 2000). Markov decision process is a sequential decision-making stochastic process
characterized by five elements: decision epochs, states, actions, transition probabilities, and rewards (Puterman, 1994).
Many areas of science and technology use Markov chain to resolve complex problems of the underlying factors
attributing to different types of transitions, reverse transitions, and repeated transitions (Ataharul Islam and Chowdhury,
2006; S.A, 2008). Markovian formulations are useful in solving a number of real-world problems under uncertainties,
such as determining inventory levels for retailers and scheduling maintenance for manufacturers (Zhao et al., 2010). It
provides more flexibility in statistically examining multiple transitions simultaneously and predicts the future state of a
system from its present state ignoring its past history. Therefore, Markov chain is more effective at providing
predictive information for managers and offers likelihood estimations for future outcomes (Wilcox et al., 2011). Its
probabilistic nature renders the technique ideal for solving logistics problems under uncertainties, such as determining
inventory level for retailers, scheduling maintenance for manufacturers, scheduling/planning in production
management, and resource planning for time, cost, and human (Gayon et al., 2009). In addition, as the Just-in-Time
(JIT) mode is introduced, the branches need not stock large inventories. The inventory cost can also be reduced (Zhao
et al., 2010). A transient state can be formally defined as state from which the unit can change before leaving the system.
Examples of transient states that could be considered might include purchasing, replenishment, distribution, etc. The
goals are minimum cost, minimum time, and maximum profit.
Logistics models were developed by many techniques such as stochastic programming, Markov decision process, EOQ,
etc., as summarized in Table 1. These techniques in turn were further applied to outbound, inbound, or reverse logistics
in a pair-wise fashion. The lack of holistically integrated study of these activities left logistics problems hard to reckon
with. The advent and application of information technology merely speeds up routine activities but leaves the inherent
complexity untouched. The introduction of Markov model to analyze transition probabilities in logistics activities
entails a promising means to tackle such obstacles. As transitional capability of the Markov process can represent
multi-stage flow of logistics activities under uncertainty, the resulting representative model can be used for further
study on minimizing costs, time, opportunity loss, and maximizing flexibility, where different activities can be
transited within the logistics distribution network.
2.4 Logistics activity based costing
Supply chain management requires accurate cost data regarding all activities and process within the organizations.
Activity-Based Costing (ABC) can significantly contribute accurate cost data regarding all activities in supply chain
management (Askarany et al., 2010; Gunasekaran et al., 2004). Gupta and Galloway (2003) demonstrated the
managerial implications of an Activity-Based Costing/Management (ABC/M) system for various operation
management decisions relating to product planning and design, quality management and control, inventory
management, capacity management, and work force management that support decision-making of operation managers.
Schulze, et al. (2012) applied ABC model in supply chain environment for inter-firms cost saving opportunities.
Baykasoglu and Kaplanoglu (2008) applied ABC with business process modeling and analytical hierarchy approach
for effective costing services of land transportation companies. Hung (2011) integrated approaches of ABC and
management such as five forces analysis, risk analysis, decision making, analytic network process, and fuzzy goal
programming for precise costing, managerial constraints, competitive advantage analysis, and risk management.


3. Proposed Markov model
The model is a formulation of the logistics network design that consists of outbound, inbound, and reverse logistics.
This model serves as a basis for numerous studies on logistics activity relationship to accomplish a set of designated


                                                            21
Information and Knowledge Management                                                                           www.iiste.org
ISSN 2224-5758 (Paper) ISSN 2224-896X (Online)
Vol 2, No.5, 2012

objectives. Qin, et al. (2009) designed the logistics network between stochastic demand and inventory control to
minimize cost under a predefined service level. The granularity of description detail depends on the context and focus
of logistics problems under study. The proposed model is applied to a case study of the logistics network design for a
distribution business. Preliminary analysis has established the working scenarios given in the previous section. During
the course of the research, it was discovered that though many distributors claimed to place high priority on regular
logistics activities, a few distributors had monitored related data with the same degree of intensity and depth of analysis
on sales effort. The actual site was conducted at XYZ Company which is a large ceramic tile and sanitary ware
manufacturer in Thailand. The true identity was withheld for confidentiality. XYZ has total annual income over 7.5
billion Baht, part of which about 150 million Baht was spent on transportation in 2011. Meanwhile, XYZ presently
handles approximately 80,000 items that make up 75 product types from 392 vendors. The average vendors’ lead time
is 8 days which account for the total inventory values of 890 million Baht. There are 1,200 staffs serving logistics
activities, or 75 percent of all employees. Over 150,000 customers visit the branches annually. There are 164 vehicles
or 90 percent of all of vehicles being deployed in customer delivery, which usually takes 2 days. The main obstacle that
hinders profitability is logistics management. Therefore, the ultimate goals of this case study do not limit to only
demonstrate how the proposed Markovian information model copes with the risk involved in the company’s logistics
network, but also exploitation of the model to optimize the costs incurred. We calculated logistics costs from financial
statement of XYZ such as wages, transportation, fuel, repair, communication, depreciation of vehicles and others,
insurance, utilities, interests, and administrative costs expended in percentage of sales. However, we could not reveal
all real data. As such, an overall logistics cost structure is categorized in four groups as follows: 1) interests from
logistics activities, 2) transportation, packaging, fuel, depreciation of vehicles, and other relating maintenance costs, 3)
wages, allowances, and welfares for logistics activities, and 4) other costs such as communication, miscellany,
depreciation, utilities, taxes, and other administrative costs.
The model was applied to internal logistics process, where financial data were provided by XYZ. The data reflected a
twelve-state Markov chain, with almost all transitions between states was tracked by ERP system. The model is not
intended to yield an exhaustive list of possible states or transitions, but rather an example demonstrates the utility of the
model. Its flexibility could be customized to suit individual distributor setting based on their logistics policy. The
analysis breakdown of XYZ logistics network by Markov process is shown in Figure 1. We measured the number of
transactions, cost per transaction, and time spent in each activity from ERP. Cost per transaction is calculated from
logistics cost structure. This is a unit performance measure of any logistics activity at a given stage. For example, order
processing (O1) and inventory management at branch (I1 and I2) both have cost per transaction of 144 Baht. This is
because all three activities are executed at the same ERP node (this is architectural dependent on ERP configuration).
The total logistics activity costs divided by all transactions executed at this node is therefore
24,500,000/(1,119+155,094+14,448) = 144 Baht. Similarly, a reflexive link at O1 designates a pending status of 1,119
transactions at 144 Baht that affected the annual income by 16,543,457 Baht or about 3 percent.
Figure 1 displays the probability that associates with each transition in the logistics activity network. The latter
represents a complete logistics chain based on Markov process at time t (in month), t = 1, 2, …, n. A sale transaction
starting at a branch can be filled with probability 0.91 and delivery to customer by the branch with probability 0.43. If
the branch is out of stocks with probability 0.08, a purchase order is initiated with probability 0.99 in accordance with
normal branch replenishment by the distribution center (DC). In order to minimize the expected transportation cost,
XYZ needs to establish a viable delivery decision based on available information. The result will furnish several
alternate routes, each of which is associated with uncertainty that is translated into time, cost, flexible course of action
for customer, and adaptability to JIT principle that altogether meeting the demands in the given period (t, t+j), where j
is the number of transition steps in the Markov chain.
Figure 2 shows the transition matrix Q of the logistics network depicted in Figure 1. A state describes the option of the
logistics activity at time t. The entry Sij represents the transition probability from state i to state j. A transaction
(row-wise) beginning at O1 will remain in O1 with 0.01; transit to I1 with 0.91; and to I2, with 0.08.
Consider when a customer places an order at the branch office. The order is filled and eventually delivered to the
customer by the same branch office. According to the analysis breakdown, there are seven possible routes to get from
order processing (O1) to transportation to customer (T2) as shown in Table 2. The state of a delivery to customer is
determined only by previous state. In the first route, we begin at O1 and proceed to I1 then T2 with probabilities 0.91 and
0.43, respectively. In the second route, the items are out of stock (I2) which calls for additional issuance of a purchase

                                                            22
Information and Knowledge Management                                                                           www.iiste.org
ISSN 2224-5758 (Paper) ISSN 2224-896X (Online)
Vol 2, No.5, 2012

order at purchasing and procurement (P1). Upon replenishing stock (I1), the items are sent to transportation to customer
(T2) with probabilities 0.08, 0.99, 0.26, and 0.43, respectively. In the third route, similar scenarios to the second route
are resulted. Fortunately, DC carries sufficient desired items to fill the stock at the branch office and the case is closed.
The fourth route is similar to the second, except replenishments go to DC first before being discharged to the branch
office, while the fifth route relays replenishments to cross dock and follows the same track. The only undesirable
situation occurs in the sixth route where orders are returned due to wrong shipment, quantity, or quality that must be
reprocessed to fulfill the order. Nevertheless, the risk is low (0.0050) but the penalty is extremely costly. Finally, the
seventh route exhibits a typical order request to DC, filled, and return with the desired product to the branch before
shipping it to the customer by the same branch.
To determine the probability of going from A to B in one transition, denoted by P(AB), follow the established Markov
process. Hence, the probability P that an order will be delivered to customer by branch based on all of the above
scenarios is
P = P(O1I1)P(I1T2) + P(O1I2)P(I2P1)P(P1I1)P(I1T2) + P(O1I2)P(I2Id1)P(Id1I1)P(I1T2) + P(O1I2)P(I2P1)P(P1Id1)P(Id1I1)
P(I1T2) + P(O1I2)P(I2P1)P(P1Id2)P(Id2I1)P(I1T2) + P(O1I1)P(I1T2)P(T2R1)P(R1I1)P(I1T2) + P(O1I1)P(I1Id1)P(Id1I1)P(I1T2)
Thus, P = (0.91)(0.43) + (0.08)(0.99)(0.26)(0.43) + (0.08)(0.01)(0.62)(0.43) + (0.08)(0.99)(0.41)(0.62)(0.43) +
(0.08)(0.99)(0.26)(1.0)(0.43) + (0.91)(0.43)(1.0)(0.03)(0.43) + (0.91)(0.01)(0.62)(0.43) = 0.43
This tells us that an order has a 43% chance to reach the branch for on-time delivery. If we consider all possible
two-step transitions based on the same scenarios, we obtain Q2= Q x Q as shown in Figure 3.
As the values of the Q matrix are derived from company’s internal item tracking of logistics activities over several
periods, it is possible to predict the expected number of sale order transactions, or the number of transactions in each
delivery type, by customer, by branch, by vendor, etc., for enterprise resource planning and increase customer’s
satisfaction.


4. Case studies and managerial implications
Firms in various industries are implementing logistics systems to reduce costs and increase profits. Due to the
unpredictable nature of logistics, firms must strive to achieve high service level agreement to attain customer’s
satisfaction. The proposed model will offer top executives to set the target of logistics performance indicators based on
information from Markov model such as lead time to customer, opportunity cost, transportation, and inventory costs.
Logistics manager can exercise the above policy to meet the target by predicting possible routes to preventing
subsequent problems and risks. They can monitor and identify implementable solutions bearing potential risks and
problems to arrive at viable course of action. The food and beverage sector, for instance, must have intensive control
over both incoming and outgoing logistics of raw materials and finished goods owing to their perishable nature.
Moreover, stricter regulations and consumer awareness impose higher requirements for food quality and safety (Losito
et al., 2011). As uncertainty and unpredictability of food demands are a normal problem of this sector, they must pay
close attention to distribution level problems such as lead time, abrupt and abnormal demands (Kumar and Nigmatullin,
2011). Bozkir and Sezer (2011) examined food demand prediction by applying chi-squared automatic interaction
detection, classification, and regression trees, while others resort to tools such as Just-in-Time (JIT) for cost reduction
(Zarei et al., 2011). We studied FF Company who produces fruits and fresh vegetables ready to cook and eat for export
to European countries. The company is certified with EURAPGAP, BRC, and BRC/IOP. They encountered a big
opportunity loss problem as sales plummeted from 7% down to 3 %. The main causes are the high price and shortage of
unseasonal agricultural raw materials which in turn affect freight quality and disposal cost.
The logistics activity relationship matrix of FF Company consists of order processing and inventory management
which are mutually dependent on average duration (days) of supply to customers, inventory management, purchasing/
procurement, and measured by economic order quantity and reorder point (Kumar and Nigmatullin, 2011). Typically,
perishable food transportation involves multiple variables such as distribution centers, product varieties, carriers,
vehicles, and customers. These variables attribute to another utmost important controlled variable, i.e., temperature
which often fluctuates by many factors. Besides, the delivery vehicles usually have multiple customer deliveries per
cycle (White III and Cheong, 2012; Ahumada and Villalobos, 2011).
In Table 3, there are six possible routes from order processing (O) to transportation to wholesaler (T). The state of a

                                                            23
Information and Knowledge Management                                                                          www.iiste.org
ISSN 2224-5758 (Paper) ISSN 2224-896X (Online)
Vol 2, No.5, 2012

delivery to the wholesaler is determined only by previous state. In the first route, we begin at O and proceed to
purchasing and procurement issuance of a purchase order (P). After that fruits and vegetables are cut and pack for
ready to cook and eat (M). Finally, the items are sent to transportation to wholesaler in Europe by air (T) with
probabilities P(O-P-M-T). In this route, raw material and finished goods are not buffered anywhere. As such, the
hand-off between states can be treated as a JIT delivery. In the fifth route, the concern is on raw material (I1) that must
have enough quantity and in good quality. Thus, the Markov model can support managers in making decision and
predict on customer’s demand, opportunity loss, EOQ, reorder point, disposal cost, etc.
For service industry such as hospitals, logistics activities consist of purchasing, physical supply, receiving, inventory
management, internal distribution to medical units, and management information systems. Distribution operations
usually focus on inventory scheduling decisions. The variables involved are: when to place order and deliver to each
care unit. Therefore the activities balance through the purchasing cycle (Lapierre and Ruiz, 2007). Moreover,
distribution of suppliers such as central warehouse or direct vender distribution and volume of medicine being
distributed affect logistics performance of the hospital (Aptel and Pourjalali, 2001). In this case, the speed of service is
an important variable in servicing the patients. The Markov model can be deployed to improve such a work flow to
reduce cost, increase customer’s satisfaction, and safe health care of patients.
It is apparent that Markov model can be applied in several industries such as food, electronics, fashion, and services. It
helps solve problems such as over stock, severe delays, inaccurate product forecasts, inefficient service flow, lost sales
and liquidity. The information from Markov model can be used to set target, predict opportunity cost, time, service
level, reduce inventory, eliminate bullwhip effect, and improve communication. One direct IT application is direct
manufacturer to customer sales (in the case of Compaq) which in the context of the proposed logistics network model
is just a jump from regular sale order distribution channel in the supply chain, bypassing wholesalers and retailers to
customers. The risk paid off beautifully.
5. Conclusion and future research
This paper has explored the logistics network activity management under uncertainty. In order to account for the
uncertain characteristics of the logistics network, the Markov model has been developed where the demands of
outbound logistics, inbound logistics, and returned product from customers are assumed to be stochastic parameters
with known distribution. The model addresses some recalcitrant logistics activity problems that have high holding
costs and uncertain demands. The application of Markov chain provides relevant predictions for managers and
likelihood estimations for future outcome. Since logistics management is a part of the strategic map that attributes to
the firm’s competitive advantage (Quezada, 2009), we selected a case study of a large-scale logistics network firm to
demonstrate the viability of the proposed model. The results have not only shown product distribution alternatives, but
also demonstrated an integrated systematic method that yielded cost effective logistics network performing at high
customer’s satisfaction level.
The case study shown in Figure 1 also encompasses a number of valuable information to be extracted. The opportunity
loss in order processing with probability 0.01 or 16,543,457 Baht is caused by inadequate stock to fill the order. This in
turn will affect liquidity situation because the branch does not generate sales and remains to reckon with creditors.
Although XYZ has its own DC that is equipped with automatic inventory replenishment system, but the risk of being
out of stock exists. Analysis on activity flow can determine the time spent, associated costs, and risk involved of a sale
order (O1), encountering out of stocks situation (I2), issuing a corresponding PO (P1), before proceeding to either DC
stocks (Id1) or cross dock (Id2). Therefore, top executive, middle managers, operation managers, and other parties
involved could communicate, discuss, or lay out strategic planning to be in-line with organization objectives. Moreover,
the company can cooperate with vendors and customers using the result information obtained from Markov analysis to
meet the target logistics mission, while minimizing cost, time, improving customer’s satisfaction and competitive
advantage over its competitors. It is thus apparent that the information is attributive to decision making in planning and
controlling resources, transportation, and risk management.
The enormity of cumulative uncertainties that are inherent to all stages of the logistics chain has prompted us to delve
into the overall cost structure. From the externally imposing service level and demands from customers and
competitors, various holding costs, transportation cost, JIT lot size, etc., have affected the entire downstream
operations in branches and vendors alike. We also found that the unraveled uncertainties could in fact be directly
translated into anticipatory risks that the company could mitigate or avoid. Thus, we can predict lead time reduction by

                                                            24
Information and Knowledge Management                                                                          www.iiste.org
ISSN 2224-5758 (Paper) ISSN 2224-896X (Online)
Vol 2, No.5, 2012

JIT, as well as the associated costs derived from suppliers and customers’ data. Future research will explore
organization cost analysis by applying ABC that incorporates additional variables such as number of staffs in each
logistics activity, vehicles, transportation zones, sales representatives, vendors, order distribution, and working time in
each logistics activity. A precautionary warning is that adoption of ABC in smaller firms needs more attention than
larger firms in light of risk and uncertainty involved.
The proposed model can very well suit different industries such as food, electronics, machinery, fashion, and service
sectors, as long as there are logistics activities involved. In particular, we are gathering in-depth information on food
industry as the perishable nature mandates a highly efficient logistics network to reduce time-to-market which is the
life line of their business survival. We also plan to apply the proposed technique on returned goods from stocks at
branch to DC (R2), customer to branch stocks (R1), and DC stocks to vendors (R3), thereby minimizing costs of
exchange, staging, scrap (due to damage), and out dated stock clearance. Owing to the volume of such returned goods,
efforts to reduce the probability of loss sales ignited an innovative in-house product development to churn out
artistically design of blending piece scrap to a new product line. The outlook is promising as demand steadily grows.
Our future work will incorporate dynamic prediction by a weighted coefficient of variables. Consequently, the
introduction of Markovian information model will be conducive toward effective minimizing cost and predicting
future outcome that further enhances the competitive advantage of the firm.


References
Ahumada, O. & Villalobos, J. R. (2011). Operational model for planning the harvest and distribution of perishable
agricultural products. International Journal of Production Economics. 133 (2), 677-687.
Aptel, O. and Pourjalali, H. (2001). Improving activities and decreasing costs of logistics in hospitals: A comparison of
U.S. and French hospitals. The International Journal of Accounting, 36 (1), 65-90.
Askarany, D., Yazdifar, H. and Askary, S. (2010). Supply chain management, activity-based costing and organisational
factors. International Journal of Production Economics. 127 (2), 238-248.
Ataharul Islam, M. and Chowdhury, R. I. (2006). A higher order Markov model for analyzing covariate dependence.
Applied Mathematical Modelling. 30 (6), 477-488.
Baykasoglu, A. and Kaplanoglu, V. (2008). Application of activity-based costing to a land transportation company: A
case study. International Journal of Production Economics. 116 (2), 308-324.
Bozkir, A. S. & Sezer, E. A. (2011). Predicting food demand in food courts by decision tree approaches. Procedia
Computer Science. 3, 759-763.
Cope, S., Frewer, L. J., Houghton, J., Rowe, G., Fischer, A. R. H. and De Jonge, J. (2010). Consumer perceptions of
best practice in food risk communication and management: Implications for risk analysis policy. Food Policy. 35 (4),
349-357.
El-Sayed, M., Afia, N. and El-Kharbotly, A. (2010). A stochastic model for forward-reverse logistics network design
under risk. Computers and Industrial Engineering. 58 (3), 423-431.
Erol, I. and Ferrell Jr, W. G. (2004). A methodology to support decision making across the supply chain of an industrial
distributor. International Journal of Production Economics. 89 (2), 119-129.
Gayon, J.P., Benjaafar, S. and de Vericourt, F. (2009). Using Imperfect Advance Demand Information in
Production-Inventory Systems with Multiple Customer Classes. Manufacturing and Service Operations Management.
11 (1), 128–143.
Gunasekaran, A., Patel, C. and Mcgaughey, R. E. (2004). A framework for supply chain performance measurement.
International Journal of Production Economics. 87 (3), 333-347.
Gupta, M. and Galloway, K. (2003). Activity-based costing/management and its implications for operations
management. Technovation. 23 (2), 131-138.
Horvath, P. A., Autry, C. W. and Wilcox, W. E. (2005). Liquidity implications of reverse logistics for retailers: A
Markov chain approach. Journal of Retailing. 81 (3), 191-203.


                                                           25
Information and Knowledge Management                                                                        www.iiste.org
ISSN 2224-5758 (Paper) ISSN 2224-896X (Online)
Vol 2, No.5, 2012

Houghton, J. R., Rowe, G., Frewer, L. J., Van Kleef, E., Chryssochoidis, G., Kehagia, O., Korzen-Bohr, S., Lassen, J.,
Pfenning, U. and Strada, A. (2008). The quality of food risk management in Europe: Perspectives and priorities. Food
Policy. 33 (1), 13-26.
Hung, S.-J. (2011). Activity-based divergent supply chain planning for competitive advantage in the risky global
environment: A DEMATEL-ANP fuzzy goal programming approach. Expert Systems with Applications. 38 (8),
9053-9062.
Kim, H., Lu, J.-C., Kvam, P. H. and Tsao, Y.-C. (2011). Ordering quantity decisions considering uncertainty in
supply-chain logistics operations. International Journal of Production Economics. 134 (1), 16-27.
Kumar, S. & Nigmatullin, A. (2011). A system dynamics analysis of food supply chains – Case study with
non-perishable products. Simulation Modelling Practice and Theory. 19 (10), 2151-2168.
Lai, K.-H., Wong, C. W. Y. and Cheng, T. C. E. (2010). Bundling digitized logistics activities and its performance
implications. Industrial Marketing Management. 39 (2), 273-286.
Lapierre, S. D. & Ruiz, A. B. (2007), Scheduling logistic activities to improve hospital supply systems, Computers &
amp; Operations Research, 34 (3), 624-641.
Lee, D.-H., Dong, M. and Bian, W. (2010). The design of sustainable logistics network under uncertainty. International
Journal of Production Economics. 128 (1), 159-166.
Lin, B., Cole, J.C., Shreveport, E., Shreveport, P. and Su, R.K. (2001). Supply chain costing: An activity-based
perspective. International Journal of Physical Distribution and Logistics Management. 31 (10), 702–713.
Listes, O. (2007). A generic stochastic model for supply-and-return network design. Computers and Operations
Research. 34 (2), 417-442.
Liu, C.-L. and Lyons, A. C. (2011). An analysis of third-party logistics performance and service provision.
Transportation Research Part E: Logistics and Transportation Review. 47 (4), 547-570.
Losito, P., Visciano, P., Genualdo, M. & Cardone, G. (2011). Food supplier qualification by an Italian
Large-scale-Distributor: Auditing system and non-conformances. Food Control. 22 (12), 2047-2051.
Lumsden, K., Stefansson, G. and Tilanus, B. (2003). Collaboration in Logistics. European Journal of Operational
Research. 144 (2), 235-236.
Magrath, A. J. and Hardy, K. G. (1992). Manufacturer services for distributors. Industrial Marketing Management. 21
(2), 119-124.
Mutha, A. and Pokharel, S. (2009). Strategic network design for reverse logistics and remanufacturing using new and
old product modules. Computers and Industrial Engineering. 56 (1), 334-346.
Nevins, J. L. and Money, R. B. (2008). Performance implications of distributor effectiveness, trust, and culture in
import channels of distribution. Industrial Marketing Management. 37 (1), 46-58.
Ngai, E. W. T., Lai, K.-H. and Cheng, T. C. E. (2008). Logistics information systems: The Hong Kong experience.
International Journal of Production Economics. 113 (1), 223-234.
Pirttilä, T. and Hautaniemi, P. (1995). Activity-based costing and distribution logistics management. International
Journal of Production Economics. 41 (1-3), 327-333.
Pishvaee, M. S., Jolai, F. and Razmi, J. (2009). A stochastic optimization model for integrated forward/reverse logistics
network design. Journal of Manufacturing Systems. 28 (4), 107-114.
Puterman, M.L., (1994). Markov Decision Processes: Discrete Stochastic Programming. John Wiley, New York, NY.
Qin, J., Shi, F., Miao, L.-X. and Tan, G.-J. (2009). Optimal Model and Algorithm for Multi-Commodity Logistics
Network Design Considering Stochastic Demand and Inventory Control. Systems Engineering - Theory and Practice.
29 (4), 176-183.
Quezada, L. E., Cordova, F. M., Palominos, P., Godoy, K. and Ross, J. (2009). Method for identifying strategic
objectives in strategy maps. International Journal of Production Economics. 122 (1), 492-500.
Ramanathan, R. (2010). The moderating roles of risk and efficiency on the relationship between logistics performance

                                                          26
Information and Knowledge Management                                                                         www.iiste.org
ISSN 2224-5758 (Paper) ISSN 2224-896X (Online)
Vol 2, No.5, 2012

and customer loyalty in e-commerce. Transportation Research Part E: Logistics and Transportation Review. 46 (6),
950-962.
Rodríguez, M. A. & Vecchietti, A. (2009). Integrating Purchase Contract Decisions with Inventory Management
Optimization in the Supply Chain. Computer Aided Chemical Engineering. 27, 315-320.
Rodriguez, M. A. and Vecchietti, A. (2010). Inventory and delivery optimization under seasonal demand in the supply
chain. Computers and Chemical Engineering. 34 (10), 1705-1718.
S.A, M. (2008). An operational planning model for petroleum products logistics under uncertainty. Applied
Mathematics and Computation. 196 (2), 744-751.
Schulze, M., Seuring, S. and Ewering, C. (2012). Applying activity-based costing in a supply chain environment.
International Journal of Production Economics. 135 (2), 716-725.
Swenseth, S. R. and Godfrey, M. R. (2002). Incorporating transportation costs into inventory replenishment decisions.
International Journal of Production Economics. 77 (2), 113-130.
Tilokavichai, V. and Sophatsathit, P. (2011). An Organization-Wide Analysis of ERP and Information Systems
Interrelationship for Logistics Support. Journal of System and Management Sciences. 1 (1), 59-68.
Tsao, Y. C. (2011). Replenishment policies considering trade credit and logistics risk, Scientia Iranica. 18 (3), 753-758.
Wilcox, W., Horvath, P. A., Griffis, S. E. and Autry, C. W. (2011). A Markov model of liquidity effects in reverse
logistics processes: The effects of random volume and passage. International Journal of Production Economics. 129
(1), 86-101.
Wu, F., Yeniyurt, S., Kim, D. and Cavusgil, S. T. (2006). The impact of information technology on supply chain
capabilities and firm performance: A resource-based view. Industrial Marketing Management. 35 (4), 493-504.
Wu, Y.-C.J. and Huang, I. C. (2007). Operations research practice on logistics management in Taiwan: An academic
view. European Journal of Operational Research. 182 (1), 428-435.
Yu, C.-S. and Li, H.-L. (2000). A robust optimization model for stochastic logistic problems. International Journal of
Production Economics. 64 (1-3), 385-397.
Zarei, M., Fakhrzad, M. B. & Jamali Paghaleh, M. (2011). Food supply chain leanness using a developed QFD model.
Journal of Food Engineering. 102 (1), 25-33.
Zhao, Q. H., Chen, S., Leung, S. C. H. and Lai, K. K. (2010). Integration of inventory and transportation decisions in a
logistics system. Transportation Research Part E: Logistics and Transportation Review. 46 (6), 913-925.


Table 1. Summary of techniques, activity flow, and measurement of logistics network.


Logistics Activities: D: Demand & Forecasting, I: Inventory Management, W: Warehouse Management, P: Purchasing
& Procurement, O: Order Processing, T: Transportation, R: Reverse Logistics. Measurement: C: Cost, T: Time, P:
Profit, S: Service Level, W: Waste/defect, L: Liquidity.

                                                           27
Information and Knowledge Management                                                                  www.iiste.org
ISSN 2224-5758 (Paper) ISSN 2224-896X (Online)
Vol 2, No.5, 2012


                                                                                                            Figure
                                          1. Breakdown of XYZ logistics network.
Table 2. Routes from order processing (O1) to transportation to customer (T2).
 C           Route              Prob           Lead Time (hours)            Cost per transaction (Baht)
 1    O1-I1-T2                 0.3913       42                         144+124 = 268
 2     O1-I2-P1-I1-T2              0.0089        201+42 = 243               144+22+23+124 = 313
 3     O1-I2-Id1-I1-T2             0.0002        24+42 = 66                 144+22+68+124 = 358
 4     O1-I2-P1-Id1-I1-T2          0.0087        22+177+24+42 = 265         144+22+23+68+124 = 381
 5     O1-I2-P1-Id2-I1-T2          0.0089        22+189+12+42 = 265         144+22+23+50+124 = 363
 6     O1-I1-T2- R1-I1-T2          0.0050        42+360+42 = 444            144+124+144+124 = 536
 7     O1-I1-Id1-I1-T2             0.0024        12+24+42 = 78              144+114+68+124 = 450
C: Case, Prob: Probability


                                  Figure 2. The transition matrix of the logistics network.


                                                              28
Information and Knowledge Management                                                                      www.iiste.org
ISSN 2224-5758 (Paper) ISSN 2224-896X (Online)
Vol 2, No.5, 2012


                                            Figure 3. Two-step transitions matrix.
Table 3. Routes from order processing (O) to transportation to wholesaler (T).
              Case               Routes                                  Probability
                 1              O-P-M-T                                 P(O-P-M-T)
                 2            O-P- I1-M-T                             P(O-P- I1-M-T)
                 3            O-P-M-I2-T                              P(O-P-M-I2-T)
                 4           O-P-I1-M- I2-T                         P(O-P-I1-M- I2-T)
                 5             O- I1-M-T                               P(O- I1-M-T)
                 6            O- I1-M-I2-T                            P(O- I1-M-I2-T)
O: order processing, P: purchase order, M: wholesaler, I1: raw material, I2: finished goods, T: transportation


                                                             29
This academic article was published by The International Institute for Science,
Technology and Education (IISTE). The IISTE is a pioneer in the Open Access
Publishing service based in the U.S. and Europe. The aim of the institute is
Accelerating Global Knowledge Sharing.

More information about the publisher can be found in the IISTE’s homepage:
http://www.iiste.org


The IISTE is currently hosting more than 30 peer-reviewed academic journals and
collaborating with academic institutions around the world. Prospective authors of
IISTE journals can find the submission instruction on the following page:
http://www.iiste.org/Journals/

The IISTE editorial team promises to the review and publish all the qualified
submissions in a fast manner. All the journals articles are available online to the
readers all over the world without financial, legal, or technical barriers other than
those inseparable from gaining access to the internet itself. Printed version of the
journals is also available upon request of readers and authors.

IISTE Knowledge Sharing Partners

EBSCO, Index Copernicus, Ulrich's Periodicals Directory, JournalTOCS, PKP Open
Archives Harvester, Bielefeld Academic Search Engine, Elektronische
Zeitschriftenbibliothek EZB, Open J-Gate, OCLC WorldCat, Universe Digtial
Library , NewJour, Google Scholar

Más contenido relacionado

La actualidad más candente

Applicationof markovchainsformodelingandmanagingindustrialelectronicrepairpro...
Applicationof markovchainsformodelingandmanagingindustrialelectronicrepairpro...Applicationof markovchainsformodelingandmanagingindustrialelectronicrepairpro...
Applicationof markovchainsformodelingandmanagingindustrialelectronicrepairpro...GetnetAschale1
 
An integrated inventory optimisation model for facility location allocation p...
An integrated inventory optimisation model for facility location allocation p...An integrated inventory optimisation model for facility location allocation p...
An integrated inventory optimisation model for facility location allocation p...Ramkrishna Manatkar
 
158822 article text-413072-1-10-20170718
158822 article text-413072-1-10-20170718158822 article text-413072-1-10-20170718
158822 article text-413072-1-10-20170718GetnetAschale1
 
Powerpoint presentation
Powerpoint presentationPowerpoint presentation
Powerpoint presentationHilda Kaaria
 
DEA-Based Benchmarking Models In Supply Chain Management: An Application-Orie...
DEA-Based Benchmarking Models In Supply Chain Management: An Application-Orie...DEA-Based Benchmarking Models In Supply Chain Management: An Application-Orie...
DEA-Based Benchmarking Models In Supply Chain Management: An Application-Orie...ertekg
 
An effective way to optimize key performance factors of supply chain
An effective way to optimize key performance factors of supply chainAn effective way to optimize key performance factors of supply chain
An effective way to optimize key performance factors of supply chainIAEME Publication
 
Distribution channel reengineering_a_case_study
Distribution channel reengineering_a_case_studyDistribution channel reengineering_a_case_study
Distribution channel reengineering_a_case_studymohamedhariry3
 

La actualidad más candente (10)

Applicationof markovchainsformodelingandmanagingindustrialelectronicrepairpro...
Applicationof markovchainsformodelingandmanagingindustrialelectronicrepairpro...Applicationof markovchainsformodelingandmanagingindustrialelectronicrepairpro...
Applicationof markovchainsformodelingandmanagingindustrialelectronicrepairpro...
 
An integrated inventory optimisation model for facility location allocation p...
An integrated inventory optimisation model for facility location allocation p...An integrated inventory optimisation model for facility location allocation p...
An integrated inventory optimisation model for facility location allocation p...
 
158822 article text-413072-1-10-20170718
158822 article text-413072-1-10-20170718158822 article text-413072-1-10-20170718
158822 article text-413072-1-10-20170718
 
3108 3389-1-pb
3108 3389-1-pb3108 3389-1-pb
3108 3389-1-pb
 
Powerpoint presentation
Powerpoint presentationPowerpoint presentation
Powerpoint presentation
 
593176
593176593176
593176
 
Factors Affecting Customer Satisfaction on Transjakarta Commuter System
Factors Affecting Customer Satisfaction on Transjakarta Commuter SystemFactors Affecting Customer Satisfaction on Transjakarta Commuter System
Factors Affecting Customer Satisfaction on Transjakarta Commuter System
 
DEA-Based Benchmarking Models In Supply Chain Management: An Application-Orie...
DEA-Based Benchmarking Models In Supply Chain Management: An Application-Orie...DEA-Based Benchmarking Models In Supply Chain Management: An Application-Orie...
DEA-Based Benchmarking Models In Supply Chain Management: An Application-Orie...
 
An effective way to optimize key performance factors of supply chain
An effective way to optimize key performance factors of supply chainAn effective way to optimize key performance factors of supply chain
An effective way to optimize key performance factors of supply chain
 
Distribution channel reengineering_a_case_study
Distribution channel reengineering_a_case_studyDistribution channel reengineering_a_case_study
Distribution channel reengineering_a_case_study
 

Destacado

Logistics and Supply Chain Management-Overview
Logistics and Supply Chain Management-OverviewLogistics and Supply Chain Management-Overview
Logistics and Supply Chain Management-OverviewThomas Tanel
 
Logistics and Supply Chain
Logistics and Supply ChainLogistics and Supply Chain
Logistics and Supply ChainVikram Dahiya
 

Destacado (6)

Manu iv semester
Manu iv semesterManu iv semester
Manu iv semester
 
Lmscm
LmscmLmscm
Lmscm
 
Logistic management
Logistic managementLogistic management
Logistic management
 
Logistics and Supply Chain Management-Overview
Logistics and Supply Chain Management-OverviewLogistics and Supply Chain Management-Overview
Logistics and Supply Chain Management-Overview
 
Logistics Management
Logistics ManagementLogistics Management
Logistics Management
 
Logistics and Supply Chain
Logistics and Supply ChainLogistics and Supply Chain
Logistics and Supply Chain
 

Similar a Innovative logistics management under uncertainty using markov model

Analysis of linkages between logistics information systems and
Analysis of linkages between logistics information systems andAnalysis of linkages between logistics information systems and
Analysis of linkages between logistics information systems andAlexander Decker
 
Intensification of the supply chain by the storing of trajectories data
Intensification of the supply chain by the storing of trajectories dataIntensification of the supply chain by the storing of trajectories data
Intensification of the supply chain by the storing of trajectories dataijmvsc
 
HITS: A History-Based Intelligent Transportation System
HITS: A History-Based Intelligent Transportation System HITS: A History-Based Intelligent Transportation System
HITS: A History-Based Intelligent Transportation System IJDKP
 
Transportation and logistics
Transportation and logistics Transportation and logistics
Transportation and logistics guest06c40002
 
A transportation scheduling management system using decision tree and iterate...
A transportation scheduling management system using decision tree and iterate...A transportation scheduling management system using decision tree and iterate...
A transportation scheduling management system using decision tree and iterate...IJECEIAES
 
Rich routing problems arising in supply chain management (2012)
Rich routing problems arising in supply chain management (2012)Rich routing problems arising in supply chain management (2012)
Rich routing problems arising in supply chain management (2012)siska_suryanto
 
DISTRIBUTED SYSTEM APPROACH TO EXPERIMENT REGIONAL COMPETITIVENESS
DISTRIBUTED SYSTEM APPROACH TO EXPERIMENT REGIONAL COMPETITIVENESSDISTRIBUTED SYSTEM APPROACH TO EXPERIMENT REGIONAL COMPETITIVENESS
DISTRIBUTED SYSTEM APPROACH TO EXPERIMENT REGIONAL COMPETITIVENESScscpconf
 
AN ONTOLOGY-BASED DATA WAREHOUSE FOR THE GRAIN TRADE DOMAIN
AN ONTOLOGY-BASED DATA WAREHOUSE FOR THE GRAIN TRADE DOMAINAN ONTOLOGY-BASED DATA WAREHOUSE FOR THE GRAIN TRADE DOMAIN
AN ONTOLOGY-BASED DATA WAREHOUSE FOR THE GRAIN TRADE DOMAINcscpconf
 
4PL Digital Business Models In Sea Freight Logistics The Case Of FreightHub
4PL Digital Business Models In Sea Freight Logistics  The Case Of FreightHub4PL Digital Business Models In Sea Freight Logistics  The Case Of FreightHub
4PL Digital Business Models In Sea Freight Logistics The Case Of FreightHubDawn Cook
 
A STUDY ON THE 3PL SERVICES AND THEIR PERFORMANCE
A STUDY ON THE 3PL SERVICES AND THEIR PERFORMANCEA STUDY ON THE 3PL SERVICES AND THEIR PERFORMANCE
A STUDY ON THE 3PL SERVICES AND THEIR PERFORMANCEAudrey Britton
 
Assignment on logistic and Supply chain Management
Assignment on logistic and Supply chain Management Assignment on logistic and Supply chain Management
Assignment on logistic and Supply chain Management Anup Roy
 
Running head TRANSPORTATION LOGISTICS MANAGEMENT 1T.docx
Running head TRANSPORTATION LOGISTICS MANAGEMENT          1T.docxRunning head TRANSPORTATION LOGISTICS MANAGEMENT          1T.docx
Running head TRANSPORTATION LOGISTICS MANAGEMENT 1T.docxtodd521
 
A combined fuzzy AHP with fuzzy TOPSIS to locate industrial supporting bonded...
A combined fuzzy AHP with fuzzy TOPSIS to locate industrial supporting bonded...A combined fuzzy AHP with fuzzy TOPSIS to locate industrial supporting bonded...
A combined fuzzy AHP with fuzzy TOPSIS to locate industrial supporting bonded...TELKOMNIKA JOURNAL
 
OPERATIONAL ANALYSIS OF A LOGISTIC PROCESS IN THE PETROLEUM EXPLORATION AND P...
OPERATIONAL ANALYSIS OF A LOGISTIC PROCESS IN THE PETROLEUM EXPLORATION AND P...OPERATIONAL ANALYSIS OF A LOGISTIC PROCESS IN THE PETROLEUM EXPLORATION AND P...
OPERATIONAL ANALYSIS OF A LOGISTIC PROCESS IN THE PETROLEUM EXPLORATION AND P...Fredjoger Mendes
 
A multi stage supply chain network optimization using genetic algorithms
A multi stage supply chain network optimization using genetic algorithmsA multi stage supply chain network optimization using genetic algorithms
A multi stage supply chain network optimization using genetic algorithmsAlexander Decker
 
Impacts of internet of things on supply chains
Impacts of internet of things on supply chainsImpacts of internet of things on supply chains
Impacts of internet of things on supply chainsRezgar Mohammad
 
applsci-12-05152-v2.pdf
applsci-12-05152-v2.pdfapplsci-12-05152-v2.pdf
applsci-12-05152-v2.pdfaryan778928
 

Similar a Innovative logistics management under uncertainty using markov model (20)

Analysis of linkages between logistics information systems and
Analysis of linkages between logistics information systems andAnalysis of linkages between logistics information systems and
Analysis of linkages between logistics information systems and
 
Intensification of the supply chain by the storing of trajectories data
Intensification of the supply chain by the storing of trajectories dataIntensification of the supply chain by the storing of trajectories data
Intensification of the supply chain by the storing of trajectories data
 
HITS: A History-Based Intelligent Transportation System
HITS: A History-Based Intelligent Transportation System HITS: A History-Based Intelligent Transportation System
HITS: A History-Based Intelligent Transportation System
 
Transportation and logistics
Transportation and logistics Transportation and logistics
Transportation and logistics
 
A transportation scheduling management system using decision tree and iterate...
A transportation scheduling management system using decision tree and iterate...A transportation scheduling management system using decision tree and iterate...
A transportation scheduling management system using decision tree and iterate...
 
Rich routing problems arising in supply chain management (2012)
Rich routing problems arising in supply chain management (2012)Rich routing problems arising in supply chain management (2012)
Rich routing problems arising in supply chain management (2012)
 
DISTRIBUTED SYSTEM APPROACH TO EXPERIMENT REGIONAL COMPETITIVENESS
DISTRIBUTED SYSTEM APPROACH TO EXPERIMENT REGIONAL COMPETITIVENESSDISTRIBUTED SYSTEM APPROACH TO EXPERIMENT REGIONAL COMPETITIVENESS
DISTRIBUTED SYSTEM APPROACH TO EXPERIMENT REGIONAL COMPETITIVENESS
 
AN ONTOLOGY-BASED DATA WAREHOUSE FOR THE GRAIN TRADE DOMAIN
AN ONTOLOGY-BASED DATA WAREHOUSE FOR THE GRAIN TRADE DOMAINAN ONTOLOGY-BASED DATA WAREHOUSE FOR THE GRAIN TRADE DOMAIN
AN ONTOLOGY-BASED DATA WAREHOUSE FOR THE GRAIN TRADE DOMAIN
 
4PL Digital Business Models In Sea Freight Logistics The Case Of FreightHub
4PL Digital Business Models In Sea Freight Logistics  The Case Of FreightHub4PL Digital Business Models In Sea Freight Logistics  The Case Of FreightHub
4PL Digital Business Models In Sea Freight Logistics The Case Of FreightHub
 
A STUDY ON THE 3PL SERVICES AND THEIR PERFORMANCE
A STUDY ON THE 3PL SERVICES AND THEIR PERFORMANCEA STUDY ON THE 3PL SERVICES AND THEIR PERFORMANCE
A STUDY ON THE 3PL SERVICES AND THEIR PERFORMANCE
 
Assignment on logistic and Supply chain Management
Assignment on logistic and Supply chain Management Assignment on logistic and Supply chain Management
Assignment on logistic and Supply chain Management
 
Running head TRANSPORTATION LOGISTICS MANAGEMENT 1T.docx
Running head TRANSPORTATION LOGISTICS MANAGEMENT          1T.docxRunning head TRANSPORTATION LOGISTICS MANAGEMENT          1T.docx
Running head TRANSPORTATION LOGISTICS MANAGEMENT 1T.docx
 
A combined fuzzy AHP with fuzzy TOPSIS to locate industrial supporting bonded...
A combined fuzzy AHP with fuzzy TOPSIS to locate industrial supporting bonded...A combined fuzzy AHP with fuzzy TOPSIS to locate industrial supporting bonded...
A combined fuzzy AHP with fuzzy TOPSIS to locate industrial supporting bonded...
 
OPERATIONAL ANALYSIS OF A LOGISTIC PROCESS IN THE PETROLEUM EXPLORATION AND P...
OPERATIONAL ANALYSIS OF A LOGISTIC PROCESS IN THE PETROLEUM EXPLORATION AND P...OPERATIONAL ANALYSIS OF A LOGISTIC PROCESS IN THE PETROLEUM EXPLORATION AND P...
OPERATIONAL ANALYSIS OF A LOGISTIC PROCESS IN THE PETROLEUM EXPLORATION AND P...
 
Intro of logistics
Intro of logisticsIntro of logistics
Intro of logistics
 
A multi stage supply chain network optimization using genetic algorithms
A multi stage supply chain network optimization using genetic algorithmsA multi stage supply chain network optimization using genetic algorithms
A multi stage supply chain network optimization using genetic algorithms
 
Impacts of internet of things on supply chains
Impacts of internet of things on supply chainsImpacts of internet of things on supply chains
Impacts of internet of things on supply chains
 
applsci-12-05152-v2.pdf
applsci-12-05152-v2.pdfapplsci-12-05152-v2.pdf
applsci-12-05152-v2.pdf
 
Supply Chain Management
Supply Chain ManagementSupply Chain Management
Supply Chain Management
 
Published paper
Published paperPublished paper
Published paper
 

Más de Alexander Decker

Abnormalities of hormones and inflammatory cytokines in women affected with p...
Abnormalities of hormones and inflammatory cytokines in women affected with p...Abnormalities of hormones and inflammatory cytokines in women affected with p...
Abnormalities of hormones and inflammatory cytokines in women affected with p...Alexander Decker
 
A validation of the adverse childhood experiences scale in
A validation of the adverse childhood experiences scale inA validation of the adverse childhood experiences scale in
A validation of the adverse childhood experiences scale inAlexander Decker
 
A usability evaluation framework for b2 c e commerce websites
A usability evaluation framework for b2 c e commerce websitesA usability evaluation framework for b2 c e commerce websites
A usability evaluation framework for b2 c e commerce websitesAlexander Decker
 
A universal model for managing the marketing executives in nigerian banks
A universal model for managing the marketing executives in nigerian banksA universal model for managing the marketing executives in nigerian banks
A universal model for managing the marketing executives in nigerian banksAlexander Decker
 
A unique common fixed point theorems in generalized d
A unique common fixed point theorems in generalized dA unique common fixed point theorems in generalized d
A unique common fixed point theorems in generalized dAlexander Decker
 
A trends of salmonella and antibiotic resistance
A trends of salmonella and antibiotic resistanceA trends of salmonella and antibiotic resistance
A trends of salmonella and antibiotic resistanceAlexander Decker
 
A transformational generative approach towards understanding al-istifham
A transformational  generative approach towards understanding al-istifhamA transformational  generative approach towards understanding al-istifham
A transformational generative approach towards understanding al-istifhamAlexander Decker
 
A time series analysis of the determinants of savings in namibia
A time series analysis of the determinants of savings in namibiaA time series analysis of the determinants of savings in namibia
A time series analysis of the determinants of savings in namibiaAlexander Decker
 
A therapy for physical and mental fitness of school children
A therapy for physical and mental fitness of school childrenA therapy for physical and mental fitness of school children
A therapy for physical and mental fitness of school childrenAlexander Decker
 
A theory of efficiency for managing the marketing executives in nigerian banks
A theory of efficiency for managing the marketing executives in nigerian banksA theory of efficiency for managing the marketing executives in nigerian banks
A theory of efficiency for managing the marketing executives in nigerian banksAlexander Decker
 
A systematic evaluation of link budget for
A systematic evaluation of link budget forA systematic evaluation of link budget for
A systematic evaluation of link budget forAlexander Decker
 
A synthetic review of contraceptive supplies in punjab
A synthetic review of contraceptive supplies in punjabA synthetic review of contraceptive supplies in punjab
A synthetic review of contraceptive supplies in punjabAlexander Decker
 
A synthesis of taylor’s and fayol’s management approaches for managing market...
A synthesis of taylor’s and fayol’s management approaches for managing market...A synthesis of taylor’s and fayol’s management approaches for managing market...
A synthesis of taylor’s and fayol’s management approaches for managing market...Alexander Decker
 
A survey paper on sequence pattern mining with incremental
A survey paper on sequence pattern mining with incrementalA survey paper on sequence pattern mining with incremental
A survey paper on sequence pattern mining with incrementalAlexander Decker
 
A survey on live virtual machine migrations and its techniques
A survey on live virtual machine migrations and its techniquesA survey on live virtual machine migrations and its techniques
A survey on live virtual machine migrations and its techniquesAlexander Decker
 
A survey on data mining and analysis in hadoop and mongo db
A survey on data mining and analysis in hadoop and mongo dbA survey on data mining and analysis in hadoop and mongo db
A survey on data mining and analysis in hadoop and mongo dbAlexander Decker
 
A survey on challenges to the media cloud
A survey on challenges to the media cloudA survey on challenges to the media cloud
A survey on challenges to the media cloudAlexander Decker
 
A survey of provenance leveraged
A survey of provenance leveragedA survey of provenance leveraged
A survey of provenance leveragedAlexander Decker
 
A survey of private equity investments in kenya
A survey of private equity investments in kenyaA survey of private equity investments in kenya
A survey of private equity investments in kenyaAlexander Decker
 
A study to measures the financial health of
A study to measures the financial health ofA study to measures the financial health of
A study to measures the financial health ofAlexander Decker
 

Más de Alexander Decker (20)

Abnormalities of hormones and inflammatory cytokines in women affected with p...
Abnormalities of hormones and inflammatory cytokines in women affected with p...Abnormalities of hormones and inflammatory cytokines in women affected with p...
Abnormalities of hormones and inflammatory cytokines in women affected with p...
 
A validation of the adverse childhood experiences scale in
A validation of the adverse childhood experiences scale inA validation of the adverse childhood experiences scale in
A validation of the adverse childhood experiences scale in
 
A usability evaluation framework for b2 c e commerce websites
A usability evaluation framework for b2 c e commerce websitesA usability evaluation framework for b2 c e commerce websites
A usability evaluation framework for b2 c e commerce websites
 
A universal model for managing the marketing executives in nigerian banks
A universal model for managing the marketing executives in nigerian banksA universal model for managing the marketing executives in nigerian banks
A universal model for managing the marketing executives in nigerian banks
 
A unique common fixed point theorems in generalized d
A unique common fixed point theorems in generalized dA unique common fixed point theorems in generalized d
A unique common fixed point theorems in generalized d
 
A trends of salmonella and antibiotic resistance
A trends of salmonella and antibiotic resistanceA trends of salmonella and antibiotic resistance
A trends of salmonella and antibiotic resistance
 
A transformational generative approach towards understanding al-istifham
A transformational  generative approach towards understanding al-istifhamA transformational  generative approach towards understanding al-istifham
A transformational generative approach towards understanding al-istifham
 
A time series analysis of the determinants of savings in namibia
A time series analysis of the determinants of savings in namibiaA time series analysis of the determinants of savings in namibia
A time series analysis of the determinants of savings in namibia
 
A therapy for physical and mental fitness of school children
A therapy for physical and mental fitness of school childrenA therapy for physical and mental fitness of school children
A therapy for physical and mental fitness of school children
 
A theory of efficiency for managing the marketing executives in nigerian banks
A theory of efficiency for managing the marketing executives in nigerian banksA theory of efficiency for managing the marketing executives in nigerian banks
A theory of efficiency for managing the marketing executives in nigerian banks
 
A systematic evaluation of link budget for
A systematic evaluation of link budget forA systematic evaluation of link budget for
A systematic evaluation of link budget for
 
A synthetic review of contraceptive supplies in punjab
A synthetic review of contraceptive supplies in punjabA synthetic review of contraceptive supplies in punjab
A synthetic review of contraceptive supplies in punjab
 
A synthesis of taylor’s and fayol’s management approaches for managing market...
A synthesis of taylor’s and fayol’s management approaches for managing market...A synthesis of taylor’s and fayol’s management approaches for managing market...
A synthesis of taylor’s and fayol’s management approaches for managing market...
 
A survey paper on sequence pattern mining with incremental
A survey paper on sequence pattern mining with incrementalA survey paper on sequence pattern mining with incremental
A survey paper on sequence pattern mining with incremental
 
A survey on live virtual machine migrations and its techniques
A survey on live virtual machine migrations and its techniquesA survey on live virtual machine migrations and its techniques
A survey on live virtual machine migrations and its techniques
 
A survey on data mining and analysis in hadoop and mongo db
A survey on data mining and analysis in hadoop and mongo dbA survey on data mining and analysis in hadoop and mongo db
A survey on data mining and analysis in hadoop and mongo db
 
A survey on challenges to the media cloud
A survey on challenges to the media cloudA survey on challenges to the media cloud
A survey on challenges to the media cloud
 
A survey of provenance leveraged
A survey of provenance leveragedA survey of provenance leveraged
A survey of provenance leveraged
 
A survey of private equity investments in kenya
A survey of private equity investments in kenyaA survey of private equity investments in kenya
A survey of private equity investments in kenya
 
A study to measures the financial health of
A study to measures the financial health ofA study to measures the financial health of
A study to measures the financial health of
 

Último

Chandigarh Escorts Service 📞8868886958📞 Just📲 Call Nihal Chandigarh Call Girl...
Chandigarh Escorts Service 📞8868886958📞 Just📲 Call Nihal Chandigarh Call Girl...Chandigarh Escorts Service 📞8868886958📞 Just📲 Call Nihal Chandigarh Call Girl...
Chandigarh Escorts Service 📞8868886958📞 Just📲 Call Nihal Chandigarh Call Girl...Sheetaleventcompany
 
Uneak White's Personal Brand Exploration Presentation
Uneak White's Personal Brand Exploration PresentationUneak White's Personal Brand Exploration Presentation
Uneak White's Personal Brand Exploration Presentationuneakwhite
 
Organizational Transformation Lead with Culture
Organizational Transformation Lead with CultureOrganizational Transformation Lead with Culture
Organizational Transformation Lead with CultureSeta Wicaksana
 
Falcon Invoice Discounting: Unlock Your Business Potential
Falcon Invoice Discounting: Unlock Your Business PotentialFalcon Invoice Discounting: Unlock Your Business Potential
Falcon Invoice Discounting: Unlock Your Business PotentialFalcon investment
 
BAGALUR CALL GIRL IN 98274*61493 ❤CALL GIRLS IN ESCORT SERVICE❤CALL GIRL
BAGALUR CALL GIRL IN 98274*61493 ❤CALL GIRLS IN ESCORT SERVICE❤CALL GIRLBAGALUR CALL GIRL IN 98274*61493 ❤CALL GIRLS IN ESCORT SERVICE❤CALL GIRL
BAGALUR CALL GIRL IN 98274*61493 ❤CALL GIRLS IN ESCORT SERVICE❤CALL GIRLkapoorjyoti4444
 
Lundin Gold - Q1 2024 Conference Call Presentation (Revised)
Lundin Gold - Q1 2024 Conference Call Presentation (Revised)Lundin Gold - Q1 2024 Conference Call Presentation (Revised)
Lundin Gold - Q1 2024 Conference Call Presentation (Revised)Adnet Communications
 
Call Girls In Noida 959961⊹3876 Independent Escort Service Noida
Call Girls In Noida 959961⊹3876 Independent Escort Service NoidaCall Girls In Noida 959961⊹3876 Independent Escort Service Noida
Call Girls In Noida 959961⊹3876 Independent Escort Service Noidadlhescort
 
Call Now ☎️🔝 9332606886🔝 Call Girls ❤ Service In Bhilwara Female Escorts Serv...
Call Now ☎️🔝 9332606886🔝 Call Girls ❤ Service In Bhilwara Female Escorts Serv...Call Now ☎️🔝 9332606886🔝 Call Girls ❤ Service In Bhilwara Female Escorts Serv...
Call Now ☎️🔝 9332606886🔝 Call Girls ❤ Service In Bhilwara Female Escorts Serv...Anamikakaur10
 
SEO Case Study: How I Increased SEO Traffic & Ranking by 50-60% in 6 Months
SEO Case Study: How I Increased SEO Traffic & Ranking by 50-60%  in 6 MonthsSEO Case Study: How I Increased SEO Traffic & Ranking by 50-60%  in 6 Months
SEO Case Study: How I Increased SEO Traffic & Ranking by 50-60% in 6 MonthsIndeedSEO
 
Eluru Call Girls Service ☎ ️93326-06886 ❤️‍🔥 Enjoy 24/7 Escort Service
Eluru Call Girls Service ☎ ️93326-06886 ❤️‍🔥 Enjoy 24/7 Escort ServiceEluru Call Girls Service ☎ ️93326-06886 ❤️‍🔥 Enjoy 24/7 Escort Service
Eluru Call Girls Service ☎ ️93326-06886 ❤️‍🔥 Enjoy 24/7 Escort ServiceDamini Dixit
 
Call Girls Electronic City Just Call 👗 7737669865 👗 Top Class Call Girl Servi...
Call Girls Electronic City Just Call 👗 7737669865 👗 Top Class Call Girl Servi...Call Girls Electronic City Just Call 👗 7737669865 👗 Top Class Call Girl Servi...
Call Girls Electronic City Just Call 👗 7737669865 👗 Top Class Call Girl Servi...amitlee9823
 
Russian Call Girls In Gurgaon ❤️8448577510 ⊹Best Escorts Service In 24/7 Delh...
Russian Call Girls In Gurgaon ❤️8448577510 ⊹Best Escorts Service In 24/7 Delh...Russian Call Girls In Gurgaon ❤️8448577510 ⊹Best Escorts Service In 24/7 Delh...
Russian Call Girls In Gurgaon ❤️8448577510 ⊹Best Escorts Service In 24/7 Delh...lizamodels9
 
Call Girls Ludhiana Just Call 98765-12871 Top Class Call Girl Service Available
Call Girls Ludhiana Just Call 98765-12871 Top Class Call Girl Service AvailableCall Girls Ludhiana Just Call 98765-12871 Top Class Call Girl Service Available
Call Girls Ludhiana Just Call 98765-12871 Top Class Call Girl Service AvailableSeo
 
Falcon Invoice Discounting: The best investment platform in india for investors
Falcon Invoice Discounting: The best investment platform in india for investorsFalcon Invoice Discounting: The best investment platform in india for investors
Falcon Invoice Discounting: The best investment platform in india for investorsFalcon Invoice Discounting
 
PHX May 2024 Corporate Presentation Final
PHX May 2024 Corporate Presentation FinalPHX May 2024 Corporate Presentation Final
PHX May 2024 Corporate Presentation FinalPanhandleOilandGas
 
The Abortion pills for sale in Qatar@Doha [+27737758557] []Deira Dubai Kuwait
The Abortion pills for sale in Qatar@Doha [+27737758557] []Deira Dubai KuwaitThe Abortion pills for sale in Qatar@Doha [+27737758557] []Deira Dubai Kuwait
The Abortion pills for sale in Qatar@Doha [+27737758557] []Deira Dubai Kuwaitdaisycvs
 
The Path to Product Excellence: Avoiding Common Pitfalls and Enhancing Commun...
The Path to Product Excellence: Avoiding Common Pitfalls and Enhancing Commun...The Path to Product Excellence: Avoiding Common Pitfalls and Enhancing Commun...
The Path to Product Excellence: Avoiding Common Pitfalls and Enhancing Commun...Aggregage
 
Famous Olympic Siblings from the 21st Century
Famous Olympic Siblings from the 21st CenturyFamous Olympic Siblings from the 21st Century
Famous Olympic Siblings from the 21st Centuryrwgiffor
 
Marel Q1 2024 Investor Presentation from May 8, 2024
Marel Q1 2024 Investor Presentation from May 8, 2024Marel Q1 2024 Investor Presentation from May 8, 2024
Marel Q1 2024 Investor Presentation from May 8, 2024Marel
 
Malegaon Call Girls Service ☎ ️82500–77686 ☎️ Enjoy 24/7 Escort Service
Malegaon Call Girls Service ☎ ️82500–77686 ☎️ Enjoy 24/7 Escort ServiceMalegaon Call Girls Service ☎ ️82500–77686 ☎️ Enjoy 24/7 Escort Service
Malegaon Call Girls Service ☎ ️82500–77686 ☎️ Enjoy 24/7 Escort ServiceDamini Dixit
 

Último (20)

Chandigarh Escorts Service 📞8868886958📞 Just📲 Call Nihal Chandigarh Call Girl...
Chandigarh Escorts Service 📞8868886958📞 Just📲 Call Nihal Chandigarh Call Girl...Chandigarh Escorts Service 📞8868886958📞 Just📲 Call Nihal Chandigarh Call Girl...
Chandigarh Escorts Service 📞8868886958📞 Just📲 Call Nihal Chandigarh Call Girl...
 
Uneak White's Personal Brand Exploration Presentation
Uneak White's Personal Brand Exploration PresentationUneak White's Personal Brand Exploration Presentation
Uneak White's Personal Brand Exploration Presentation
 
Organizational Transformation Lead with Culture
Organizational Transformation Lead with CultureOrganizational Transformation Lead with Culture
Organizational Transformation Lead with Culture
 
Falcon Invoice Discounting: Unlock Your Business Potential
Falcon Invoice Discounting: Unlock Your Business PotentialFalcon Invoice Discounting: Unlock Your Business Potential
Falcon Invoice Discounting: Unlock Your Business Potential
 
BAGALUR CALL GIRL IN 98274*61493 ❤CALL GIRLS IN ESCORT SERVICE❤CALL GIRL
BAGALUR CALL GIRL IN 98274*61493 ❤CALL GIRLS IN ESCORT SERVICE❤CALL GIRLBAGALUR CALL GIRL IN 98274*61493 ❤CALL GIRLS IN ESCORT SERVICE❤CALL GIRL
BAGALUR CALL GIRL IN 98274*61493 ❤CALL GIRLS IN ESCORT SERVICE❤CALL GIRL
 
Lundin Gold - Q1 2024 Conference Call Presentation (Revised)
Lundin Gold - Q1 2024 Conference Call Presentation (Revised)Lundin Gold - Q1 2024 Conference Call Presentation (Revised)
Lundin Gold - Q1 2024 Conference Call Presentation (Revised)
 
Call Girls In Noida 959961⊹3876 Independent Escort Service Noida
Call Girls In Noida 959961⊹3876 Independent Escort Service NoidaCall Girls In Noida 959961⊹3876 Independent Escort Service Noida
Call Girls In Noida 959961⊹3876 Independent Escort Service Noida
 
Call Now ☎️🔝 9332606886🔝 Call Girls ❤ Service In Bhilwara Female Escorts Serv...
Call Now ☎️🔝 9332606886🔝 Call Girls ❤ Service In Bhilwara Female Escorts Serv...Call Now ☎️🔝 9332606886🔝 Call Girls ❤ Service In Bhilwara Female Escorts Serv...
Call Now ☎️🔝 9332606886🔝 Call Girls ❤ Service In Bhilwara Female Escorts Serv...
 
SEO Case Study: How I Increased SEO Traffic & Ranking by 50-60% in 6 Months
SEO Case Study: How I Increased SEO Traffic & Ranking by 50-60%  in 6 MonthsSEO Case Study: How I Increased SEO Traffic & Ranking by 50-60%  in 6 Months
SEO Case Study: How I Increased SEO Traffic & Ranking by 50-60% in 6 Months
 
Eluru Call Girls Service ☎ ️93326-06886 ❤️‍🔥 Enjoy 24/7 Escort Service
Eluru Call Girls Service ☎ ️93326-06886 ❤️‍🔥 Enjoy 24/7 Escort ServiceEluru Call Girls Service ☎ ️93326-06886 ❤️‍🔥 Enjoy 24/7 Escort Service
Eluru Call Girls Service ☎ ️93326-06886 ❤️‍🔥 Enjoy 24/7 Escort Service
 
Call Girls Electronic City Just Call 👗 7737669865 👗 Top Class Call Girl Servi...
Call Girls Electronic City Just Call 👗 7737669865 👗 Top Class Call Girl Servi...Call Girls Electronic City Just Call 👗 7737669865 👗 Top Class Call Girl Servi...
Call Girls Electronic City Just Call 👗 7737669865 👗 Top Class Call Girl Servi...
 
Russian Call Girls In Gurgaon ❤️8448577510 ⊹Best Escorts Service In 24/7 Delh...
Russian Call Girls In Gurgaon ❤️8448577510 ⊹Best Escorts Service In 24/7 Delh...Russian Call Girls In Gurgaon ❤️8448577510 ⊹Best Escorts Service In 24/7 Delh...
Russian Call Girls In Gurgaon ❤️8448577510 ⊹Best Escorts Service In 24/7 Delh...
 
Call Girls Ludhiana Just Call 98765-12871 Top Class Call Girl Service Available
Call Girls Ludhiana Just Call 98765-12871 Top Class Call Girl Service AvailableCall Girls Ludhiana Just Call 98765-12871 Top Class Call Girl Service Available
Call Girls Ludhiana Just Call 98765-12871 Top Class Call Girl Service Available
 
Falcon Invoice Discounting: The best investment platform in india for investors
Falcon Invoice Discounting: The best investment platform in india for investorsFalcon Invoice Discounting: The best investment platform in india for investors
Falcon Invoice Discounting: The best investment platform in india for investors
 
PHX May 2024 Corporate Presentation Final
PHX May 2024 Corporate Presentation FinalPHX May 2024 Corporate Presentation Final
PHX May 2024 Corporate Presentation Final
 
The Abortion pills for sale in Qatar@Doha [+27737758557] []Deira Dubai Kuwait
The Abortion pills for sale in Qatar@Doha [+27737758557] []Deira Dubai KuwaitThe Abortion pills for sale in Qatar@Doha [+27737758557] []Deira Dubai Kuwait
The Abortion pills for sale in Qatar@Doha [+27737758557] []Deira Dubai Kuwait
 
The Path to Product Excellence: Avoiding Common Pitfalls and Enhancing Commun...
The Path to Product Excellence: Avoiding Common Pitfalls and Enhancing Commun...The Path to Product Excellence: Avoiding Common Pitfalls and Enhancing Commun...
The Path to Product Excellence: Avoiding Common Pitfalls and Enhancing Commun...
 
Famous Olympic Siblings from the 21st Century
Famous Olympic Siblings from the 21st CenturyFamous Olympic Siblings from the 21st Century
Famous Olympic Siblings from the 21st Century
 
Marel Q1 2024 Investor Presentation from May 8, 2024
Marel Q1 2024 Investor Presentation from May 8, 2024Marel Q1 2024 Investor Presentation from May 8, 2024
Marel Q1 2024 Investor Presentation from May 8, 2024
 
Malegaon Call Girls Service ☎ ️82500–77686 ☎️ Enjoy 24/7 Escort Service
Malegaon Call Girls Service ☎ ️82500–77686 ☎️ Enjoy 24/7 Escort ServiceMalegaon Call Girls Service ☎ ️82500–77686 ☎️ Enjoy 24/7 Escort Service
Malegaon Call Girls Service ☎ ️82500–77686 ☎️ Enjoy 24/7 Escort Service
 

Innovative logistics management under uncertainty using markov model

  • 1. Information and Knowledge Management www.iiste.org ISSN 2224-5758 (Paper) ISSN 2224-896X (Online) Vol 2, No.5, 2012 Innovative Logistics Management under Uncertainty using Markov Model Varanya Tilokavichai1 Peraphon Sophatsathit2* Achara Chandrachai3 1. Technopreneurship and Innovation Management Program, Chulalongkorn University, Thailand 2. Advanced Virtual and Intelligent Computing Center, Department of Mathematics and Computer Science, Faculty of Science, Chulalongkorn University, Bangkok, 10330, Thailand 3. Faculty of Commerce and Accountancy, Chulalongkorn University, Thailand * E-mail of the corresponding author: speraphon@gmail.com The research is financed by Graduate School, Chulalongkorn University, Thailand. Abstract This paper proposes an innovative uncertainty management using a stochastic model to formulate logistics network starting from order processing, purchasing, inventory management, transportation, and reverse logistics activities. As this activity chain fits well with Markov process, we exploit the very principle to represent not only the transition among various activities, but also the inherent uncertainty that has plagued logistics activities across the board. The logistics network model is thus designed to support logistics management by retrieving and analyzing logistics performance in a timely and cost effective manner. The application of information technology entails this network to become a Markovian information model that is stochastically predictable and flexibly manageable. A case study is presented to highlight the significance of the model. Keywords: Logistics network; Markov process; Risk management; Uncertainty management. 1. Introduction Logistics management concerns with how to optimize the efficiency of logistics activity in a timely and cost effective manner. This can be accomplished through a well-designed logistics network. Traditional logistics network design transfers products from manufacturers to customers and accepts return of disposed products from customers to manufacturers (Lee et al., 2010). Consequently, the logistic network management can be categorized into two types with respect to the product flow, namely, outbound and inbound logistics flows. S.A (2008) claimed that capacitated network could be used to analyze possible long-term transportation to reduce the distribution cost, having demand as an uncertain parameter. The distributors who serve as middlemen in the network of suppliers, warehouses, and customers must be reliable, flexible, and cost awareness. Their role is to select suppliers that will deliver products to destination stores or warehouses and to assign warehouse to customers (Erol and Ferrell Jr, 2004). From the distributor’s standpoint, their net profit will increase if logistics support increases the profit margins or reduces expenses or inventory (Magrath and Hardy, 1992). Problems arise when distributors frequently have conflicting objectives such as minimizing cost and maximizing customer’s satisfaction. They must find a proper mix of cost effectiveness and level of customer’s satisfaction (Erol and Ferrell Jr, 2004). The key to this right mix is management and control of distribution costs. Many firms use enterprise resource planning (ERP) and information systems (IS) as logistics management tools to attain better perceived competitive advantages (Tilokavichai and Sophatsathit, 2011). The increased emphasis on supply chain management, ERP, and the need to develop models with appropriate representation of transportation considerations must be further enhanced to achieve any measurable logistics support (Swenseth and Godfrey, 2002). Rodriguez and Vecchietti (2010) agreed that the inventory, purchasing, delivery, demand and price uncertainties were major contributing problems of the supply chain. They solved the problem using non-linear programming technique. Another essential issue in logistics management is inventory management which poses an important problem in every industry as a tradeoff between customer’s satisfaction and capital investment. The research conducted by Swenseth and Godfrey (2002) demonstrated that economic order quantity models could be 19
  • 2. Information and Knowledge Management www.iiste.org ISSN 2224-5758 (Paper) ISSN 2224-896X (Online) Vol 2, No.5, 2012 incorporated into inventory replenishment decisions. As the buyer and seller marketplace can be handled through e-commerce or third-party logistics providers in order to maximize customer’s satisfaction (Nevins and Money, 2008), many models and methods have been developed to accommodate such an optimization problem. However, few studies have addressed the comprehensive design of logistics networks under uncertainty. Although some research endeavors attempt to describe uncertainty that involves in logistics activities, the analyses are conducted on pair-wise or adjacent activities. This fails to capture cross-relationships among various activities in the logistics network. We envision such intertwined relationships that are inherent to the logistics chain. We propose a working stochastic model to represent the overall logistics perspective and pertinent indicators for firms to improve logistics performance toward better business decisions. The model makes use of Markov process to link order processing, purchasing, inventory management, transportation, and reverse logistics activities under uncertainty. Analysis detail will be described in subsequent sections. The organization of this paper is as follows. Section 2 recounts some related literature and important issues in the area. Section 3 presents the Markov model, including notation used, the meaning of parameters, variables, constraints, and others. Section 4 describes a case study to demonstrate the viability of the proposed model. Section 5 discusses some essential findings and potential future course of action. 2. Literature Review 2.1 Logistics Network Model Traditional business model is articulated in three stages: production, distribution, and sales. Each one of these stages is usually managed by a different company, or by a different branch of the same company (S.A, 2008). Logistics activities for distribution products start from order processing, inventory management, purchasing and procurement, transportation, and reverse logistics (Lai et al., 2010; Wu and Huang, 2007; Aptel and Pourjalali, 2001; Ngai et al., 2008). A logistics network model thus becomes very important in logistics management (Listes, 2007). Lee, et al. (2010) developed a sustainable logistics network under uncertainty using stochastic programming to attain cost savings and pollution reduction as a result of sharing material handling equipment and infrastructure. El-Sayed, et al. (2010) developed forward-reverse logistics network design under risk model to maximize the total expected profit. The problem was formulated in a stochastic mixed integer programming and decision making process. Pishvaee, et al. (2009) applied a stochastic programming model with an integrated forward/reverse logistics network design under uncertainty to minimize the total costs including fixed opening cost, transportation cost, and processing costs. S.A. (2008) applied stochastic programming to design capacitated network analyzing possible long-term transportation of oil derivatives by pipeline, truck, railway, and ship so as to reduce the distribution cost. Moreover, Wilcox, et al. (2011) applied Markov model to handle reverse logistics operations and related financial management of the reverse logistics/return processes. Lee, et al. (2010) applied stochastic programming in reverse logistics to minimize cost and time. Listes (2007) developed a supply and return network using stochastic programming in demand and forecasting, transportation, and reverse logistics. One of the reasons why the transportation issue has become the mainstay of logistics management is because the annual transportation costs are the largest expense in logistic system where the majority of costs incurred depend on volume of products (S.A, 2008). The aforementioned models have wide range of applications in logistics reliability, liquidity, cost efficiency, time reduction, etc. However, previous researches assumed that the logistics network was a continuous process, and hence the design parameters for the logistics network mostly focused on forward logistics or reverse logistics. Table 1 summarizes some of the techniques and logistics activities for logistics models from previous studies. 2.2 Risk Management Logistics have become a major component of competitive strategy to enhance organizational productivity and profitability. Unfortunately, the constituent activities in the logistics chain do not operate without chances of failure to meet the desired objective. This window of missing the pre-established target is known as risk. Hence, risk management in logistics activities is a very important factor of competitive advantage formula. El-Sayed, et al. (2010) proposed a multi-period multi-echelon forward and reverse logistics network model under risk to maximize the total expected profit. Ramanathan (2010) explored the relationships between logistics performance and customer loyalty that affected by risk characteristics of products and efficiencies of the websites in terms of price and ambiguity of 20
  • 3. Information and Knowledge Management www.iiste.org ISSN 2224-5758 (Paper) ISSN 2224-896X (Online) Vol 2, No.5, 2012 products. Cope, et al. (2010) delivered actionable policy recommendations based on consumer preferences for different approaches to food management by risk communication such as sharing knowledge of consumer risk perceptions and information needs. Tsao (2011) developed an inventory model with non-instantaneous delivery under trade credit and logistics risk. The model determined the optimal replenishment policy for a retailer, given uncertainties in a supply chain which were due to unforeseeable disruption or various types of defect such as shipping damage, missing parts, misplaced products and disasters, etc. 2.3 Stochastic process and Markov model Stochastic programming is an optimizing technique using probabilistic information to solve large scale probabilistic optimization problems (Yu and Li, 2000). Markov decision process is a sequential decision-making stochastic process characterized by five elements: decision epochs, states, actions, transition probabilities, and rewards (Puterman, 1994). Many areas of science and technology use Markov chain to resolve complex problems of the underlying factors attributing to different types of transitions, reverse transitions, and repeated transitions (Ataharul Islam and Chowdhury, 2006; S.A, 2008). Markovian formulations are useful in solving a number of real-world problems under uncertainties, such as determining inventory levels for retailers and scheduling maintenance for manufacturers (Zhao et al., 2010). It provides more flexibility in statistically examining multiple transitions simultaneously and predicts the future state of a system from its present state ignoring its past history. Therefore, Markov chain is more effective at providing predictive information for managers and offers likelihood estimations for future outcomes (Wilcox et al., 2011). Its probabilistic nature renders the technique ideal for solving logistics problems under uncertainties, such as determining inventory level for retailers, scheduling maintenance for manufacturers, scheduling/planning in production management, and resource planning for time, cost, and human (Gayon et al., 2009). In addition, as the Just-in-Time (JIT) mode is introduced, the branches need not stock large inventories. The inventory cost can also be reduced (Zhao et al., 2010). A transient state can be formally defined as state from which the unit can change before leaving the system. Examples of transient states that could be considered might include purchasing, replenishment, distribution, etc. The goals are minimum cost, minimum time, and maximum profit. Logistics models were developed by many techniques such as stochastic programming, Markov decision process, EOQ, etc., as summarized in Table 1. These techniques in turn were further applied to outbound, inbound, or reverse logistics in a pair-wise fashion. The lack of holistically integrated study of these activities left logistics problems hard to reckon with. The advent and application of information technology merely speeds up routine activities but leaves the inherent complexity untouched. The introduction of Markov model to analyze transition probabilities in logistics activities entails a promising means to tackle such obstacles. As transitional capability of the Markov process can represent multi-stage flow of logistics activities under uncertainty, the resulting representative model can be used for further study on minimizing costs, time, opportunity loss, and maximizing flexibility, where different activities can be transited within the logistics distribution network. 2.4 Logistics activity based costing Supply chain management requires accurate cost data regarding all activities and process within the organizations. Activity-Based Costing (ABC) can significantly contribute accurate cost data regarding all activities in supply chain management (Askarany et al., 2010; Gunasekaran et al., 2004). Gupta and Galloway (2003) demonstrated the managerial implications of an Activity-Based Costing/Management (ABC/M) system for various operation management decisions relating to product planning and design, quality management and control, inventory management, capacity management, and work force management that support decision-making of operation managers. Schulze, et al. (2012) applied ABC model in supply chain environment for inter-firms cost saving opportunities. Baykasoglu and Kaplanoglu (2008) applied ABC with business process modeling and analytical hierarchy approach for effective costing services of land transportation companies. Hung (2011) integrated approaches of ABC and management such as five forces analysis, risk analysis, decision making, analytic network process, and fuzzy goal programming for precise costing, managerial constraints, competitive advantage analysis, and risk management. 3. Proposed Markov model The model is a formulation of the logistics network design that consists of outbound, inbound, and reverse logistics. This model serves as a basis for numerous studies on logistics activity relationship to accomplish a set of designated 21
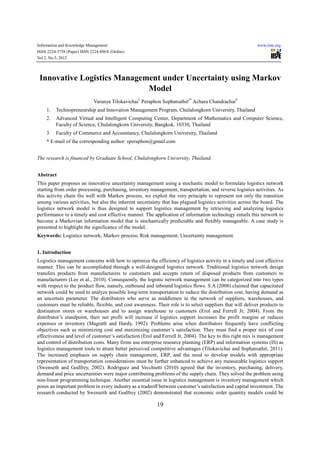
  • 4. Information and Knowledge Management www.iiste.org ISSN 2224-5758 (Paper) ISSN 2224-896X (Online) Vol 2, No.5, 2012 objectives. Qin, et al. (2009) designed the logistics network between stochastic demand and inventory control to minimize cost under a predefined service level. The granularity of description detail depends on the context and focus of logistics problems under study. The proposed model is applied to a case study of the logistics network design for a distribution business. Preliminary analysis has established the working scenarios given in the previous section. During the course of the research, it was discovered that though many distributors claimed to place high priority on regular logistics activities, a few distributors had monitored related data with the same degree of intensity and depth of analysis on sales effort. The actual site was conducted at XYZ Company which is a large ceramic tile and sanitary ware manufacturer in Thailand. The true identity was withheld for confidentiality. XYZ has total annual income over 7.5 billion Baht, part of which about 150 million Baht was spent on transportation in 2011. Meanwhile, XYZ presently handles approximately 80,000 items that make up 75 product types from 392 vendors. The average vendors’ lead time is 8 days which account for the total inventory values of 890 million Baht. There are 1,200 staffs serving logistics activities, or 75 percent of all employees. Over 150,000 customers visit the branches annually. There are 164 vehicles or 90 percent of all of vehicles being deployed in customer delivery, which usually takes 2 days. The main obstacle that hinders profitability is logistics management. Therefore, the ultimate goals of this case study do not limit to only demonstrate how the proposed Markovian information model copes with the risk involved in the company’s logistics network, but also exploitation of the model to optimize the costs incurred. We calculated logistics costs from financial statement of XYZ such as wages, transportation, fuel, repair, communication, depreciation of vehicles and others, insurance, utilities, interests, and administrative costs expended in percentage of sales. However, we could not reveal all real data. As such, an overall logistics cost structure is categorized in four groups as follows: 1) interests from logistics activities, 2) transportation, packaging, fuel, depreciation of vehicles, and other relating maintenance costs, 3) wages, allowances, and welfares for logistics activities, and 4) other costs such as communication, miscellany, depreciation, utilities, taxes, and other administrative costs. The model was applied to internal logistics process, where financial data were provided by XYZ. The data reflected a twelve-state Markov chain, with almost all transitions between states was tracked by ERP system. The model is not intended to yield an exhaustive list of possible states or transitions, but rather an example demonstrates the utility of the model. Its flexibility could be customized to suit individual distributor setting based on their logistics policy. The analysis breakdown of XYZ logistics network by Markov process is shown in Figure 1. We measured the number of transactions, cost per transaction, and time spent in each activity from ERP. Cost per transaction is calculated from logistics cost structure. This is a unit performance measure of any logistics activity at a given stage. For example, order processing (O1) and inventory management at branch (I1 and I2) both have cost per transaction of 144 Baht. This is because all three activities are executed at the same ERP node (this is architectural dependent on ERP configuration). The total logistics activity costs divided by all transactions executed at this node is therefore 24,500,000/(1,119+155,094+14,448) = 144 Baht. Similarly, a reflexive link at O1 designates a pending status of 1,119 transactions at 144 Baht that affected the annual income by 16,543,457 Baht or about 3 percent. Figure 1 displays the probability that associates with each transition in the logistics activity network. The latter represents a complete logistics chain based on Markov process at time t (in month), t = 1, 2, …, n. A sale transaction starting at a branch can be filled with probability 0.91 and delivery to customer by the branch with probability 0.43. If the branch is out of stocks with probability 0.08, a purchase order is initiated with probability 0.99 in accordance with normal branch replenishment by the distribution center (DC). In order to minimize the expected transportation cost, XYZ needs to establish a viable delivery decision based on available information. The result will furnish several alternate routes, each of which is associated with uncertainty that is translated into time, cost, flexible course of action for customer, and adaptability to JIT principle that altogether meeting the demands in the given period (t, t+j), where j is the number of transition steps in the Markov chain. Figure 2 shows the transition matrix Q of the logistics network depicted in Figure 1. A state describes the option of the logistics activity at time t. The entry Sij represents the transition probability from state i to state j. A transaction (row-wise) beginning at O1 will remain in O1 with 0.01; transit to I1 with 0.91; and to I2, with 0.08. Consider when a customer places an order at the branch office. The order is filled and eventually delivered to the customer by the same branch office. According to the analysis breakdown, there are seven possible routes to get from order processing (O1) to transportation to customer (T2) as shown in Table 2. The state of a delivery to customer is determined only by previous state. In the first route, we begin at O1 and proceed to I1 then T2 with probabilities 0.91 and 0.43, respectively. In the second route, the items are out of stock (I2) which calls for additional issuance of a purchase 22
  • 5. Information and Knowledge Management www.iiste.org ISSN 2224-5758 (Paper) ISSN 2224-896X (Online) Vol 2, No.5, 2012 order at purchasing and procurement (P1). Upon replenishing stock (I1), the items are sent to transportation to customer (T2) with probabilities 0.08, 0.99, 0.26, and 0.43, respectively. In the third route, similar scenarios to the second route are resulted. Fortunately, DC carries sufficient desired items to fill the stock at the branch office and the case is closed. The fourth route is similar to the second, except replenishments go to DC first before being discharged to the branch office, while the fifth route relays replenishments to cross dock and follows the same track. The only undesirable situation occurs in the sixth route where orders are returned due to wrong shipment, quantity, or quality that must be reprocessed to fulfill the order. Nevertheless, the risk is low (0.0050) but the penalty is extremely costly. Finally, the seventh route exhibits a typical order request to DC, filled, and return with the desired product to the branch before shipping it to the customer by the same branch. To determine the probability of going from A to B in one transition, denoted by P(AB), follow the established Markov process. Hence, the probability P that an order will be delivered to customer by branch based on all of the above scenarios is P = P(O1I1)P(I1T2) + P(O1I2)P(I2P1)P(P1I1)P(I1T2) + P(O1I2)P(I2Id1)P(Id1I1)P(I1T2) + P(O1I2)P(I2P1)P(P1Id1)P(Id1I1) P(I1T2) + P(O1I2)P(I2P1)P(P1Id2)P(Id2I1)P(I1T2) + P(O1I1)P(I1T2)P(T2R1)P(R1I1)P(I1T2) + P(O1I1)P(I1Id1)P(Id1I1)P(I1T2) Thus, P = (0.91)(0.43) + (0.08)(0.99)(0.26)(0.43) + (0.08)(0.01)(0.62)(0.43) + (0.08)(0.99)(0.41)(0.62)(0.43) + (0.08)(0.99)(0.26)(1.0)(0.43) + (0.91)(0.43)(1.0)(0.03)(0.43) + (0.91)(0.01)(0.62)(0.43) = 0.43 This tells us that an order has a 43% chance to reach the branch for on-time delivery. If we consider all possible two-step transitions based on the same scenarios, we obtain Q2= Q x Q as shown in Figure 3. As the values of the Q matrix are derived from company’s internal item tracking of logistics activities over several periods, it is possible to predict the expected number of sale order transactions, or the number of transactions in each delivery type, by customer, by branch, by vendor, etc., for enterprise resource planning and increase customer’s satisfaction. 4. Case studies and managerial implications Firms in various industries are implementing logistics systems to reduce costs and increase profits. Due to the unpredictable nature of logistics, firms must strive to achieve high service level agreement to attain customer’s satisfaction. The proposed model will offer top executives to set the target of logistics performance indicators based on information from Markov model such as lead time to customer, opportunity cost, transportation, and inventory costs. Logistics manager can exercise the above policy to meet the target by predicting possible routes to preventing subsequent problems and risks. They can monitor and identify implementable solutions bearing potential risks and problems to arrive at viable course of action. The food and beverage sector, for instance, must have intensive control over both incoming and outgoing logistics of raw materials and finished goods owing to their perishable nature. Moreover, stricter regulations and consumer awareness impose higher requirements for food quality and safety (Losito et al., 2011). As uncertainty and unpredictability of food demands are a normal problem of this sector, they must pay close attention to distribution level problems such as lead time, abrupt and abnormal demands (Kumar and Nigmatullin, 2011). Bozkir and Sezer (2011) examined food demand prediction by applying chi-squared automatic interaction detection, classification, and regression trees, while others resort to tools such as Just-in-Time (JIT) for cost reduction (Zarei et al., 2011). We studied FF Company who produces fruits and fresh vegetables ready to cook and eat for export to European countries. The company is certified with EURAPGAP, BRC, and BRC/IOP. They encountered a big opportunity loss problem as sales plummeted from 7% down to 3 %. The main causes are the high price and shortage of unseasonal agricultural raw materials which in turn affect freight quality and disposal cost. The logistics activity relationship matrix of FF Company consists of order processing and inventory management which are mutually dependent on average duration (days) of supply to customers, inventory management, purchasing/ procurement, and measured by economic order quantity and reorder point (Kumar and Nigmatullin, 2011). Typically, perishable food transportation involves multiple variables such as distribution centers, product varieties, carriers, vehicles, and customers. These variables attribute to another utmost important controlled variable, i.e., temperature which often fluctuates by many factors. Besides, the delivery vehicles usually have multiple customer deliveries per cycle (White III and Cheong, 2012; Ahumada and Villalobos, 2011). In Table 3, there are six possible routes from order processing (O) to transportation to wholesaler (T). The state of a 23
  • 6. Information and Knowledge Management www.iiste.org ISSN 2224-5758 (Paper) ISSN 2224-896X (Online) Vol 2, No.5, 2012 delivery to the wholesaler is determined only by previous state. In the first route, we begin at O and proceed to purchasing and procurement issuance of a purchase order (P). After that fruits and vegetables are cut and pack for ready to cook and eat (M). Finally, the items are sent to transportation to wholesaler in Europe by air (T) with probabilities P(O-P-M-T). In this route, raw material and finished goods are not buffered anywhere. As such, the hand-off between states can be treated as a JIT delivery. In the fifth route, the concern is on raw material (I1) that must have enough quantity and in good quality. Thus, the Markov model can support managers in making decision and predict on customer’s demand, opportunity loss, EOQ, reorder point, disposal cost, etc. For service industry such as hospitals, logistics activities consist of purchasing, physical supply, receiving, inventory management, internal distribution to medical units, and management information systems. Distribution operations usually focus on inventory scheduling decisions. The variables involved are: when to place order and deliver to each care unit. Therefore the activities balance through the purchasing cycle (Lapierre and Ruiz, 2007). Moreover, distribution of suppliers such as central warehouse or direct vender distribution and volume of medicine being distributed affect logistics performance of the hospital (Aptel and Pourjalali, 2001). In this case, the speed of service is an important variable in servicing the patients. The Markov model can be deployed to improve such a work flow to reduce cost, increase customer’s satisfaction, and safe health care of patients. It is apparent that Markov model can be applied in several industries such as food, electronics, fashion, and services. It helps solve problems such as over stock, severe delays, inaccurate product forecasts, inefficient service flow, lost sales and liquidity. The information from Markov model can be used to set target, predict opportunity cost, time, service level, reduce inventory, eliminate bullwhip effect, and improve communication. One direct IT application is direct manufacturer to customer sales (in the case of Compaq) which in the context of the proposed logistics network model is just a jump from regular sale order distribution channel in the supply chain, bypassing wholesalers and retailers to customers. The risk paid off beautifully. 5. Conclusion and future research This paper has explored the logistics network activity management under uncertainty. In order to account for the uncertain characteristics of the logistics network, the Markov model has been developed where the demands of outbound logistics, inbound logistics, and returned product from customers are assumed to be stochastic parameters with known distribution. The model addresses some recalcitrant logistics activity problems that have high holding costs and uncertain demands. The application of Markov chain provides relevant predictions for managers and likelihood estimations for future outcome. Since logistics management is a part of the strategic map that attributes to the firm’s competitive advantage (Quezada, 2009), we selected a case study of a large-scale logistics network firm to demonstrate the viability of the proposed model. The results have not only shown product distribution alternatives, but also demonstrated an integrated systematic method that yielded cost effective logistics network performing at high customer’s satisfaction level. The case study shown in Figure 1 also encompasses a number of valuable information to be extracted. The opportunity loss in order processing with probability 0.01 or 16,543,457 Baht is caused by inadequate stock to fill the order. This in turn will affect liquidity situation because the branch does not generate sales and remains to reckon with creditors. Although XYZ has its own DC that is equipped with automatic inventory replenishment system, but the risk of being out of stock exists. Analysis on activity flow can determine the time spent, associated costs, and risk involved of a sale order (O1), encountering out of stocks situation (I2), issuing a corresponding PO (P1), before proceeding to either DC stocks (Id1) or cross dock (Id2). Therefore, top executive, middle managers, operation managers, and other parties involved could communicate, discuss, or lay out strategic planning to be in-line with organization objectives. Moreover, the company can cooperate with vendors and customers using the result information obtained from Markov analysis to meet the target logistics mission, while minimizing cost, time, improving customer’s satisfaction and competitive advantage over its competitors. It is thus apparent that the information is attributive to decision making in planning and controlling resources, transportation, and risk management. The enormity of cumulative uncertainties that are inherent to all stages of the logistics chain has prompted us to delve into the overall cost structure. From the externally imposing service level and demands from customers and competitors, various holding costs, transportation cost, JIT lot size, etc., have affected the entire downstream operations in branches and vendors alike. We also found that the unraveled uncertainties could in fact be directly translated into anticipatory risks that the company could mitigate or avoid. Thus, we can predict lead time reduction by 24
  • 7. Information and Knowledge Management www.iiste.org ISSN 2224-5758 (Paper) ISSN 2224-896X (Online) Vol 2, No.5, 2012 JIT, as well as the associated costs derived from suppliers and customers’ data. Future research will explore organization cost analysis by applying ABC that incorporates additional variables such as number of staffs in each logistics activity, vehicles, transportation zones, sales representatives, vendors, order distribution, and working time in each logistics activity. A precautionary warning is that adoption of ABC in smaller firms needs more attention than larger firms in light of risk and uncertainty involved. The proposed model can very well suit different industries such as food, electronics, machinery, fashion, and service sectors, as long as there are logistics activities involved. In particular, we are gathering in-depth information on food industry as the perishable nature mandates a highly efficient logistics network to reduce time-to-market which is the life line of their business survival. We also plan to apply the proposed technique on returned goods from stocks at branch to DC (R2), customer to branch stocks (R1), and DC stocks to vendors (R3), thereby minimizing costs of exchange, staging, scrap (due to damage), and out dated stock clearance. Owing to the volume of such returned goods, efforts to reduce the probability of loss sales ignited an innovative in-house product development to churn out artistically design of blending piece scrap to a new product line. The outlook is promising as demand steadily grows. Our future work will incorporate dynamic prediction by a weighted coefficient of variables. Consequently, the introduction of Markovian information model will be conducive toward effective minimizing cost and predicting future outcome that further enhances the competitive advantage of the firm. References Ahumada, O. & Villalobos, J. R. (2011). Operational model for planning the harvest and distribution of perishable agricultural products. International Journal of Production Economics. 133 (2), 677-687. Aptel, O. and Pourjalali, H. (2001). Improving activities and decreasing costs of logistics in hospitals: A comparison of U.S. and French hospitals. The International Journal of Accounting, 36 (1), 65-90. Askarany, D., Yazdifar, H. and Askary, S. (2010). Supply chain management, activity-based costing and organisational factors. International Journal of Production Economics. 127 (2), 238-248. Ataharul Islam, M. and Chowdhury, R. I. (2006). A higher order Markov model for analyzing covariate dependence. Applied Mathematical Modelling. 30 (6), 477-488. Baykasoglu, A. and Kaplanoglu, V. (2008). Application of activity-based costing to a land transportation company: A case study. International Journal of Production Economics. 116 (2), 308-324. Bozkir, A. S. & Sezer, E. A. (2011). Predicting food demand in food courts by decision tree approaches. Procedia Computer Science. 3, 759-763. Cope, S., Frewer, L. J., Houghton, J., Rowe, G., Fischer, A. R. H. and De Jonge, J. (2010). Consumer perceptions of best practice in food risk communication and management: Implications for risk analysis policy. Food Policy. 35 (4), 349-357. El-Sayed, M., Afia, N. and El-Kharbotly, A. (2010). A stochastic model for forward-reverse logistics network design under risk. Computers and Industrial Engineering. 58 (3), 423-431. Erol, I. and Ferrell Jr, W. G. (2004). A methodology to support decision making across the supply chain of an industrial distributor. International Journal of Production Economics. 89 (2), 119-129. Gayon, J.P., Benjaafar, S. and de Vericourt, F. (2009). Using Imperfect Advance Demand Information in Production-Inventory Systems with Multiple Customer Classes. Manufacturing and Service Operations Management. 11 (1), 128–143. Gunasekaran, A., Patel, C. and Mcgaughey, R. E. (2004). A framework for supply chain performance measurement. International Journal of Production Economics. 87 (3), 333-347. Gupta, M. and Galloway, K. (2003). Activity-based costing/management and its implications for operations management. Technovation. 23 (2), 131-138. Horvath, P. A., Autry, C. W. and Wilcox, W. E. (2005). Liquidity implications of reverse logistics for retailers: A Markov chain approach. Journal of Retailing. 81 (3), 191-203. 25
  • 8. Information and Knowledge Management www.iiste.org ISSN 2224-5758 (Paper) ISSN 2224-896X (Online) Vol 2, No.5, 2012 Houghton, J. R., Rowe, G., Frewer, L. J., Van Kleef, E., Chryssochoidis, G., Kehagia, O., Korzen-Bohr, S., Lassen, J., Pfenning, U. and Strada, A. (2008). The quality of food risk management in Europe: Perspectives and priorities. Food Policy. 33 (1), 13-26. Hung, S.-J. (2011). Activity-based divergent supply chain planning for competitive advantage in the risky global environment: A DEMATEL-ANP fuzzy goal programming approach. Expert Systems with Applications. 38 (8), 9053-9062. Kim, H., Lu, J.-C., Kvam, P. H. and Tsao, Y.-C. (2011). Ordering quantity decisions considering uncertainty in supply-chain logistics operations. International Journal of Production Economics. 134 (1), 16-27. Kumar, S. & Nigmatullin, A. (2011). A system dynamics analysis of food supply chains – Case study with non-perishable products. Simulation Modelling Practice and Theory. 19 (10), 2151-2168. Lai, K.-H., Wong, C. W. Y. and Cheng, T. C. E. (2010). Bundling digitized logistics activities and its performance implications. Industrial Marketing Management. 39 (2), 273-286. Lapierre, S. D. & Ruiz, A. B. (2007), Scheduling logistic activities to improve hospital supply systems, Computers & amp; Operations Research, 34 (3), 624-641. Lee, D.-H., Dong, M. and Bian, W. (2010). The design of sustainable logistics network under uncertainty. International Journal of Production Economics. 128 (1), 159-166. Lin, B., Cole, J.C., Shreveport, E., Shreveport, P. and Su, R.K. (2001). Supply chain costing: An activity-based perspective. International Journal of Physical Distribution and Logistics Management. 31 (10), 702–713. Listes, O. (2007). A generic stochastic model for supply-and-return network design. Computers and Operations Research. 34 (2), 417-442. Liu, C.-L. and Lyons, A. C. (2011). An analysis of third-party logistics performance and service provision. Transportation Research Part E: Logistics and Transportation Review. 47 (4), 547-570. Losito, P., Visciano, P., Genualdo, M. & Cardone, G. (2011). Food supplier qualification by an Italian Large-scale-Distributor: Auditing system and non-conformances. Food Control. 22 (12), 2047-2051. Lumsden, K., Stefansson, G. and Tilanus, B. (2003). Collaboration in Logistics. European Journal of Operational Research. 144 (2), 235-236. Magrath, A. J. and Hardy, K. G. (1992). Manufacturer services for distributors. Industrial Marketing Management. 21 (2), 119-124. Mutha, A. and Pokharel, S. (2009). Strategic network design for reverse logistics and remanufacturing using new and old product modules. Computers and Industrial Engineering. 56 (1), 334-346. Nevins, J. L. and Money, R. B. (2008). Performance implications of distributor effectiveness, trust, and culture in import channels of distribution. Industrial Marketing Management. 37 (1), 46-58. Ngai, E. W. T., Lai, K.-H. and Cheng, T. C. E. (2008). Logistics information systems: The Hong Kong experience. International Journal of Production Economics. 113 (1), 223-234. Pirttilä, T. and Hautaniemi, P. (1995). Activity-based costing and distribution logistics management. International Journal of Production Economics. 41 (1-3), 327-333. Pishvaee, M. S., Jolai, F. and Razmi, J. (2009). A stochastic optimization model for integrated forward/reverse logistics network design. Journal of Manufacturing Systems. 28 (4), 107-114. Puterman, M.L., (1994). Markov Decision Processes: Discrete Stochastic Programming. John Wiley, New York, NY. Qin, J., Shi, F., Miao, L.-X. and Tan, G.-J. (2009). Optimal Model and Algorithm for Multi-Commodity Logistics Network Design Considering Stochastic Demand and Inventory Control. Systems Engineering - Theory and Practice. 29 (4), 176-183. Quezada, L. E., Cordova, F. M., Palominos, P., Godoy, K. and Ross, J. (2009). Method for identifying strategic objectives in strategy maps. International Journal of Production Economics. 122 (1), 492-500. Ramanathan, R. (2010). The moderating roles of risk and efficiency on the relationship between logistics performance 26
  • 9. Information and Knowledge Management www.iiste.org ISSN 2224-5758 (Paper) ISSN 2224-896X (Online) Vol 2, No.5, 2012 and customer loyalty in e-commerce. Transportation Research Part E: Logistics and Transportation Review. 46 (6), 950-962. Rodríguez, M. A. & Vecchietti, A. (2009). Integrating Purchase Contract Decisions with Inventory Management Optimization in the Supply Chain. Computer Aided Chemical Engineering. 27, 315-320. Rodriguez, M. A. and Vecchietti, A. (2010). Inventory and delivery optimization under seasonal demand in the supply chain. Computers and Chemical Engineering. 34 (10), 1705-1718. S.A, M. (2008). An operational planning model for petroleum products logistics under uncertainty. Applied Mathematics and Computation. 196 (2), 744-751. Schulze, M., Seuring, S. and Ewering, C. (2012). Applying activity-based costing in a supply chain environment. International Journal of Production Economics. 135 (2), 716-725. Swenseth, S. R. and Godfrey, M. R. (2002). Incorporating transportation costs into inventory replenishment decisions. International Journal of Production Economics. 77 (2), 113-130. Tilokavichai, V. and Sophatsathit, P. (2011). An Organization-Wide Analysis of ERP and Information Systems Interrelationship for Logistics Support. Journal of System and Management Sciences. 1 (1), 59-68. Tsao, Y. C. (2011). Replenishment policies considering trade credit and logistics risk, Scientia Iranica. 18 (3), 753-758. Wilcox, W., Horvath, P. A., Griffis, S. E. and Autry, C. W. (2011). A Markov model of liquidity effects in reverse logistics processes: The effects of random volume and passage. International Journal of Production Economics. 129 (1), 86-101. Wu, F., Yeniyurt, S., Kim, D. and Cavusgil, S. T. (2006). The impact of information technology on supply chain capabilities and firm performance: A resource-based view. Industrial Marketing Management. 35 (4), 493-504. Wu, Y.-C.J. and Huang, I. C. (2007). Operations research practice on logistics management in Taiwan: An academic view. European Journal of Operational Research. 182 (1), 428-435. Yu, C.-S. and Li, H.-L. (2000). A robust optimization model for stochastic logistic problems. International Journal of Production Economics. 64 (1-3), 385-397. Zarei, M., Fakhrzad, M. B. & Jamali Paghaleh, M. (2011). Food supply chain leanness using a developed QFD model. Journal of Food Engineering. 102 (1), 25-33. Zhao, Q. H., Chen, S., Leung, S. C. H. and Lai, K. K. (2010). Integration of inventory and transportation decisions in a logistics system. Transportation Research Part E: Logistics and Transportation Review. 46 (6), 913-925. Table 1. Summary of techniques, activity flow, and measurement of logistics network. Logistics Activities: D: Demand & Forecasting, I: Inventory Management, W: Warehouse Management, P: Purchasing & Procurement, O: Order Processing, T: Transportation, R: Reverse Logistics. Measurement: C: Cost, T: Time, P: Profit, S: Service Level, W: Waste/defect, L: Liquidity. 27
  • 10. Information and Knowledge Management www.iiste.org ISSN 2224-5758 (Paper) ISSN 2224-896X (Online) Vol 2, No.5, 2012 Figure 1. Breakdown of XYZ logistics network. Table 2. Routes from order processing (O1) to transportation to customer (T2). C Route Prob Lead Time (hours) Cost per transaction (Baht) 1 O1-I1-T2 0.3913 42 144+124 = 268 2 O1-I2-P1-I1-T2 0.0089 201+42 = 243 144+22+23+124 = 313 3 O1-I2-Id1-I1-T2 0.0002 24+42 = 66 144+22+68+124 = 358 4 O1-I2-P1-Id1-I1-T2 0.0087 22+177+24+42 = 265 144+22+23+68+124 = 381 5 O1-I2-P1-Id2-I1-T2 0.0089 22+189+12+42 = 265 144+22+23+50+124 = 363 6 O1-I1-T2- R1-I1-T2 0.0050 42+360+42 = 444 144+124+144+124 = 536 7 O1-I1-Id1-I1-T2 0.0024 12+24+42 = 78 144+114+68+124 = 450 C: Case, Prob: Probability Figure 2. The transition matrix of the logistics network. 28
  • 11. Information and Knowledge Management www.iiste.org ISSN 2224-5758 (Paper) ISSN 2224-896X (Online) Vol 2, No.5, 2012 Figure 3. Two-step transitions matrix. Table 3. Routes from order processing (O) to transportation to wholesaler (T). Case Routes Probability 1 O-P-M-T P(O-P-M-T) 2 O-P- I1-M-T P(O-P- I1-M-T) 3 O-P-M-I2-T P(O-P-M-I2-T) 4 O-P-I1-M- I2-T P(O-P-I1-M- I2-T) 5 O- I1-M-T P(O- I1-M-T) 6 O- I1-M-I2-T P(O- I1-M-I2-T) O: order processing, P: purchase order, M: wholesaler, I1: raw material, I2: finished goods, T: transportation 29
  • 12. This academic article was published by The International Institute for Science, Technology and Education (IISTE). The IISTE is a pioneer in the Open Access Publishing service based in the U.S. and Europe. The aim of the institute is Accelerating Global Knowledge Sharing. More information about the publisher can be found in the IISTE’s homepage: http://www.iiste.org The IISTE is currently hosting more than 30 peer-reviewed academic journals and collaborating with academic institutions around the world. Prospective authors of IISTE journals can find the submission instruction on the following page: http://www.iiste.org/Journals/ The IISTE editorial team promises to the review and publish all the qualified submissions in a fast manner. All the journals articles are available online to the readers all over the world without financial, legal, or technical barriers other than those inseparable from gaining access to the internet itself. Printed version of the journals is also available upon request of readers and authors. IISTE Knowledge Sharing Partners EBSCO, Index Copernicus, Ulrich's Periodicals Directory, JournalTOCS, PKP Open Archives Harvester, Bielefeld Academic Search Engine, Elektronische Zeitschriftenbibliothek EZB, Open J-Gate, OCLC WorldCat, Universe Digtial Library , NewJour, Google Scholar