BP Energy Outlook 2035 - Global insights 2014
•
0 recomendaciones•786 vistas

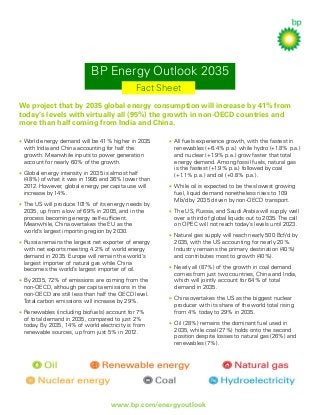
Global insights from BP's Energy Outlook 2035 published in 2014. We project that by 2035 global energy consumption will increase by 41% from today’s levels with virtually all (95%) the growth in non-OECD countries and more than half coming from India and China.
Recomendados

Recomendados
Más contenido relacionado
Destacado
Destacado (12)
Más de bp
Más de bp (20)
BP Energy Outlook 2035 - Global insights 2014
- 1. BP Energy Outlook 2035 Fact Sheet We project that by 2035 global energy consumption will increase by 41% from today’s levels with virtually all (95%) the growth in non-OECD countries and more than half coming from India and China. • World energy demand will be 41% higher in 2035 with India and China accounting for half the growth. Meanwhile inputs to power generation account for nearly 60% of the growth. • Global energy intensity in 2035 is almost half (48%) of what it was in 1995 and 36% lower than 2012. However, global energy per capita use will increase by 14%. • The US will produce 101% of its energy needs by 2035, up from a low of 69% in 2005, and in the process becoming energy self-sufficient. Meanwhile, China overtakes the EU as the world’s largest importing region by 2030. • Russia remains the largest net exporter of energy with net exports meeting 4.2% of world energy demand in 2035. Europe will remain the world’s largest importer of natural gas while China becomes the world’s largest importer of oil. • By 2035, 72% of emissions are coming from the non-OECD, although per capita emissions in the non-OECD are still less than half the OECD level. Total carbon emissions will increase by 29%. • Renewables (including biofuels) account for 7% of total demand in 2035, compared to just 2% today. By 2035, 14% of world electricity is from renewable sources, up from just 5% in 2012. • All fuels experience growth, with the fastest in renewables (+6.4% p.a.) while hydro (+1.8% p.a.) and nuclear (+1.9% p.a.) grow faster that total energy demand. Among fossil fuels, natural gas is the fastest (+1.9% p.a.) followed by coal (+1.1% p.a.) and oil (+0.8% p.a.). • While oil is expected to be the slowest growing fuel, liquid demand nonetheless rises to 109 Mb/d by 2035 driven by non-OECD transport. • The US, Russia, and Saudi Arabia will supply well over a third of global liquids out to 2035. The call on OPEC will not reach today’s levels until 2023. • Natural gas supply will reach nearly 500 Bcf/d by 2035, with the US accounting for nearly 20%. Industry remains the primary destination (40%) and contributes most to growth (40%). • Nearly all (87%) of the growth in coal demand comes from just two countries, China and India, which will jointly account for 64% of total demand in 2035. • China overtakes the US as the biggest nuclear producer with its share of the world total rising from 4% today to 29% in 2035. • Oil (28%) remains the dominant fuel used in 2035, while coal (27%) holds onto the second position despite losses to natural gas (26%) and renewables (7%). www.bp.com/energyoutlook