Trinidad & Tobago - Trade Profile [UWI's Shridath Ramphal Centre]
•
0 recomendaciones•205 vistas


Recomendados
Recomendados
Más contenido relacionado
La actualidad más candente
La actualidad más candente (17)
Destacado
Destacado (16)
Similar a Trinidad & Tobago - Trade Profile [UWI's Shridath Ramphal Centre]
Similar a Trinidad & Tobago - Trade Profile [UWI's Shridath Ramphal Centre] (20)
Más de Office of Trade Negotiations (OTN), CARICOM Secretariat
Más de Office of Trade Negotiations (OTN), CARICOM Secretariat (20)
Trinidad & Tobago - Trade Profile [UWI's Shridath Ramphal Centre]
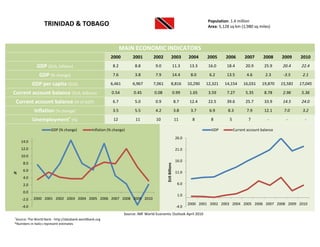
- 1. Population: 1.4 million TRINIDAD & TOBAGO Area: 5,128 sq km (1,980 sq miles) MAIN ECONOMIC INDICATORS 2000 2001 2002 2003 2004 2005 2006 2007 2008 2009 2010 GDP ($US, billions) 8.2 8.8 9.0 11.3 13.3 16.0 18.4 20.9 25.9 20.4 22.4 GDP (% change) 7.6 3.8 7.9 14.4 8.0 6.2 13.5 4.6 2.3 -3.5 2.1 GDP per capita ($US) 6,461 6,967 7,061 8,816 10,290 12,321 14,154 16,031 19,870 15,581 17,045 Current account balance ($US, billions) 0.54 0.45 0.08 0.99 1.65 3.59 7.27 5.35 8.78 2.96 5.36 Current account balance (% of GDP) 6.7 5.0 0.9 8.7 12.4 22.5 39.6 25.7 33.9 14.5 24.0 Inflation (% change) 3.5 5.5 4.2 3.8 3.7 6.9 8.3 7.9 12.1 7.0 3.2 Unemployment+ (%) 12 11 10 11 8 8 5 7 - - - GDP (% change) Inflation (% change) GDP Current account balance 26.0 14.0 12.0 21.0 10.0 16.0 8.0 6.0 $US Billions % 11.0 4.0 2.0 6.0 0.0 1.0 -2.0 2000 2001 2002 2003 2004 2005 2006 2007 2008 2009 2010 2000 2001 2002 2003 2004 2005 2006 2007 2008 2009 2010 -4.0 -4.0 Source: IMF World Economic Outlook April 2010 + Source: The World Bank - http://databank.worldbank.org *Numbers in italics represent estimates
- 2. Population: 1.4 million TRINIDAD & TOBAGO Area: 5,128 sq km (1,980 sq miles) MAIN TRADE INDICATORS – SERVICES 2005 2006 2007 2008 2009 Trade Balance ($US thousands) 3,917,571 7,541,038 5,733,415 9,059,027 2,170,534 Total Exported Value ($US thousands) 9,611,480 14,018,734 13,396,245 18,650,424 9,125,971 Total Imported Value ($US thousands) 5,693,909 6,477,696 7,662,830 9,591,397 6,955,437 Top 10 Markets by % of Total Exported Value (2009) Top 10 Markets by % of Total Imported Value (2009) United States of America 54% United States of America 31% Jamaica 5% Colombia 10% Spain 5% Russian Federation 8% United Kingdom 4% Gabon 7% Barbados 3% China 5% Suriname 2% Brazil 5% Guyana 2% Congo 3% Republic of Korea 1% Germany 3% Argentina 1% United Kingdom 3% France 1% Canada 2% Ores, Top 5 Exports by % of Total Exported Value (2009) Vehicles Top 5 Imports by % of Total Imported Value (2009) Electrical, slag Organic other than electronic and chemicals, 3% railway, equipment, 5% ash, tramway, 4% 3% Iron and steel, 3% Articles of iron Mineral or steel, 6% Inorganic fuels, oils, chemicals, distillation precious metal products, compound, 33% Nuclear Mineral fuels, isotopes, 4% reactors, oils, distillation boilers, products, 76% machinery, 17% Source: International Trade Centre – www.trademap.org
- 3. Population: 1.4 million TRINIDAD & TOBAGO Area: 5,128 sq km (1,980 sq miles) MAIN TRADE INDICATORS – SERVICES 2003 2004 2005 2006 2007 Trade Balance ($US thousands) 313,800 479,500 356,200 450,900 546,400 Total Exported Value ($US thousands) 685,200 850,800 896,900 813,700 923,800 Total Imported Value ($US thousands) 371,400 371,300 540,700 362,800 377,400 Top Exports by % of Total Exported Value (2007) Top Imports by % of Total Imported Value (2007) Travel 50% Transportation 46% Transportation 25% Travel 25% Insurance services 15% Government services 15% Other business services 5% Other business services 14% Communications services 4% Communications services 0.4% Government services 2% Insurance services 0.1% Source: International Trade Centre – www.trademap.org