1. Industry, trade and services Data in focus
Authors: Anna LÖÖF, Heidi SEYBERT
46/2009
Internet usage in 2009 - Households and Individuals
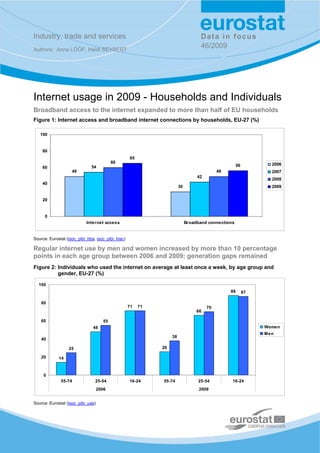
Broadband access to the internet expanded to more than half of EU households
Figure 1: Internet access and broadband internet connections by households, EU-27 (%)
100
80
65
60 2006
60 54 56
49 49 2007
42
2008
40
30 2009
20
0
Internet access Broadband connections
Source: Eurostat (isoc_pibi_hba, isoc_pibi_hiac)
Regular internet use by men and women increased by more than 10 percentage
points in each age group between 2006 and 2009; generation gaps remained
Figure 2: Individuals who used the internet on average at least once a week, by age group and
gender, EU-27 (%)
100
88 87
80
71 71 70
66
60 55
48 Women
Men
38
40
25 26
20 14
0
55-74 25-54 16-24 55-74 25-54 16-24
2006 2009
Source: Eurostat (isoc_pibi_use)
2. Table 1: Internet access and broadband connections by households, 2006 - 2009 (%)
Internet access Broadband connections
2006 2007 2008 2009 2006 2007 2008 2009
EU27 49 54 60 65 30 42 49 56
BE 54 60 64 67 48 56 60 63
BG 17 19 25 30 10 15 21 26
CZ 29 35 46 54 17 28 36 49
DK 79 78 82 83 63 70 74 76
DE 67 71 75 79 34 50 55 65
EE 46 53 58 63 37 48 54 62
IE 50 57 63 67 13 31 43 54
EL 23 25 31 38 4 7 22 33
ES 39 45 51 54 29 39 45 51
FR 41 49 62 63 30 43 57 57
IT 40 43 47 53 16 25 31 39
CY 37 39 43 53 12 20 33 47
LV 42 51 53 58 23 32 40 50
LT 35 44 51 60 19 34 43 50
LU 70 75 80 87 44 58 61 71
HU 32 38 48 55 22 33 42 51
MT 53 54 59 64 41 44 55 63
NL 80 83 86 90 66 74 74 77
AT 52 60 69 70 33 46 54 58
PL 36 41 48 59 22 30 38 51
PT 35 40 46 48 24 30 39 46
RO 14 22 30 38 5 8 13 24
SI 54 58 59 64 34 44 50 56
SK 27 46 58 62 11 27 35 42
FI 65 69 72 78 53 63 66 74
SE 77 79 84 86 51 67 71 80
UK 63 67 71 77 44 57 62 69
HR : 41 45 50 : 23 27 39
MK 14 : 29 42 1 : 23 34
TR : 20 : : : 17 : :
IS 83 84 88 90 72 76 83 87
NO 69 78 84 86 57 67 73 78
RS : 26 : 37 : 7 : 23
: data not available
Source: Eurostat (isoc_pibi_hba, isoc_pibi_hiac)
A large majority of young people in EU-27 used the internet daily
Figure 3: Individuals who used the internet on average every day or almost every day, 2009 (%)
100
90
80
70
60
50
40
30
20
10
0
SE NL DK LU FI UK BE DE EE FR SK AT EU27 SI LV HU MT LT IE IT ES PL CY CZ PT BG EL RO
Individuals aged 16-24 Individuals aged 16-74
Source: Eurostat (isoc_ci_ifp_fu)
2 46/2009 — Data in focus
3. Nearly 90 % of the EU population with high formal education used the internet
regularly, more than twice as much as the share for the population with low formal
education
Figure 4: Individuals who used the internet on average at least once a week, by age group and
level of education, EU-27, 2009 (%)
100 97 no or low formal education
90 92
medium formal education
87
83 high formal education
80
69 69
65
60
38 40 39
40
20 15
0
Total 16-24 25-54 55-74
Source: Eurostat (isoc_pibi_use)
About half of individuals in EU-27 used the internet for finding information about
goods and services
Figure 5: Individuals who used the internet for finding information about goods or services for
private purposes in the last 3 months, 2009 (%)
100
90
80
70
60
50
40
30
20
10
0
NL SE LU DK FI DE UK FR BE AT EE IE E 27 SK
U CZ LV SI MT HU ES LT PT CY EL IT PL BG RO
Source: Eurostat (isoc_ci_ac_i)
Data in focus — 46/2009 3
4. Nearly 40 % of individuals in EU-27 shopped online in 2009; about one fifth
of e-shoppers bought from other EU countries
Table 2: Individuals having bought or ordered goods or services for private use over the internet in
the last 12 months, 2009
Country of origin of seller
By age (multiple answers possible)
Total Men Women
National Other EU Rest of
16-24 25-54 55-74 unknown
sellers countries the world
as % of individuals who bought or ordered over the
% of individuals
internet
EU27 37 40 34 47 43 18 92 22 12 5
BE 36 41 30 41 44 16 80 47 11 4
BG 5 5 4 7 6 1 83 31 16 u
CZ 24 27 21 32 29 8 93 10 3 4
DK 64 66 61 71 75 39 85 37 15 5
DE 56 60 53 66 70 28 97 16 7 1
EE 17 16 17 21 22 u 82 34 16 u
IE 37 37 36 38 45 14 67 54 27 3
EL 10 13 7 14 13 2 64 41 25 8
ES 23 26 20 29 28 7 85 29 15 7
FR 45 46 43 62 52 u 95 26 14 12
IT 12 16 9 16 16 4 81 28 16 8
CY 16 20 13 20 20 4 21 74 36 1
LV 19 19 19 25 24 4 80 38 12 2
LT 8 9 8 13 10 u 77 31 16 u
LU 58 65 52 52 68 39 31 87 17 2
HU 16 17 15 21 20 5 92 14 5 3
MT 34 39 29 61 40 7 18 84 44 2
NL 63 66 59 75 73 35 94 20 10 9
AT 41 46 36 58 49 15 61 65 8 3
PL 23 26 21 40 28 5 96 9 3 3
PT 13 15 11 22 16 4 81 43 19 u
RO 2 2 2 4 3 0 91 24 7 2
SI 24 25 23 38 29 6 83 36 14 2
SK 28 29 27 38 34 7 84 29 5 4
FI 54 54 53 71 68 20 88 35 15 3
SE 63 65 61 72 74 39 94 16 9 1
UK 66 70 62 78 74 43 95 17 18 3
HR 10 11 9 16 13 2 64 28 20 3
MK 3 3 2 3 3 u 51 36 12 4
IS 44 45 42 44 51 25 80 46 52 u
NO 70 74 65 77 81 41 86 37 20 2
RS 5 6 3 8 5 1 70 30 6 3
u : unreliable data
Source: Eurostat (isoc_ec_ibuy)
Figure 6: National and cross-border purchases of goods and services by individuals, 2009 (as % of
individuals who bought or ordered over the internet in the last 12 months)
100
90
80
70
60
50
40
30
20
10
0
LU MT CY AT IE BE PT EL LV DK SI FI EE BG LT ES SK IT FR RO EU27 NL UK DE SE HU CZ PL
National sellers Sellers from other EU countries Sellers from outside EU27
Source: Eurostat (isoc_ec_ibuy)
4 46/2009 — Data in focus
5. About half of e-shoppers in the EU booked travel or holiday accommodation
Figure 7: Types of goods and services bought or ordered over the internet for private use, EU-27,
2009 (as % of individuals who bought or ordered over the internet in the last 12 months)
60
50
40
30
20
10
0
Travel & Clothes & sports Household Tickets for Books, Films & music Computer Electronic Computer
holiday goods goods events magazines & software equipment (incl. hardware
accommo- e-learning cameras)
dation material
Source: Eurostat (isoc_ec_ibuy)
About one third of the population not having used the internet for e-commerce
had concerns about payment security
Figure 8: Reasons for not buying or ordering goods or services over the internet, EU-27, 2009
(as % of individuals who did not buy or order over the internet in the last 12 months)
0 10 20 30 40 50 60 70 80
Prefer to shop in person
Have no need
Payment security concerns
Privacy concerns, e.g. giving personal details
Trust concerns about receiving, returning goods, complaint or redress concerns
Lack of skills
Don’t have a payment card
Other reason
Delivery is a problem
Lack of information about products on website
Speed of internet connection is too slow
Source: Eurostat (isoc_ec_inb)
Data in focus — 46/2009 5