DBMS-A Toll for Attaining Sustainability of Eco Systems
•
1 recomendación•307 vistas

IOSR Journal of Computer Engineering (IOSRJCE)

Recomendados
Más contenido relacionado
Destacado
Destacado (20)
Similar a DBMS-A Toll for Attaining Sustainability of Eco Systems
Similar a DBMS-A Toll for Attaining Sustainability of Eco Systems (20)
Más de IOSR Journals
Último
Último (20)
DBMS-A Toll for Attaining Sustainability of Eco Systems
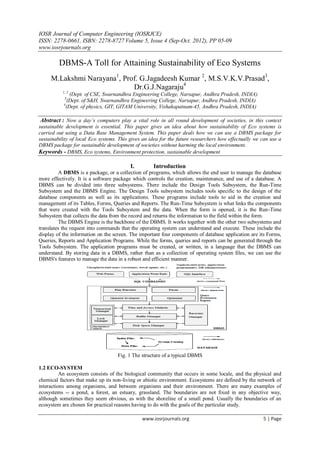
- 1. IOSR Journal of Computer Engineering (IOSRJCE) ISSN: 2278-0661, ISBN: 2278-8727 Volume 5, Issue 4 (Sep-Oct. 2012), PP 05-09 www.iosrjournals.org www.iosrjournals.org 5 | Page DBMS-A Toll for Attaining Sustainability of Eco Systems M.Lakshmi Narayana1 , Prof. G.Jagadeesh Kumar 2 , M.S.V.K.V.Prasad3 , Dr.G.J.Nagaraju4 1, 2 (Dept. of CSE, Swarnandhra Engineering College, Narsapur, Andhra Pradesh, INDIA) 3 (Dept. of S&H, Swarnandhra Engineering College, Narsapur, Andhra Pradesh, INDIA) 4 (Dept. of physics, GIT, GITAM University, Vishakapatnam-45, Andhra Pradesh, INDIA) Abstract : Now a day’s computers play a vital role in all round development of societies, in this context sustainable development is essential. This paper gives an idea about how sustainability of Eco systems is carried out using a Data Base Management System. This paper deals how we can use a DBMS package for sustainability of local Eco systems. This gives an idea for the future researchers how effectually we can use a DBMS package for sustainable development of societies without harming the local environment. Keywords - DBMS, Eco systems, Environment protection, sustainable development I. Introduction A DBMS is a package, or a collection of programs, which allows the end user to manage the database more effectively. It is a software package which controls the creation, maintenance, and use of a database. A DBMS can be divided into three subsystems. There include the Design Tools Subsystem, the Run-Time Subsystem and the DBMS Engine. The Design Tools subsystem includes tools specific to the design of the database components as well as its applications. These programs include tools to aid in the creation and management of its Tables, Forms, Queries and Reports. The Run-Time Subsystem is what links the components that were created with the Tools Subsystem and the data. When the form is opened, it is the Run-Time Subsystem that collects the data from the record and returns the information to the field within the form. The DBMS Engine is the backbone of the DBMS. It works together with the other two subsystems and translates the request into commands that the operating system can understand and execute. These include the display of the information on the screen. The important four components of database application are its Forms, Queries, Reports and Application Programs. While the forms, queries and reports can be generated through the Tools Subsystem. The application programs must be created, or written, in a language that the DBMS can understand. By storing data in a DBMS, rather than as a collection of operating system files, we can use the DBMS's features to manage the data in a robust and efficient manner. Fig. 1 The structure of a typical DBMS 1.2 ECO-SYSTEM An ecosystem consists of the biological community that occurs in some locale, and the physical and chemical factors that make up its non-living or abiotic environment. Ecosystems are defined by the network of interactions among organisms, and between organisms and their environment. There are many examples of ecosystems -- a pond, a forest, an estuary, grassland. The boundaries are not fixed in any objective way, although sometimes they seem obvious, as with the shoreline of a small pond. Usually the boundaries of an ecosystem are chosen for practical reasons having to do with the goals of the particular study.
- 2. Dbms-A Toll For Attaining Sustainability Of Eco Systems www.iosrjournals.org 6 | Page Fig. 2 A typical Ecosystem & its components II. Tools For Creation Of A Data Base Fig.3: Flow Chart showing the methodology for preparation of DBMS model for the current study The generation of data base needs the source information comprising spatial data and non spatial data or attribute data. The spatial data is comprised of land use/land cover, drainage, base details and soil maps etc. The non-spatial or attribute data is composed of climatic parameters, crop pattern etc. The steps involved in deriving all these data products, the sources of data acquisition and the ways of transforming these data products suitable to a DBMS are discussed in this paper. The spatial data issues involve data collection strategies, the use of cartographic and remote sensing products as sources of digital data and digital characteristics of spatial databases. Data collection issues include the choice of spatial model for discrediting geographic properties, for example, necrotizing the real world by objects with clearly defined boundaries, defining regions such as polygons with assumed internal homogeneity. These spatial models are transformed into various data structures such as the raster or vector formats. 2.1 ORGANIZATION OF SPATIAL DATA The spatial elements are application specific and are mainly made of maps obtained from different sources. The spatial elements are categorized into primary elements, which are digitized and / or entered into the DATA COLLECTION DATA INPUT (Manual Entry) PRIMARY DATA Secondary Data (Collateral data) DATA CONVERSION DATA BASE CREATION
- 3. Dbms-A Toll For Attaining Sustainability Of Eco Systems www.iosrjournals.org 7 | Page database, and derived elements, those that are derived from the primary elements based upon GIS (Geographic Information System) operation. To perform this study, the spatial database is created with the help of scanning with automated digitization. The data was obtained from Survey of India toposheets, satellite digital data and ground observations. A master template is created as a reference layer and consisting of the boundary, drainage and base map features etc. Spatial data manuscripts are consisting features that are to be digitized. And the instructions like, registration point locations and identifiers, features codes as per the defined codes, feature boundaries, tolerance specifications and other relevant digitization / scanning instructions to be followed. The spatial database includes the following Base map Drainage map Watershed map Road network map Mandal reference map Village reference map Physiographic map 2.1.2. The characteristic features of the Base map are Major roads Major settlements Rivers Water bodies Railway line Forest areas etc 2.1.3 Drainage network helps in delineation of watersheds. Drainage density and type of drainage gives information related to runoff, infiltration relief and permeability. The Drainage map consists of all water bodies, rivers, tributaries, perennial & ephemeral streams, reservoirs, tanks, ponds and the entire drainage network from first order originating in the area to the last order joining the rivers, tributaries and tanks. 2.1.4 Watersheds are the hydrologic units for planning and implementation of various development programs. Watershed is defined as a “Natural Hydrologic entity that cover a specific area expanse of land surface from which the rainfall runoff flows to a defined drain, channel, stream or river at any particular point.” Water Resources Regions are assigned Arabic numbers 1, 2, 3…. Basins are assigned letters as A, B, C…. Catchments are assigned Arabic numbers 1, 2, 3…. Sub catchments are assigned letters as A, B, C…. Watersheds are assigned Arabic numbers 1, 2, 3…. Thus, watersheds will have the codes like 1A1A1, 2B2A3, 3A5C4, etc 2.1.5 The road network map contains mainly railway stations and marshalling yards, main bus complexes and main road junctions. Recreational facilities and parks are may also marked. Other features like road/rail bridges, brick kilns, field bunds, rows of trees in orchards could be identified. The road network map was used for the selection of shortest route during the field work for the collection of Agriculture information from farmers. 2.1.6 The Mandal reference map may be prepared using survey of India toposheets (1:25,000 scale) and the map shows the all mandal head quarters and locations of all the revenue villages in the district. 2.1.7 The village reference map shows the locations of all the revenue villages in the district. The map also contains Mandal boundaries as shown in the source map. The village reference map is used for location - reference purpose of particular crops and cropping pattern and Agricultural research stations, Religious, Historic places, Tourist places, Handlooms, Tribal areas etc. 2.1.8 The purpose of physiographic map is to understand disposition and distribution of barriers of winds. Three physiographic maps contains Plains Undulating land Hills and hill ranges Based on the physical characteristics of the study area, their sources, suitability and environmental sensitivity, the following maps are also use in the preparation of Data Base. Land use / Land cover map
- 4. Dbms-A Toll For Attaining Sustainability Of Eco Systems www.iosrjournals.org 8 | Page Geomorphology map Soil map Ground water potential map Ground water table map Waste land map Agricultural 2.2 ORGANIZATION OF ATTRIBUTE DATA The different types of attribute data used for preparation of DBMS 1. Animal husbandry 2. Mills information 3. Banks 4. Natural water resources 5. Basic village facilities 6. Power supply 7. Birth & death ratio 8. Operational holdings by size classes 9. Government development works 10. Population 11. Education 12. Ration cards details 13. Employment private 14. Social welfare hostels 15. Financial data 16. Telephone data 17. Health & safety 18. Transport 19. Households information 20. Utilities other 21. Industries & business details 22. Watersheds information 23. Infrastructure utilities 24. Agriculture information 25. Literacy information 26. Land information III. Data Base Generation To develop the Data Base, step by step procedure has been implemented as per the above fig3. Geo- database generated for each entity within the study area by mapping its boundaries accurately along with the internal assets/features in the eco system individually. 3.1 FIELD WORK Based on the study area distance, field work may be planned with necessary equipments such as laptop, interface cables, data collection formats or record books etc. 3.2 GENERATION OF ATTRIBUTE DATA A standard format of database sheet was prepared to collect the attribute data in the study area that includes, Pure Plantations, Mixed Plantations, Gregarious occurrence of natural Species, Check Dams, Percolation tank, Staggered Trenches, others. 3.3 GENERATION OF SPATIAL DATA The recorded data (way points) from the GPS receiver downloaded using GPS Track Maker software and exported it as a text file to import in to the Arc View GIS software to create a shape file for all the features. (Polygon or point or line). Point features: Check Dam (CD), Percolation Tanks (PT), Rock fill Dam (RFD), Gully Plugging (GP), other structures, etc. Polygon features: PF boundary, plantations boundary, gregarious occurrences boundaries, etc. Line features: CCT- Continues Contour Trenching, Internal Pathways, etc.
- 5. Dbms-A Toll For Attaining Sustainability Of Eco Systems www.iosrjournals.org 9 | Page 3.4 DATA INTEGRATION Created spatial database requires integration with corresponding attribute data. The entire digital database converted into geo-database of environment as customized application to develop the final DBMS. IV. Future Work This paper gives an idea, how we can generate a DBMS package for better understanding the local ecosystems without harming to the environment. A lot of future work is associated with this, using GIS, Remote sensing and rigorous field work. In further development of DBMS researchers may use this as ground. V. Conclusions The above discussions is used as a tool for generating a DBMS package of any part of the country/ region by collecting spatial and attribute data. This may also help for the people who want to set up a DBMS of ecosystems within a limited region. VI. Acknowledgements The author acknowledges Dr. P. V. V. PRASADA RAO, Professor, Department Of Environmental Sciences, Andhra University, Visakhapatnam for his guidance and suggestions and also to Dr.S.Ramesh Babu, Secretary & Correspondent, management of Swarnandhra Engineering College-Narsapur, Andhra Pradesh. REFERENCES [1] Anji Reddy, (2001) M., Textbook of Remote Sensing and Geographical Information Systems, B. S. Publications, Hyderabad, 2001 [2] Boston, T. and Stockwell, D., “Interactive species distribution reporting, mapping and modeling using the World Wide Web,” [3] Proceedings of Second International WWW Conference’94: Mosaic and the Web, Chicago, USA (1994) [4] Chen, C. T., “Database management system of Nanjenshan LTER site,” Proceedings of an International Workshop on Long-Term [5] Ecological Research (LTER) and Biodiversity Conservation in East Asia and Pacific Region, Seoul Education and Culture Center, [6] Seoul, Korea (1998) [7] Conrad, C. Dech, S. W. Hafeez, M. Lamers, J. Martius, C. Strunz, G. 2007, Mapping and assessing water use in a Central Asian [8] irrigation system by utilizing MODIS remote sensing products. (Special issue: Emerging issues on land and water in Central Asia.),Irrigation and Drainage Systems.21: 3/4, 197-218. many ref [9] Densham, P. J., Spatial Decision Support Systems. In Geographical Information Systems: Principles and Applications, edited by [10] Maguire, Goodchild, and Rhind (Essex, England: Longmans), 1, pp. 403-412, 1992 [11] Encyclopedia of Environmental Sciences 1992, revised volume 15 [12] Jain, Sadhana and Jain, R. K. (2003). An Integrated Information System for Urban and Regional Planning: Some Suggestions. Spatio-Economic Development Record (SDR), vol. 10, no. 2, pp. 16-21 [13] Maji A K, Krishna N D R and Challa O 1998 Geographical information system in analysis and interpretation of soil resource data for land use planning. . Journal of the Indian Society of Soil Science 46(2): 405-407 [14] Meta-HTML: A Dynamic Programming Language for WWW Applications Brian J. Fox (http://www.metahtml.com) [15] Murthy Y.V.S.,Uday Baskar Rao, S.V.C. and Perumal A.(1997), Geographic Information System Approach to suggest LanduseAlternatives for Sustainable Rural Development, Geographic Information Systems and Remote Sensing Applications, ICORG – 1997,India [16] National Remote Sensing Agency (1995), Integrated Mission for Sustainable Development, Technical Guidelines pp: 1-100 [17] Liu Li-wei; Nie Yan; Zhou Yong (2005), Multi-suitability Evaluation of Cultivated Land in Houhu Farm Area Based on GIS and [18] niche-fitness, Wuhan University Journal of Natural Sciences Vol.: 10, No.: 4,[Page 796-802] [19] Loh, D. K., Choo, Y. K., and Hsieh, Y. T., “Global resource and environmental information management and exchange,” Proceedings of 1995International Symposium on Sustainable Development, Taipei, pp. 154-166 (1995)