
Recomendados
Recomendados
Más contenido relacionado
La actualidad más candente
La actualidad más candente (16)
Similar a Prediction of the in vitro intrinsic clearance determined in suspensions of human hepatocytes by using artificial neural networks
Similar a Prediction of the in vitro intrinsic clearance determined in suspensions of human hepatocytes by using artificial neural networks (20)
Prediction of the in vitro intrinsic clearance determined in suspensions of human hepatocytes by using artificial neural networks
- 1. This article appeared in a journal published by Elsevier. The attached copy is furnished to the author for internal non-commercial research and education use, including for instruction at the authors institution and sharing with colleagues. Other uses, including reproduction and distribution, or selling or licensing copies, or posting to personal, institutional or third party websites are prohibited. In most cases authors are permitted to post their version of the article (e.g. in Word or Tex form) to their personal website or institutional repository. Authors requiring further information regarding Elsevier’s archiving and manuscript policies are encouraged to visit: http://www.elsevier.com/copyright
- 2. Author's personal copy European Journal of Pharmaceutical Sciences 39 (2010) 310–321 Contents lists available at ScienceDirect European Journal of Pharmaceutical Sciences journal homepage: www.elsevier.com/locate/ejps Prediction of the in vitro intrinsic clearance determined in suspensions of human hepatocytes by using artificial neural networks Paulo Paixão a,b , Luís F. Gouveia a , José A.G. Morais a,∗ a iMed.UL, Faculdade de Farmácia, Universidade de Lisboa, A. Prof. Gama Pinto, 1649-003, Lisboa, Portugal b DCS, Universidade Lusófona, Lisboa, Portugal a r t i c l e i n f o a b s t r a c t Article history: Use of in vitro suspensions of human hepatocytes is currently accepted as one of the most promising Received 21 July 2009 tools for prediction of metabolic clearance in new drugs. The possibility of creating computational models Received in revised form based on this data may potentiate the early selection process of new drugs. We present an artificial neural 15 December 2009 network for modelling human hepatocyte intrinsic clearances (CLint ) based only on calculated molecular Accepted 20 December 2009 descriptors. In vitro CLint data obtained in human hepatocytes suspensions was divided into a train group Available online 7 January 2010 of 71 drugs for network optimization and a test group of another 18 drugs for early-stop and internal validation resulting in correlations of 0.953 and 0.804 for the train and test group respectively. The model Keywords: Human hepatic clearance applicability was tested with 112 drugs by comparing the in silico predicted CLint with the in vivo CLint In vitro intrinsic clearance estimated by the “well-stirred” model based on the in vivo hepatic clearance (CLH ). Acceptable correlations Human hepatocytes suspension were observed with r values of 0.508 and 63% of drugs within a 10-fold difference when considering blood In silico prediction binding in acidic drugs only. This model may be a valuable tool for prediction and simulation in the drug Artificial neural network development process, allowing the in silico estimation of the human in vivo hepatic clearance. © 2009 Elsevier B.V. All rights reserved. 1. Introduction ico methods (Ekins et al., 2000). A recent review (Fagerholm, 2007) recommended that, of these, physiologically based in vitro–in vivo Undesirable pharmacokinetic properties are still one of the prediction using hepatocytes intrinsic clearances (CLint ), should major reasons for drug failures and the low success rate of drug be applied and improved. In this type of approach, the CLint value discovery programs (Singh, 2006). Due to lack of reliable predic- determined in human hepatocytes suspensions is used to predict tive models in early development phases, new drug entities are the CLH in human after inclusion on a mathematical liver model subjected to a large number of in vitro and animal in vivo tests with physiological parameters. The “well-stirred” model (Rowland before they are ultimately administered in man. During phase et al., 1973) is one of the most used, due to its simplicity and 1 clinical studies, development is frequently discontinued after reasonable results (Ito and Houston, 2004). In its original form, a large number of data has already been produced. Due to cost, the “well-stirred” model emphasizes the relationship between the time and ethical reasons, the use of in silico methods based on blood perfusion (Q), metabolic activity (CLint ) and blood binding this data to predict fundamental ADME (absorption, distribution, (fB ) in the hepatic clearance of drugs. However, inclusion of fB for metabolism and elimination) properties is increasing, and already all drugs often results in poor predictions mainly for basic, neutral plays a role in the early drug candidate selection (Richon, 2008). and zwitterionic drugs and various authors proposed extrapo- Hepatic clearance (CLH ) is a major pharmacokinetic parameter, lations without the inclusion of this parameter (Jacobson et al., as it is related both to the drug elimination and to the drug oral 2007; Lau et al., 2002; McGinnity et al., 2004; Reddy et al., 2005). bioavailability. Due to those two facts, and since it influences the Some in silico methods are already being published with variable dose and dose regime in man, it is a major factor for drug selection success (Chang et al., 2008; Ekins, 2003; Ekins and Obach, 2000; in the development phase of new drug candidates. Several methods Jolivette and Ward, 2005; Lee et al., 2007; Li et al., 2008; Schneider exist to predict CLH in humans, namely interspecies extrapolation et al., 1999; Turner et al., 2004; Wajima et al., 2002; Zuegge et (Wajima et al., 2002), allometric scaling (Hu and Hayton, 2001), al., 2001). These could be divided into methods employing only in in vitro–in vivo correlations (Naritomi et al., 2003), physiologically silico-derived parameters or combining in vitro and in vivo data. based in vitro–in vivo prediction (Ito and Houston, 2004) and in sil- The first class is extremely useful, as it would provide clearance prediction before the drug actually exists. Moreover, since in silico ∗ Corresponding author. Tel.: +351 21 794 64 44/00/72; fax: +351 21 794 64 70. methods are, by nature, only the first line of drug selection, the type E-mail address: jagmorais@ff.ul.pt (J.A.G. Morais). of parameter predicted should also play a role when developing an 0928-0987/$ – see front matter © 2009 Elsevier B.V. All rights reserved. doi:10.1016/j.ejps.2009.12.007
- 3. Author's personal copy P. Paixão et al. / European Journal of Pharmaceutical Sciences 39 (2010) 310–321 311 Table 1 In vitro CLint values collected in the literature. Values were determined in human hepatocytes suspensions using the substrate depletion method without the addition of serum in the incubation medium. Compounds Data set log in vitro CLint ( l/min/106 cells) In silico predicted a A B C D E F G H I J 7-Hydroxycoumarin Train – – – – – – – – – 1.4 – – 1.37 4-Methylumbelliferone Val – – – – – – – – – – – 1.51 1.14 Acebutolol Train – – – – – – 0.26 – – – – – 0.2 Acetaminophen Train −0.11 – – – – – – – – – – – −0.13 Antipyrine Train – −0.33 – – – – – – – – – – −0.36 Atenolol Train – – – – – – −1.00 – – – – – −0.95 Benzydamine Train – – – 1.31 – – – – – – – – 1.13 Bepridil Train – – – – – – 0.30 – – – – – 0.45 Betaxolol Train – – – – – – 0.40 – – – – – 0.37 Bisoprolol Test – – – – – – 0.20 – – – – – 0.01 Bosentan Train – – – – – 0.18 – – – – – – 0.13 Bromocriptine Train – – – – – – 1.57 – – – – – 1.8 Bufuralol Train – – – – – – – – – 0.85 – – 1.09 Caffeine Train – 0.15 – – – – 0.52 – – – – – 0.46 Carbamazepine Train – – – – −0.10 – 0.30 – – – – – 0.18 Carvedilol Train – – – – – – 1.54 – – – – – 1.37 Cerivastatin Val – – – – – – – – – – – 0.23 0.7 Cetirizine Train – – – – – – −1.00 – – – – – −0.95 Chlorpheniramine Train – – – – – – 0.45 – – – – – 0.95 Chlorpromazine Test – 1.04 – – – – – – – – 0.71 – 1.36 Chlorprothixene Train – 1.15 – – – – – – – – – – 1.43 Cimetidine Train – – – – – – 0.08 – – – – – 0.15 Clozapine Test – – – – – – 0.78 – – – – – 1.06 Codeine Train – – – – – – 1.36 – – – – – 1.46 Desipramine Train – 1.04 – – – – 0.48 – – – – – 0.92 Dextromethorphan Test – – – – – – 0.88 1.20 1.18 – – – 1.03 Diazepam Train 0.13 0.15 – – – – −0.52 −0.05 −0.05 0.30 – – −0.02 Diclofenac Test – – – – – – – 1.67 1.64 0.90 – – 0.42 Diltiazem Train 1.37 0.67 – – – – 0.95 1.11 1.11 – – – 1.07 Diphenhydramine Train – – – – – – 0.78 – – – – – 0.7 Doxepin Train – – – – – – 1.11 – – – – – 0.78 Ethinylestradiol Test – – – – – – 0.85 0.85 0.70 – – – 0.29 Famotidine Train – – – – – – −1.00 – – – – – −1.03 FK079 Train 1.11 – – – – – – – – – – – 0.98 FK1052 Train 0.41 – – – – – – – – – – – 0.38 FK480 Train 0.51 – – – – – – – – – – – 0.64 Fluoxetine Train – – – – – – 0.00 – – – – – −0.11 Furosemide Test – −2.00 – – – – – – – – – – −1.37 Gemfibrozil Train – – – – – – – 1.38 1.30 – – – 1.3 Granisetron Train – – – – – – 0.95 – 0.85 – – – 0.41 Ibuprofen Train – 0.62 – – – – – – – – – – 0.67 Imipramine Train – 0.91 – – – – – – 0.85 – – – 1.15 Irbesartan Val – – – – – – – – – – – 0.81 −0.28 Isradipine Train – – – – – – 1.26 – – – – – 0.79 Ketoprofen Test – – – – – – – 0.60 0.00 – – – −0.23 Lidocaine Train – – – – – – – – – – 1.13 – 0.88 Lorazepam Test – −0.57 – – – – 0.00 – – – – – 0.04 Mephenytion Val – – – – – – – – – – – 0.32 −0.56 Methylprednisolone Train – 0.99 – – – – – – – – – – 1.14 Metoprolol Train – – – – – – 0.85 0.85 1.00 – 0.81 – 0.76 Midazolam Train – 0.85 – – – 1.10 1.15 1.15 1.04 0.90 – – 0.8 Morphine Train – – – – – – 1.38 – – – – – 1.38 Nadolol Test – – – – – – −1.00 – – – – – −0.88 Naloxone Test – 1.45 – – – 1.90 2.33 – – – – – 1.52 Naproxen Train – – – – – – – 0.70 0.48 – – – 0.98 Nifedipine Train – 0.89 – – – – 0.75 – – – – – 0.93 Nitrendipine Test – – – – – – 0.87 – – – – – 1.03 Nortriptyline Train – – – – – – – – – – 0.44 – 0.46 Omeprazole Train – – – – – – 0.23 – – – – – 0.24 Ondansetron Train – – – – – – 0.15 – – – – – 0.7 Oxazepam Train – 0.30 – – – – – – – – – – 0.19 Oxyprenolol Val – – – – – – – – – – – 0.34 1.03 Phenacetin Train – – – – – – – – – 0.88 – – 1.02 Phenytoin Train – – – – 0.47 – – – – – – – 0.57 Pindolol Test – – – – – – 0.45 – – – – – 0.58 Pirenzepine Train – – – – – – −1.00 – – – – – −0.94 Prazosin Train – – – – – – 0.36 – – – – – 0.58 Prednisone Train – 0.99 – – – – – – – – – – 0.88 Procainamide Train – – – – 0.11 – – – – – – – 0.09 Propafenone Test – – – – – – – – – – 1.76 – 0.54 Propofol Train – – – – – – 2.03 2.03 1.96 – – – 1.52
- 4. Author's personal copy 312 P. Paixão et al. / European Journal of Pharmaceutical Sciences 39 (2010) 310–321 Table 1 (Continued ) Compounds Data set log in vitro CLint ( l/min/106 cells) In silico predicted a A B C D E F G H I J Propranolol Test – 1.00 – – – – 1.00 1.18 1.28 – 1.11 – 0.98 Quinidine Train – – – – 0.74 – – – – – – – 0.51 Quinotolast Train −2.00 – – – – – – – – – – – −1.92 Ranitidine Train – – – – – – 0.00 – – – – – 0.02 Ritonavir Train – – – – – – 0.32 – – – – – 0.31 Scopolamine Train – – – – – – 0.85 – – – – – 1.02 Sildenafil Train – 0.72 – – – – – – – – – – 1.03 Sulpiride Train – −2.00 – – – – – – – – – – −1.83 Temazepam Test – – – – – – 0.30 – – – – – −0.14 Tenoxicam Train – 0.41 – – – – – – – – – – 0.18 Terbutaline Train – −2.00 – – – – – – – – – – −2 Theophylline Test – −0.28 – – −0.32 – – – – – – – −0.56 Tolbutamide Train – 0.20 – – – – – – – – −0.25 – −0.07 Triazolam Train – – – – – – 0.00 – – – 0.34 – 0.17 Triprolidine Train – – – – – – 0.63 – – – – – 0.42 Troglitazone Train 1.32 – – – – – – – – – – – 1.4 Valproic acid Test – – – – −0.31 – – – – – – – 0.67 Verapamil Train – 1.20 – – – – 1.26 1.62 1.63 – – – 1.54 Vinpocetine Train – – 2.41 – – – – – – – – – 1.76 Warfarin Train – 0.04 – – – – – – – – – – 0.09 Zidovudine Train 0.51 – – – – – – – – – – – 0.41 Zileuton Train – – – – – – 0.32 – – – – – 0.45 Zolpidem Train – – – – – – – – – – 0.56 – 0.62 Data set A–J were obtained from references (Naritomi et al., 2003; Lau et al., 2002; Szakacs et al., 2001; Fisher et al., 2002; Bachmann et al., 2003; Blanchard et al., 2005; McGinnity et al., 2004; Floby et al., 2004; Reddy et al., 2005; Jacobson et al., 2007) respectively. a 2.5% of BSA in the incubation medium. in silico method. For example, various methods exist that directly ances, two additional data sets were also obtained (Tables 2 and 3 ). predict human CLH . Since estimation of the in vivo CLH is frequently These consisted of drugs with human intravenous in vivo pharma- made by considering that the CLH is equal to the in vivo non-renal cokinetic data that were available (Goodman et al., 2006). In these clearance in man, this results in an overestimation of the CLH value. cases, data on intravenous total plasma clearance, free fraction in Another drawback in these types of modelling approaches is that plasma, fraction of drug eliminated by the kidneys, as well as oral prediction confirmation is only possible when the drug is admin- bioavailability were collected. Experimentally determined values istered to humans, leaving no room for “fine-tuning” during the of the drug blood-to-plasma concentration ratio (RB ) were used development phase. whenever available, or calculated according to Paixao et al. (2008). In this study, a new in silico model was developed based on the This model provided predictions of RB with a percentage of correct CLint of 89 drugs determined in vitro with suspensions of human values within a 1.25-fold error of 86, 84 and 87% in the train, test hepatocytes by the substrate depletion method in absence of added and validation data set respectively. serum. Only in silico derived parameters were used, and an artificial neural network was optimized to relate these molecular descrip- 2.2. In silico calculation of the molecular descriptors tors to the in vitro data. The model applicability was tested, in a physiologically based in silico–in vivo approach, with another 112 The following methodology was used for the in silico descrip- drugs from which a reliable estimation of the human in vivo CLH tors: SMILES notation of each molecule was obtained using and the in vivo CLint determined by “well-stirred” model was possi- the on-line PubChem Compound database (http://www.ncbi. ble. With this ANN model it is possible to provide estimates of CLint , nlm.nih.gov). Ionization descriptors (pKa acid ; pKa base ), lipophilic- which could be early validated in the pipeline process of new drug ity (log P) and water solubility (log S) were obtained using the development and that, by using physiologically based in silico–in on-line ALOGPS 2.1 program (Tetko and Bruneau, 2004). For drugs vivo prediction, could be used to estimate the CLH itself. without an acid ionisable group, a value of 15 was attributed to pKa acid . For drugs without a basic ionisable group, a value of −1 was attributed to pKa base . The remaining descriptors, related to 2. Materials and methods size, compactness, lipophilicity and others, were obtained from the on-line E-Dragon 1.0 software using CORINA to convert the 2.1. Data collection SMILES notation to the 3D representation of the molecule (Tetko et al., 2005). A total of 233 molecular descriptors were calculated, In vitro CLint values (Table 1) were obtained from published consisting of 10 molecular properties, 48 constitutional descrip- studies of drug metabolism in human hepatocytes using the sub- tors, 73 topological descriptors, 22 geometrical descriptors, 47 strate depletion method in absence of added serum. Drugs were information indices and 33 WHIM descriptors. randomly divided between a train (n = 71) and a test group (n = 18) used in the ANN optimization process. An external validation group 2.3. ANN model building (n = 5) of data was also considered based on drugs not included in the train and test group from the study of Jacobson et al. (2007). The Artificial Neural Network (ANN) non-linear regression was In this study, although 2.5% of BSA was included in the incuba- performed using the backpropagation neural modelling system tion medium, no differences in CLint were described by the authors Qnet for Windows v.2000 build 751 (Vesta Services Inc., USA) when BSA was not added to the incubation medium. In order to and an in-house developed Microsoft Excel® VBA routine for pro- test the ability of the in silico model to predict in vivo intrinsic clear- cess automation. CLint values were log transformed and randomly
- 5. Author's personal copy P. Paixão et al. / European Journal of Pharmaceutical Sciences 39 (2010) 310–321 313 divided between a train (n = 71) and a test group (n = 18). More than networks were made varying the number of hidden layers (1–3) one CLint experimental value was available for some drugs. In these and the number of hidden neurons (1–5). cases, all values were considered but with a weighting factor of 1/n being n the number of independent determinations of CLint 2.4. Model applicability for the individual drug. Both the input and output variables were normalised, and a sigmoid transfer function was used in all con- Typically, in vitro CLint data determined in human hepato- nections. Early stopping based on the degradation of the root mean cytes suspensions is used to predict the in vivo CLH as this is a square error (RMS) of the test group was used to avoid over fitting. major parameter in order to characterize the drug elimination and Each network was started 20 times with random initial values to bioavailability in man. For that purpose, in vitro CLint data is intro- avoid convergence to local minima. duced in a mathematical liver model, such as the “well-stirred” Network optimization was performed in a two step process. model, and used to predict the human CLH value. With the same The first step consisted of the reduction of the molecular descrip- purpose, we tested the ability of the ANN model to predict both the tors space. This was initially done by removing highly correlated in vivo CLint and the in vivo CLH using the drugs from Tables 2 and 3. (r > 0.90) descriptors, allowing the removal of molecular descrip- Since predictive errors by both the in vitro data and the “well- tors with information contained within another descriptor. Then, stirred” model were expected, drugs from Table 2 that were present an ANN with a network architecture of 1 hidden layer with 3 hidden in the training and test data sets of Table 1 were used to test the neurons was optimized for each of the molecular descriptors class, ability of the in vitro data to predict the in vivo CLint and the in vivo and the relevance of each descriptor within each class of molec- CLH by using the “well-stirred” model. The 112 drugs from Table 3 ular descriptors was tested against the percent contribution for were effectively used to test the ANN model performance in the the final output of a random input variable, allowing the removal same situation. of molecular descriptors that were uncorrelated with the output The in vivo CLH values from Tables 2 and 3 drugs were deter- variable. Finally a pruning procedure was undertaken, using also mined by using Eq. (1) (Naritomi et al., 2003), a network architecture of 1 hidden layer with 3 hidden neurons and including all the remaining molecular descriptors. At the end plasma CLtotal of each optimization, the percent contribution for the final out- CLH = · (1 − frenal ) (1) Rb put was calculated to all descriptors and the descriptor presenting the worst value was removed. This procedure was repeated until a This equation assumes that total blood clearance, determined by significant degradation of the RMS with a descriptor removal was plasma the ratio between the described total plasma clearance (CLtotal ) observed. to the drug blood-to-plasma concentration ratio (RB ), is the sum of The second step consisted of the optimization of the network hepatic and renal clearance the last being determined by using the architecture for the most relevant molecular descriptors. Several fraction of drug eliminated by the kidneys (Frenal ). Table 2 In vivo pharmacokinetic data for the drugs included in the ANN model building and used to evaluate the ability of the in vitro hepatocytes suspensions in estimating the in vivo CLint and CLH by the “well-stirred” model. P indicates data determined in plasma; Bl data determined in blood; F is the drug oral bioavailability; Frenal is the percentage of parent drug eliminated in urine; RB is the blood to plasma concentration ratio of the drug; Fp is the percentage of drug bound to plasma proteins; A acid, B basic, N neutral and Z zwitterionic drug and pH 7.4. CL F (%) Frenal (%) Fp (%) CLtotal (ml min−1 kg−1 ) RB Drug class CLblood (ml min−1 kg−1 ) CLH (ml min−1 kg−1 ) Acetaminophen P 88 30 20 5 1.04 B 4.8 2.40e) Atenolol P 58 94 5 2.4 1.07d) B 2.24 0.13 Carvedilol P 25 2 95 8.7 0.72 B 12.12 11.88 Cimetidine P 60 62 19 8.3 0.97d) B 8.56 3.25 Clozapine P 55 1 95 6.1 1.13 B 5.41 5.36 Diazepam P 100 1 98.7 0.38 0.58d) N 0.66 0.65 Diclofenac P 54 1 99.5 4.2 0.56 A 7.54 7.46 Diltiazem P 38 4 78 11.8 1.00d) B 11.8 11.33 Diphenhydramine P 72 1.9 78 6.2 0.65d) B 9.54 5.60e) Furosemide P 61 66 98.6 2 0.55 A 3.61 1.23 Gemfibrozil P 95 1 97 1.7 0.55 A 3.08 1.00e) Granisetron P 60 16 65 11 0.86 B 12.81 8.00e) Lidocaine P 0.35 2 70 9.2 0.84d) B 10.95 10.73 Lorazepam P 93 1 91 1.1 1.05 N 1.05 1.04 Methylprednisolone P 82 4.9 78 6.2 0.78 N 7.94 3.60e) Metoprolol P 38 10 11 15 1.00d) B 15 13.5 Midazolam P 44 1 98 6.6 0.80d) N 8.25 8.17 Morphine P 24 4 35 24 0.95 B 25.22 15.20e) Naloxone P 2 0 30c) 22 1.22d) B 18.03 18.03 Nifedipine P 50 0 96 7 1.63 N 4.28 4.28 Nortriptyline P 51 2 92 7.2 1.50d) B 4.8 4.7 Ondansetron P 62 5 73 5.9 0.83d) B 7.11 6.75 Prazosin P 68 4 95 3 0.70d) N 4.29 4.11 Propranolol Bl 26 0.5 87 16 0.89d) B 16 14.80e) Quinidine P 80 18 87 4.7 0.88 B 5.31 4.36 Ranitidine P 52 69 15 10.4 1.03 B 10.11 3.14 Sildenafil P 38 0 96 6 0.99 N 6.04 6.04 Valproic acid P 100 1.8 93 0.14 0.64d) A 0.22 0.21 Zidovudine P 63 18 25 26 1.06 N 24.5 7.40e) Zolpidem P 72 1 92 4.5 0.76d) N 5.92 5.86 Values were collected in Goodman et al. (2006) except a) Ritschel (2000), b) Rowell et al. (1980), c) Garrett et al. (1985) and d) were in vitro value from Paixao et al. (2008). For data in e) CLH was determined according to Eq. (2). Values in f) were limited to 19.5 ml min−1 kg−1 .
- 6. Author's personal copy 314 P. Paixão et al. / European Journal of Pharmaceutical Sciences 39 (2010) 310–321 Table 3 In vivo pharmacokinetic data for the drugs not included in the train process and used to evaluate the ANN model applicability in estimating the in vivo CLint and CLH by the “well-stirred” model. P indicates data determined in plasma; Bl data determined in blood; F is the drug oral bioavailability; Frenal is the percentage of parent drug eliminated in urine; RB is the blood to plasma concentration ratio of the drug; Fp is the percentage of drug bound to plasma proteins; A acid, B basic, N neutral and Z zwitterionic drug and pH 7.4. CL F (%) Frenal (%) Fp (%) CLtotal RB Drug class CLblood CLH In silico predicted (ml min−1 kg−1 ) (ml min−1 kg−1 ) (ml min−1 kg−1 ) log CLint ( l/min/106 cells) Acyclovir P 30 75 15 6.19 1.08 N 5.75 1.44 0.53 Alendronate P 7 45 78 1.11 1.7 Z 0.65 0.36 −2.54 Alfentanil P – 1 92 6.7 0.63d) N 10.63 10.53 −0.14 Allopurinol P 53 12 2a) 9.9 1.09 N 9.11 8.02 −0.49 Alprazolam P 88 20 71 0.74 0.78d) N 0.95 0.76 0.49 Amikacin P – 98 4 1.3 0.97 B 1.34 0.03 −2.93 Amiodarona P 46 0 99.9 1.9 0.73d) B 2.6 2.6 1.08 Amitriptyline B 48 2 95 11.5 0.86d) B 11.5 10.40e) 0.93 Amlodipine P 74 10 93 5.9 1.2 B 4.91 4.42 −0.09 Amoxicillin P 93 86 18 2.6 1.04 A 2.51 0.35 −0.06 Aprepitant P 65 0 95 1.29 0.6 N 2.14 2.14 1.11 Atropine P – 57 18 8 0.99 B 8.12 3.49 0.16 Azathioprine P 60 2 30a) 57 1.05 N 54.23 8.00e) 1.07 Bupivacaine Bl – 2 95 7.1 0.73d) B 7.1 6.96 0.25 Buprenorphine P – 0 96 13.3 1 B 13.3 13.3 2.04 Buspirone P 3.9 0 95 28.3 0.62 B 45.99 19.22e) 0.35 Butorphanol P 17 1.9 80 40 1.9 B 21.03 16.60e) −1.12 Calcitriol P 61 10 99.9 0.43 0.55 N 0.78 0.7 −0.02 Candesartan P 42 52 99.8 0.37 0.55 A 0.67 0.32 0.53 Cefazolin P 90 80 89 0.95 0.56 A 1.7 0.34 0.44 Cefepime P – 80 18 1.8 0.74 A 2.43 0.49 −2.19 Cefixime P 47 41 67 1.3 0.62 A 2.11 1.25 −2.22 Ceftazidime P – 84 21 1.92 0.72 A 2.68 0.43 −1.54 Celecoxib P – 3 97 6.6 0.57 N 11.61 11.26 −0.44 Cephalexin P 90 91 14 4.3 1.02 A 4.21 0.38 0.27 Chlorthalidone Bl 64 65 75 0.04 0.73d) N 0.04 0.01 −0.42 Cinacalcet P 20 0 95 18 0.64 B 28.28 16.00e) 0.18 Ciprofloxacin P 60 50 40 7.6 1.07 Z 7.09 3.55 −0.37 Clindamycin P 87 13 93.6 4.7 0.76 B 6.15 2.60e) 1.11 Clonidine P 95 62 20 3.1 1.04 B 2.97 1.13 1.33 Cyclophosphamide P 74 6.5 13 1.3 1.06 N 1.22 1.14 −0.1 Dapsone P 93 15 73 0.6 1.04d) N 0.58 0.49 −2.85 Dicloxacillin P 50 60 95.8 1.6 0.55 A 2.89 1.16 1.66 Didanosine P 38 36 5 16 1.08 N 14.85 9.5 0.14 Docetaxel P – 2.1 94 22.6 0.55 N 40.93 19.50f) 2.12 Dofetilide P 96 52 64 5.23 0.72 B 7.3 3.5 −0.11 Doxycycline P 93 41 88 0.53 1.7 Z 0.31 0.18 −2.43 Entacapone P 42 0 98 10.3 0.55 A 18.66 11.60e) 0.87 Ethambutol P 77 79 18 8.6 0.96 B 8.98 1.89 0.31 Etoposide P 52 35 96 0.68 0.55 N 1.23 0.8 1.57 Fentanyl P – 8 84 13 0.97d) B 13.4 12.33 0.59 Finasteride P 63 1 90 2.3 0.56 N 4.12 4.08 0.91 Flecainide P 70 43 61 5.6 0.89 B 6.3 3.59 −0.23 Fluconazole P 90 75 11 0.27 1.06 N 0.26 0.06 −1.06 Flumazenil P 16 0.2 40 9.9 1.00d) N 9.9 9.88 1 Fluorouracil P 28 10 10 16 1.09d) N 14.62 13.16 1.51 Fluphenazine P 2.7 0 92b) 10 0.69 B 14.55 14.55 0.66 Foscarnet P 9 95 15 1.6 1.27 A 1.26 0.06 −2.91 Fulvestrant P – 1 99 9.3 1 N 9.3 9.21 0.64 Gabapentin P 60 66 3 1.6 1.1 Z 1.46 0.49 −0.36 Galantamine P 95 2 18 5.7 1.04 B 5.48 1.00e) −0.68 Ganciclovir P 4 91 1 3.4 1.08 N 3.16 0.28 −0.98 Gentamicin P – 90 10 1.52 1 B 1.52 0.15 −2.93 Glimepiride P 100 0.5 99.5 0.62 0.55 A 1.12 1.11 0.92 Glyburide P 90 0 99.8 1.3 0.56 A 2.34 2.34 0.65 Hydrochlorothiazide P 71 95 58 4.9 1.70d) N 2.88 0.14 0.17 Hydromorphone P 42 6 7.1 14.6 1.07 B 13.62 12.8 1.18 Imatinib P 98 5 95 3.3 0.64 B 5.17 0.40e) 1.19 Indomethacin P 100 15 90 1.4 0.56 A 2.51 2.14 1.36 Irbesartan P 70 2.2 90 2.12 0.64 Z 3.34 3.26 −0.28 Isosorbide dinitrate P 22 1 28 46 1 N 46.06 15.60e) 0.99 Isosorbide-5-mononitrate P 93 5 0 1.8 1.08 N 1.67 1.59 −1.01 Lamivudine P 86 50 36 4.95 1.06 N 4.67 2.33 0.41 Lansoprazole P 81 1 97 6.23 0.56 N 11.17 3.80e) −0.03 Letrozole P 99.9 3.9 60 0.58 0.92 N 0.63 0.61 0.12 Levetiracetam P 100 66 10 0.96 1.07 N 0.89 0.3 −0.63 Levofloxacin P 99 70 30 2.52 1.05 Z 2.41 0.72 1.36
- 7. Author's personal copy P. Paixão et al. / European Journal of Pharmaceutical Sciences 39 (2010) 310–321 315 Table 3 ( Continued ). CL F (%) Frenal (%) Fp (%) CLtotal RB Drug class CLblood CLH In silico predicted (ml min−1 kg−1 ) (ml min−1 kg−1 ) (ml min−1 kg−1 ) log CLint ( l/min/106 cells) Linezolid P 100 35 31 2.1 0.73 A 2.86 1.86 0.01 Losartan P 35.8 12 98.7 8.1 0.55 A 14.68 12.92 0.6 Meloxicam P 97 1 99.4 0.15 1.22 A 0.12 0.12 −0.3 Melphalan P 71 12 90 5.2 0.96d) Z 5.42 4.77 0.96 Meperidine P 52 5 58 17 0.87d) B 19.54 9.60e) 0.79 Mercaptopurine P 12 22 19 11 1.2 N 9.2 7.18 −2.71 Metformin P 52 99.9 0 7.62 1.04 B 7.33 0.01 −2.91 Methadone P 92 24 89 1.7 0.75d) B 2.27 1.60e) 0.85 Methotrexate P 70 81 46 2.1 0.71 A 2.94 0.56 −2.92 Metoclopramide P 76 20 40 6.2 0.96 B 6.44 4.80e) 0.96 Metronidazole P 99 10 11 1.3 1.07 N 1.21 1.09 0.75 Montelukast P 62 0 99 0.7 0.55 A 1.27 1.27 1.48 Moxifloxacin P 86 21.9 39.4 2.27 1.05 Z 2.16 1.69 0.76 Nalmefene P 40 9.6 34 15 1.11 B 13.54 12.24 0.99 Neostigmine P – 50 0a) 16.7 1.07 N 15.6 7.8 −1.14 Nitrofurantoin P 90 47 62 9.9 0.76d) A 13.03 2.00e) 1.22 Oxycodone P 42 19 45 12.4 1.03 B 12.04 9.75 1.59 Pancuronium P – 67 7 1.8 1.02 N 1.77 0.58 1.56 Phenobarbital P 100 24 51 0.06 0.86d) N 0.07 0.05 −0.55 Pravastatin P 18 47 45 13.5 0.55d) A 24.55 13.01 −1.02 Quetiapine P 9 1 83 19 0.9 B 21.11 18.20e) 1.14 Quinine P 76 16 90 0.9 0.91 B 0.99 0.83 0.49 Repaglinide P 56 1 97.4 9.3 0.55 A 16.85 8.80e) 0.8 Riluzole P 64 1 98 5.5 1.7 N 3.24 3.2 1.74 Risedronate P 1 87 24 1.5 1.07 A 1.4 0.18 −2.91 Risperidone P 66 3 89 5.4 0.67d) B 8.06 7.82 1.2 Rizatriptan P 47 28 14 12.3 1.04 B 11.85 8.53 0.24 Rocuronium P – 17 25 4.25 1 N 4.26 3.54 1.46 Ropivacaine P – 1 92 6.3 0.93 B 6.81 6.74 0.49 Sulfamethoxazole P 100 14 53 0.31 0.79 A 0.39 0.34 −0.96 Sumatriptan P 14 22 17.5 22 1.03 B 21.37 16.67 0.29 Tamsulosin P 100 12.7 99 0.62 0.55d) B 1.13 0.98 0.87 Tegaserod P 11 0 98 18 0.72 B 25.04 17.80e) −0.97 Tenofovir P 25 82 1 2.6 1.05 A 2.47 0.44 −2.75 Terazosin P 82 12.5 92 1.15 0.84 N 1.37 1.2 0.43 Tetracycline P 77 58 65 1.67 1.7 Z 0.98 0.41 −2.29 Timolol P 61 8 10 7.7 0.87 B 8.88 7.80e) 0.11 Tramadol P 70 20 20 8 1.03 B 7.75 6.2 0.34 Trazodone P 81 1 93 2.1 0.81 N 2.61 2.58 −0.24 Trimethoprim P 63 63 37 1.9 1.03 N 1.84 0.68 0.47 Valsartan P 23 29 95 0.49 0.55 A 0.89 0.63 0.42 Vecuronium P – 20 69 6.4 0.97 N 6.6 5.28 1.37 Vinorelbine P 27 11 87 21 0.58 B 36.34 14.60e) 2.11 Zaleplon P 31 1 60 15.7 0.99 N 15.84 13.80e) 0.55 Ziprasidone P 59 1 99.9 11.7 0.81 B 14.52 8.20e) 1.27 Values were collected in Goodman et al. (2006) except a) Ritschel (2000), b) Rowell et al. (1980), c) Garrett et al. (1985) and d) were in vitro value from Paixao et al. (2008). For data in e) CLH was determined according to Eq. (2). Values in f) were limited to 19.5 ml min−1 kg−1 . Some drugs may have other non-renal elimination routes with the previously determined in vivo CLH and the free frac- besides the hepatic one. In these cases, it is expected that CLH deter- tion of drug in blood (fB ) determined by the ratio between the mined by Eq. (1) would be overpredicted. To minimise this, in vivo free fraction of drug in plasma (FuP ) by the drug blood-to-plasma CLH was also determined by Eq. (2) (Iwatsubo et al., 1997), concentration ratio (RB ). Hepatocellularity was considered to be 107 × 106 cell/g liver (Wilson et al., 2003) and it was also assumed CLH = QH · (1 − Foral ) (2) that liver weighed 20 g/kg of body weight in order to scale the in This equation assumes that oral bioavailability (Foral ) is only a silico CLint values from unities of l/min/106 cells to ml min−1 kg−1 . result of the first pass-effect in the liver, allowing the determination of the liver extraction ratio (EH ) and the CLH by multiplying EH with 2.5. Statistical analysis the hepatic blood flow rate (QH ) with a value of 20 ml min−1 kg−1 . Although Eq. (2) could also provide overpredicted values for CLH , Correlation between the predicted and observed values was in theory these would be the maximum possible values for this determined by means of the Pearson correlation coefficient (r) for parameter. For this reason, when comparing CLH determined by the train and test groups for the log(CLint ) data. In order to assess Eq. (1) to the value obtained with Eq. (2), if the first is bigger the the precision and bias of the network, root mean squared prediction latter prevails. error (RMSE) and mean error (ME) were also estimated by using the The in vivo CLint values were determined by using the “well- following equations. stirred” liver model rearranged in Eq. (3), 2 QH · CLH CLint pred − CLint obs CLint = (3) RMSE = (4) fB · (QH − CLH ) N
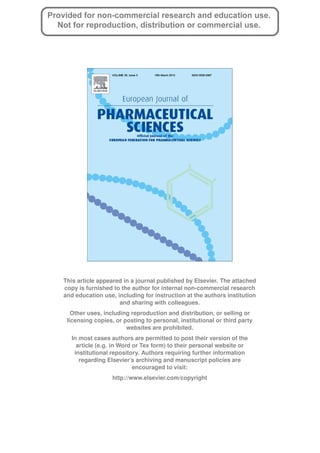
- 8. Author's personal copy 316 P. Paixão et al. / European Journal of Pharmaceutical Sciences 39 (2010) 310–321 Table 4 Summary of the 21 molecular descriptors used in the ANN model. Molecular descriptor Description Molecular descriptor Description AMW Average molecular weight PJI2 2D Petitjean Shape Index BAC Balaban Centric Index PW3 Randic Shape Index Path/Walk 3 Gm G Total Symmetry Index weighted by atomic masses PW5 Randic Shape Index Path/Walk 3 HNar Narumi Harmonic Topological Index Ram Ramification Index Hy Hydrophilic factor RBN Number of rotable bonds IC4 Information Content Index (neighborhood symmetry of 4-order) SIC2 Structural information content (neighborhood symmetry of 2-order) log P Oil:water partitioning coefficient SPI Superpendentic Index Me Mean atomic sanderson electronegativity (scaled on carbon atom) TI1 Second Mohar Index Ms Mean electrotopological state Tot Fn Fraction of neutral drug MSD Mean Square Distance Index TPSA (NO) Topological polar surface area (No) nCIR Number of circuits Detailed information of the presented molecular descriptors may be obtained in Todeschini and Consonni (2000). CLint pred − CLint obs ME = (5) N Percentage of correct values within a 2-fold error (difference of log predicted to log observed values outside the interval −0.3 to 0.3) was determined in order to assess the quantitative ability of the network. Additionally, percentage of correct values within a 10-fold error (difference of log predicted to log observed values outside the interval −1 to 1) was also determined in order to assess the qualitative ability of the network. 3. Results 3.1. ANN model building Optimization of the ANN model was made as described under methods. Regarding the reduction of the molecular descriptors space, the removal of correlated descriptors reduced the number of descriptors to 92. The next two procedures were preformed using Fig. 1. Plot of the in vitro observed vs in silico predicted log(CLint ) values for the ANN model. Solid line represents the line of unity and the dashed lines the ±1 log an ANN with 3 hidden neurons in 1 hidden layer. This ANN struc- tolerance value. Closed marks represent drugs that were included in the train set. ture was chosen as a compromise between simplicity, in order to Open marks are indicative of drugs in the test set. Cross marks represent drugs in avoid over parameterization and memorization, and complexity to the external validation group. allow an adequate learning ability of the network. To escape local minima each network was run 20 times with random initial val- ues and learning was early-stopped based on the degradation of was constructed with the 21 molecular descriptors presented in test RMS error to avoid memorization. After 20 runs, the network Table 4. Based on these descriptors, a network architecture opti- with the lower average test RMS error was kept, and the relative mization was pursued using a brute force approach. In order to contribution of each input on the log(CLint ) prediction was estab- maintain a practical computational time, the network architectural lished using the “input node interrogator” option in QNet. In this space was swept between 1 to 3 hidden layers and 1 to 5 hid- option, inputs contribution are determined by cycling each input den neurons by layer. Additionally, the ratio between the number for all training patterns and computing the effect on the network’s of patterns to the number of connections was maintained above output response. Of the 92 non-correlated descriptors, 43 were 1 in order to reduce the ability of the network to memorise the considered non-relevant, since their input contribution was equal data and avoid overfitting (So and Richards, 1992; Turner et al., or inferior to a random input and were also removed. Finally, by 2004). the pruning procedure described under methods, it was consid- The best neural network presented an architecture of 21-3-2-2- ered that 21 molecular descriptors were needed to characterise 1 and its performance is presented in Table 5 and Fig. 1. The model the output response, as a degradation of the test RMS error was produced good correlations both in the training and test groups. observed when further removals were undertaken. The final model Additional statistical comparison of the ANN for the training and Table 5 Statistical evaluation of the performance of the ANN model to predict in vitro CLint values based on the molecular descriptors for the train and test data. RMSE ME Correlation % Within 10-fold difference % Within 2-fold difference Train 0.236 −0.001 0.953 100 79 Test 0.544 −0.173 0.804 91 53 Validation 0.747 −0.233 0.315 80 0
- 9. Author's personal copy P. Paixão et al. / European Journal of Pharmaceutical Sciences 39 (2010) 310–321 317 Table 6 Statistical comparison between the use of in vitro data and the ANN model to predict in vivo CLint values. In vivo CLint values were determined by using the “well-stirred” model either considering blood binding for all drug classes or just to acid drugs. Group A consisted of 30 drugs from Table 2 with in vitro CLint data that were used in the training process of the ANN model. Group B includes the 112 drugs from Table 3 for which only in silico CLint were used. Data set RMSE ME Correlation % Within 10-fold difference % Within 2-fold difference fB in all drugs Group A (in vitro) 1.042 −0.838 0.636 57 16 Group B (in silico) 1.450 −0.748 0.527 56 19 fB in acids Group A (in vitro) 0.643 −0.073 0.579 93 52 Group B (in silico) 1.197 −0.249 0.508 63 16 test groups revealed a similar behaviour, either in RMSE (precision reliable in vivo intrinsic clearances, all drugs with the following of the predicted values) and ME (bias in the predicted values), indi- characteristics were removed prior to analysis: CL/F determina- cating that overfitting was not significant. Similar values were also tion, CL with high variability, liposomal formulations, isomers with obtained when considering the quantitative and qualitative abil- different pharmacokinetics, known metabolization by multiple ity of the network. An Y-scrambling analysis was also performed, organs, CL data obtained in cancer patients, non-linear elimination by randomly permuting the output values in the training data pharmacokinetics, pro-drug data, re-conversion of the metabolite, set, and no statistically significant models were achieved (Fig. 2), endogenous substances, unreliable pharmacokinetic data or due to indicating that the occurrence of chance correlations was not impossibility to calculate all the required molecular descriptors. present. This was done because these facts would impair the correct quan- Evaluation of the ANN performance in the external validation tification of in vivo CLint . The remaining 142 drugs included 30 drugs group of 5 drugs provided similar RMSE and ME when compared (Table 2) presented in the ANN optimization process, used to estab- to the test group of data (Table 5). Correlation was not so evident lish the ability of the in vitro hepatocytes suspension to predict the but, considering the data range of the external validation group in vivo CLint determined by “well-stirred” model and the human (0.23–1.51 log CLinf values) and the RMSE, the obtained value is still in vivo CLH values. This was done by comparing the in vitro values acceptable. None of the drugs were predicted within the 2-fold dif- in this group to the in vivo determined values. The remaining 112 ference, but only marginally in the case of 4-methylumbelliferone. drugs (Table 3), for which only in silico predictions were available, When considering the within 10-fold difference acceptance inter- were used to evaluate the prediction ability of the ANN model by val, 4 of the drugs were correctly predicted. In the original work itself. (Jacobson et al., 2007), the CLint value for Irbesartan was not The in vivo CLint values used in the validation process were cal- able to predict CLH within a reasonable limit. Because of this, we culated by Eq. (3) as described in methods. Since some authors removed this drug from the external validation group and found pointed out a better correlation when drug binding is consid- that it significantly improved the group statistics to a RMSE = 0.635, ered only in acidic drugs at pH 7.4, the in vivo values were ME = −0.020, r = 0.467 and 100% drugs within the 10-fold error dif- also calculated by considering fB equal to 1 for the remaining ference. classes of drugs. Statistical performance of these two approaches is presented in Table 6 and Fig. 3. When considering drug bind- 3.2. Model applicability ing (Fig. 3a), a significant correlation is obtained, but both the in vitro and in silico values resulted in underpredictions. A low Pharmacokinetics for a total of 290 drug molecules is described precision is observed, with only 19% of the in silico estimations in Goodman et al. (2006). In order to include only drugs with and 16% of the in vitro estimations within a 2-fold difference of the in vivo observed value, indicating a poor ability to quantita- tively estimate this parameter. In the situation that drug binding is neglected for basic, neutral and zwitterionic drugs (Fig. 3b), a significant correlation is also obtained. A smaller underpredic- tion is observed but again only 16% of the in silico determined drugs in the group B are predicted within a 2-fold difference of the in vivo observed value. For the in vitro data, however, a sig- nificant improvement in prediction was observed with 52% of the predictions within a 2-fold difference of the in vivo observed value. When considering a 10-fold difference, the prediction ability is considerably increased in all situations, indicating that the ANN model may be used to qualitatively predict the in vivo CLH . In order to test this hypothesis, both the in vitro and the in silico CLint val- ues were used to predict the in vivo CLH by using the “well-stirred” model of the liver (Fig. 4). Again, drug binding was either considered to all drugs or just to acidic drugs as previously. A successful match was considered when the predicted value is not different from the observed one within a ±4 ml min−1 kg−1 , assuming also a 50% error Fig. 2. Evaluation of the occurrence of chance correlations by a y-randomization in the in silico CLint value. When drug binding is considered, 67% of test. Open mark indicates the real data performance. Close marks indicates the the in vitro based predictions and 69% of the in silico based predic- model performance when the in vitro CLint values in the train data set were randomly permuted in their position. tion are correctly predicted (Fig. 4a). When drug binding is applied
- 10. Author's personal copy 318 P. Paixão et al. / European Journal of Pharmaceutical Sciences 39 (2010) 310–321 Fig. 3. Plot of the in vivo observed vs in vitro and in silico predicted log(CLint ) values for the ANN model in unities of ml min−1 kg−1 . Solid line represents the line of unity Fig. 4. Plot of the in vitro and in silico predicted log(CLint ) vs in vivo observed CLH and the dashed lines the ±1 log tolerance value. Open marks are indicative of drugs values for the ANN model. Solid line represents the predicted CLH values based in from Table 2 with in vitro CLint data. Closed marks represent drugs from Table 3 with the introduction of the in vitro and in silico CLint values in the “well-stirred” model in silico CLint data. The in vivo observed values were determined by the “well-stirred” considering fB in all drugs (A) or only in acid drugs (B). The dashed lines represent model based on the in vivo CLH and including fB in all drugs (A) or considering fB the tolerance interval. In vivo observed CLH are represented by open circles for the only in acid drugs (B). Table 2 drugs were in vitro CLint data was used. Closed circles are used for Table 3 drugs were in silico CLint data was used. The closer a mark is to the solid line the better the prediction. to acidic drugs only, 97% of the in vitro based predictions and 72% of the in silico based prediction are within the acceptance limits opreservation protocols, an increased pool of liver sources is now (Fig. 4b). available, with a minimal loss of metabolic activity (Blanchard et al., 2005; Griffin and Houston, 2004; McGinnity et al., 2004; Naritomi 4. Discussion et al., 2003). Due to these facts, it appears to be the most promising tool to predict CLH in the development phase of new drug entities 4.1. Model development (Fagerholm, 2007) making it also an ideal target for QSAR mod- els. To our knowledge, this is the first attempt to model in silico the This ANN model was trained based in a data set of 71 differ- CLint obtained in suspensions of human hepatocytes. Previous in ent drugs, with data from different laboratories. Although similar silico works were done based on in vitro microssomes (Chang et al., experimental conditions were considered, some intra-drug vari- 2008; Ekins, 2003; Ekins and Obach, 2000; Lee et al., 2007; Li et al., ability was observed between laboratories, as observed previously 2008), combining in vitro and in vivo data (Schneider et al., 1999; (Nagilla et al., 2006). This variability may have a physiologic mean- Zuegge et al., 2001), in vitro and in silico data (Jolivette and Ward, ing (Shibata et al., 2002), and was introduced in the model by 2005; Wajima et al., 2002) and relating in silico with human in vivo including all individual determinations with a weighting related to pharmacokinetics (Li et al., 2008; Turner et al., 2004). the number of different determinations per drug. ANN models are CLint as determined by using suspensions of isolated hepato- prone to overfitting problems. In order to reduce this possibility, we cytes presents advantages over other in vitro methods. Hepatocytes used an early stop procedure, a frequently used approach to mini- are intact cells with a complete set of phase I and II metabo- mize data memorization (Cataltepe et al., 1999), with a test group lizing enzymes that mimic the in vivo metabolization of drugs of 18 drugs. Additionally, the ratio between the number of patterns (Gomez-Lechon et al., 2003). With the optimization of the cry- to the number of connections was maintained above 1 as this could
- 11. Author's personal copy P. Paixão et al. / European Journal of Pharmaceutical Sciences 39 (2010) 310–321 319 Fig. 5. Relevance of each molecular descriptor in the prediction of CLint by the ANN, obtained by cycling each input for all training patterns and computing the effect on the network’s output response at a time. also reduce the ability of the model to memorise the data (Turner PW5 is a molecular shape descriptor and is related to transport phe- et al., 2004). Comparison of the model performance in the train and nomena and interaction capabilities between ligands and receptors test groups resulted in similar statistics which indicates that net- (Todeschini and Consonni, 2000). work training was stopped before overfitting did occur. Evaluation of the model performance in the external validation group of data is 4.3. Model applicability also indicative of the model’s predictive abilities, and an indication that it may be used to predict the CLint value in new drugs. The applicability of the proposed model was evaluated by test- ing the ability of the ANN model to predict the in vivo intrinsic 4.2. Model inputs clearance with the latter being estimated based on the pharma- cokinetic values of the drugs. Different classes of drugs with a broad Interpretation of the relationships between the input and out- range of CLH values were included but, since extrahepatic CL is put variables are difficult to make when using ANN models. One neglected, there is a possibility of overestimation when estimat- possible approach is to evaluate the relevance of each input on ing the CLH . Use of known drugs with reliable intravenous data and the final output by cycling each input for all training patterns and comparison with the EH estimated by bioavailability may reduce computing the effect on the network’s output response. The per- this effect when extremely evident. cent contribution of the input descriptors for the output response The liver model may also influence the estimation of CLint , is presented in Fig. 5. As can be seen, the molecular descriptors especially in high CL drugs (Houston and Carlile, 1997) and the encode information related to electronic (Ms, Me, Ram, TPSA(NO), “dispersion” and “parallel tube” models usually present the best RBN), physical-chemical properties (Hy, log P, Tot Fn), branching, results (Iwatsubo et al., 1997). However, due to its simplicity and compactness and symmetry (SPI, HNar, SIC2, BAC, Gm, IC4, MSD, minor differences in the prediction on in vivo CLH , the use of the TI1), size and shape (AMW, PJI2, PW3, PW5) and aromaticity (nCIR) “well-stirred” model is still often recommended (Ito and Houston, (Todeschini and Consonni, 2000). The top relevant descriptors also 2004). Use of fB is also a question of debate. Neglecting this param- indicate the significance of structural considerations at an atomic eter in basic, zwitterionic and neutral drugs seems to improve CLH and molecular level in determining the metabolic behaviour of estimations both when using microsomes (Obach, 1999) or hepato- a compound. Ram is a -electron descriptor and a measure of cytes suspensions (Jacobson et al., 2007; Lau et al., 2002; McGinnity atom connectedness for acyclic graphs within the molecule (Araujo et al., 2004; Reddy et al., 2005). and De la Pena, 1998). Hy is an empirical index related to the We tested the predictive ability of the ANN model either by hydrophilicity of the compounds. TPSA(NO) is a descriptor related using fB in all classes of drugs or just in acidic drugs using the to the hydrogen-bonding ability of compounds and has been pre- “well-stirred” model. Similar correlations were observed when viously used to predict membrane permeability (Linnankoski et al., comparing both the in vitro and the in silico predictions with the in 2006; Zhao et al., 2007). SPI is a molecular descriptor derived from vivo CLint observed values either using fB to all drugs or just for acids, the H-depleted molecular graph proposed to enhance the role of and comparable to previously observed values for in vitro–in vivo terminal vertices in QSAR studies and it has been used to predict extrapolations (McGinnity et al., 2004). It has also been proposed to the antiulcer activity in a set of 128 molecules (Gupta et al., 1999). evaluate the performance of a method by determining the percent- MSD and BAC are molecular descriptors known to be related to the ages of predicted values below a 2-fold error (Obach et al., 1997). branching in a structure (Caputo and Cook, 1989). nCIR counts the When applied to CLint data our results were unsatisfactory either number of walks with non-repeated paths in the graph represen- using the in vitro or the in silico predicted values (Table 6). These tation of the molecule. It is a direct indication of cycle structures in values were, however, in accordance with previously described the molecule. SIC2 is a topological information index representing values for in vitro–in vivo extrapolation with human hepatocytes a measure of the structural complexity. Ms is a measure of the aver- (Naritomi et al., 2003; Riley et al., 2005) and reasons for this age electronic accessibility of the atoms in the molecule and can be lack of prediction may be either lower activity of the hepatocytes interpreted as a probability of interaction with another molecule. after cryopreservation or inappropriate in vivo CLint estimation