GDT Q3 2016
•
3 recomendaciones•277 vistas

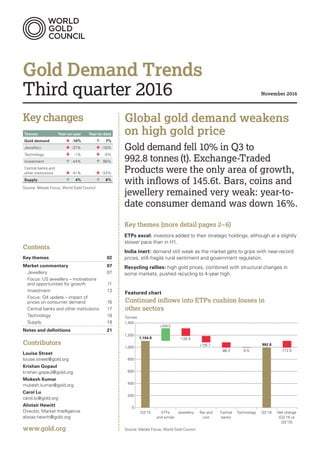
Global gold demand fell 10% in Q3 to 992.8 tonnes due to weakness in bars, coins and jewelry as consumer demand was down 16% year-to-date. Exchange-traded products were the only area of growth, with inflows of 145.6 tonnes as investors continued adding to their strategic holdings. Recycling of gold increased 30% to 340.9 tonnes in Q3, reaching a 4-year high due to high gold prices and structural changes in some markets like India, where demand remained weak and the local price fell to a large discount against the international price.

Recomendados
Más contenido relacionado
La actualidad más candente
La actualidad más candente (20)
Destacado
Destacado (20)
Similar a GDT Q3 2016
Similar a GDT Q3 2016 (20)
Más de World Gold Council
Más de World Gold Council (20)
Último
Último (20)
GDT Q3 2016
- 1. Gold Demand Trends Third quarter 2016 November 2016 Global gold demand weakens on high gold price Gold demand fell 10% in Q3 to 992.8 tonnes (t). Exchange-Traded Products were the only area of growth, with inflows of 145.6t. Bars, coins and jewellery remained very weak: year-to- date consumer demand was down 16%. Key themes (more detail pages 2–6) ETPs excel: investors added to their strategic holdings, although at a slightly slower pace than in H1. India inert: demand still weak as the market gets to grips with near-record prices, still-fragile rural sentiment and government regulation. Recycling rallies: high gold prices, combined with structural changes in some markets, pushed recycling to 4-year high. Featured chart Continued inflows into ETPs cushion losses in other sectors +209.0 -128.5 +105.7 -86.3 -0.5 -112.0 0 200 400 600 800 1,000 1,200 1,400 Q3’15 Jewellery Bar and coin TechnologyCentral banks Q3’16 Net change (Q3’16 vs Q3’15) ETFs and similar Source: Metals Focus; World Gold Council Tonnes Continued inflows into physically-backed gold ETPs bucked the trend 1,104.8 992.8 Tonnes Year-on-year Year-to-date Gold demand -10% 7% Jewellery -21% -18% Technology -1% -5% Investment 44% 98% Central banks and other institutions -51% -33% Supply 4% 8% Source: Metals Focus; World Gold Council Keychanges Contents Key themes 02 Market commentary 07 Jewellery 07 Focus: US jewellery – motivations and opportunities for growth 11 Investment 13 Focus: Q4 update – impact of prices on consumer demand 16 Central banks and other institutions 17 Technology 18 Supply 19 Notes and definitions 21 Contributors Louise Street louise.street@gold.org Krishan Gopaul krishan.gopaul@gold.org Mukesh Kumar mukesh.kumar@gold.org Carol Lu carol.lu@gold.org Alistair Hewitt Director, Market Intelligence alistair.hewitt@gold.org www.gold.org
- 2. 02Gold Demand Trends | Third quarter 2016 Key themes Motives for investing in gold-backed ETPs remain intact ETPs were the only bright spot for gold demand in Q3. The focus shifted from the US as European ETPs drove the inflows. 1 Year-to-date figures throughout the report refer to data to end-September. Investors continued to build up their strategic allocations to gold via ETPs: Q3 was the third successive quarter of hefty growth, albeit that the pace of inflows slowed slightly from the stellar first-half. The net addition of 145.6t took total AUM in these products to 2,335.6t, the highest since April 2013. Year-to-date1 inflows sum to 725t – far exceeding the cumulative 616t of outflows from the preceding 10 quarters and worth a value of US$64.5bn. Table 1: Data highlights for Q3 2016 demand (see Gold demand statistics for full details) Tonnes US$mn Q3’15 Q3’16 5-year average Year-on- year change Q3’15 Q3 ’16 5-year average Year-on- year change Demand Gold demand 1,104.8 992.8 1,120.5 -10% 39,934.9 42,603.9 50,532.9 7% Jewellery 621.6 493.1 580.1 -21% 22,469.7 21,161.3 25,814.7 -6% Technology 82.8 82.4 88.9 -1% 2,994.5 3,534.0 4,024.2 18% Investment 232.4 335.7 311.4 44% 8,399.2 14,404.2 14,399.7 71% Total bar and coin 295.8 190.1 316.8 -36% 10,690.7 8,156.8 14,485.1 -24% ETFs and similar products -63.4 145.6 -5.4 - - -2,291.5 6,247.4 -85.4 - - Central banks and other institutions 168.0 81.7 140.1 -51% 6,071.4 3,504.3 6,294.2 -42% Consumer demand in selected markets India 271.2 194.8 209.8 -28% 9,802.4 8,358.8 9,465.0 -15% China 233.8 182.5 252.2 -22% 8,451.3 7,830.8 11,252.5 -7% Middle East 68.1 44.0 77.1 -35% 2,462.7 1,888.0 3,464.1 -23% United States 57.3 43.6 45.8 -24% 2,069.4 1,871.2 2,047.8 -10% Europe ex CIS 72.9 50.3 80.6 -31% 2,634.9 2,157.3 3,659.5 -18% Supply Total supply 1,127.2 1,172.7 1,116.6 4% 40,745.1 50,325.0 50,065.0 24% Total mine supply 865.6 831.8 775.0 -4% 31,290.4 35,696.6 34,385.9 14% Recycled gold 261.6 340.9 341.6 30% 9,454.8 14,628.4 15,679.1 55% Gold price LBMA Gold Price (US$/oz) 1,124.3 1,334.8 - 19% - - - - Source: Metals Focus; GFMS, Thomson Reuters; ICE Benchmark Administration; World Gold Council
- 3. 03Gold Demand Trends | Third quarter 2016 In a continuation of the pattern we have seen over recent months, investment seems to have been driven primarily by strategic motives suggesting that these are intended to be long-term positions. Field research has revealed that institutional investors with no previous history of investing in gold are increasingly seeking to initiate sizable positions in these products, alongside those who have been re- opening positions that were closed out during the 2013–15 run-down in the gold price. The fact that inflows into these products continued in October despite the gold price falling by 10% early in the month, further highlights that a good part of ETF investment is driven by strategic motives rather than price momentum. And the factors underpinning this investment were constant. Negative interest rate policies (NIRP) – and the general environment of historically low nominal and real interest rates – remains a primary factor driving these investment flows. Political uncertainty is also a key influence, not just because of the US Presidential election – which has supported inflows into North American ETPs this year – but increasingly in Europe, where – in the wake of the Brexit referendum decision – 2017 brings the prospect of elections in France, Germany, the Netherlands and, possibly, Italy. Unsurprisingly, given this backdrop, the geographical focus of demand shifted. After US-based ETPs led the influx over the first half of the year, European investors picked up the baton in the third quarter: 78% of the inflows into ETPs were in European-based products (Chart 1). Elsewhere, Chinese investors added another 10t to their holdings of domestic products, equivalent to 39% growth, on top of the 287% increase in H1. • Having accounted for just 33% of inflows into ETPs during the first half of 2016, European funds sucked in 78% of the 145.6t of inflows in Q3. • Although AUM in Chinese ETPs remain small in absolute terms, Q3 was another quarter of remarkable growth as improved accessibility to these products encouraged smaller-scale domestic investors. Physically-backed gold ETPs increased by 725t in the first nine-months of 2016, bringing total holdings standing to more than 2,300t (US$99.3bn) at the end of September. -50 0 50 100 150 200 250 Tonnes US$bn 0 20 40 60 80 100 120 January February March April May June July August September North America Europe Asia Other Total AuM (US$bn, rhs) Source: Respective ETP providers; Bloomberg; ICE Benchmark Administration; World Gold Council Chart 1: Inflows into European physically-backed gold ETPs dominated Q3
- 4. 04Gold Demand Trends | Third quarter 2016 India’s tough transition to transparency Indian consumers continue to face challenges – most pressingly, the government’s drive for transparency and accountability. After a difficult H1 for India’s gold market, the third quarter continued in much the same vein. Consumer demand has sunk to multi-year lows due to a combination of: • high and volatile gold prices; • fragile sentiment among the rural population; • and government regulation. Local gold prices in the range of Rs30,000–31,000/10g were a deterrent to gold consumers, having last been at such lofty levels in 2013. And greater price volatility, as much as the price level itself, weighed on demand. Indian consumers will gradually adapt to higher prices – we have seen this many times before – but price volatility combined with higher prices is a damaging combination. As well as having higher prices to adapt to, the rural population in India has been plagued by lower disposable incomes in recent years. While this year’s healthy monsoon should be positive for demand among this crucial gold-buying demographic, they are struggling to get their incomes back on track after the two preceding years of poor monsoon rainfall. And rural inflation continues to run above urban inflation, further squeezing household incomes. But perhaps the biggest factor affecting demand is the continued push towards regulation and accountability that the government is levelling at India’s economy in general, including the gold market. Various government measures have been implemented over recent months, in an attempt to regulate and formalise the gold industry. As discussed in Gold Demand Trends, Second quarter 2016, the government has levied a 1% excise duty on gold jewellery manufacturing and made PAN (Permanent Account Number) cards compulsory for jewellery purchases above Rs200,000.2 In addition, it is clamping down on undeclared income, which often fuels cash-based transactions, and working towards mandatory hallmarking legislation to standardise gold jewellery. 2 A Permanent Account Number card is a ten-digit unique alphanumeric number. The number is issued by the Income Tax Department and acts as a unique identifier, which enables it to link all transactions of the PAN card holder. • Indian consumers were notable by their absence in Q3; local gold prices dropped to a sizable discount below the international price. • A combination of high and fluctuating prices, a continued squeeze on rural incomes and increased regulation made for challenging market conditions. • Prices have returned to a small premium in October, thanks to a recovery in demand, which bodes for a more positive end to 2016. Chart 2: Local Indian gold price fell to hefty discount in Q3 as demand slumped Source: ICE Benchmark Administration; Multi Commodity Exchange of India; World Gold Council 0 -60 -50 -40 -30 -20 -10 10 20 June 2015 October 2015 February 2016 June 2016 October 2016 The local price moved to a premium as the seasonally-strong fourth quarter began. The discount widened out to a record of US$53/oz in July. US$/oz
- 5. 05Gold Demand Trends | Third quarter 2016 The intended long-term end-result of these measures is to improve transparency and accountability, which should promote a shift to an increasingly ‘organised’ gold industry. But such progress is rarely painless. The immediate effect of these new measures has been to unsettle both consumers and industry participants across the supply chain. Consequently, activity has been disrupted while they adapt to the new rules or look for ways to circumvent them, which has given rise to a surge in smuggling – up 12% year-to-date. As a result of India’s demand crunch, the local price was persistently at a hefty discount to the international price for the duration of the quarter (Chart 2). Indeed, the discount widened out to a record US$53 in July, indicative of very quiet market conditions. And imports slumped: doré imports fell by a whopping 86% as the extent of the discount made importing it uneconomical for refiners. During October however, the local price moved into a premium as demand picked up. The fall in the gold price ahead of the onset of the key festive buying season has seen India’s fourth quarter get off to a good start. Recycling reaches a multi-year high High gold prices – and structural factors in India – drew out significant flows of recycled gold. Some gold consumers aren’t shy in selling a portion of their gold holdings when advantageous to do so, often responding to near-term price movements.3 And the substantial increase in the gold price witnessed so far in 2016 has proven too enticing for some. The elevated levels of gold recycling seen in the first half of the year continued throughout the third quarter. Recycled gold amounted to 340.9t in Q3, surging 30% higher than the same period last year (261.6t) (Chart 3). Year-to-date, recycling has added 1,042.3t to annual supply, compared to 882.7t between Q1– Q3 2015 (+18%). 3 Changes in the gold price has an immediate but temporary effect on recycling. For more, please see The Boston Consulting Group and World Gold Council, The Ups and Downs of Gold Recycling, March 2015. • Consumers in the more price-sensitive markets were the driving force behind the 30% surge in supplies of recycled gold in Q3. • Supply from this source has accounted for 30% of supply in 2016 so far. • But recycling activity is likely to contract in response to gold’s recent price dip. Chart 3: Recycling remains elevated, accounts for greater share of total supply Recycled gold % share of total supply (rhs) Source: Metals Focus; GFMS, Thomson Reuters; World Gold Council 0 50 100 150 200 250 300 350 400 450 500 Tonnes % share 15 20 25 30 35 40 45 Q1’10 Q1’11 Q1’12 Q1’13 Q1’14 Q1’15 Q1’16 Rising gold prices – as well as structural factors in India – have boosted recycled gold to its highest level in 4 years.
- 6. 06Gold Demand Trends | Third quarter 2016 As discussed in Gold Demand Trends, Second quarter 2016, this is a somewhat predictable pattern. Empirical evidence – gleaned through both regression analysis and direct consumer research – shows that price is a primary driver of recycling amongst consumers.4 With the local gold price hitting new highs in some currencies, it would be unusual not to see this type of response from consumers, who – in markets where recycling is most prevalent – are often keenly aware of the gold price. India is a very good example of the increase in recycling. With local gold prices in the vicinity of Rs31,000/10g during the first half of the quarter, Indian consumers – particularly in rural areas – opted to cash in, swelling the supply of recycled gold to 39t, its highest level since Q4 2012. This boost to local supply enabled some jewellers to reduce their reliance on fresh imports to satisfy demand. One such example of this is Muthoot Pappachan Group’s Swarnavarsham Scheme.5 Over the past 18 months, Muthoot has reportedly collected about 200kg of gold through its nine recycling centres, which has been used to meet gold demand from consumers with lower incomes. As the price started to soften towards the end of August, the supply of recycled gold tapered as Indian consumers anticipated that higher prices would be brought on by the festival and wedding season. With the onset of Raksha Bandhan and Janmashtami6 (both auspicious festivals) towards the end of the third quarter, consumers opted to postpone further recycling of gold. The price response was even more marked in China, where volumes of gold recycling have ballooned in recent quarters. Year-to-date, the supply of recycled gold is 45% higher than the comparative period of 2015 (123.5t vs 85t). In early July, the local gold price reached the highest level for three years, sending a strong signal to consumers to sell their holdings of gold. Continued economic deceleration, listless stock markets and a squeeze on disposable incomes provided added context to this recycling surge. As consumers faced increasing pressure on their income and limited opportunity for returns from other traditional avenues of investment, they found it hard to resist the lure of selling gold at higher prices. Other markets also contributed to the gold recycling rush, Indonesia being an interesting example. The country introduced a tax amnesty at the beginning of Q3, which led some to cash in their holdings of gold at higher prices. The scheme may encourage investment in gold over the coming quarters, as it is one of the permitted investments for funds declared under the scheme. 4 World Gold Council, Gold Demand Trends, Second quarter 2016, August 2016. 5 The Swarnvarsham Scheme – launched in May 2013 – is targeted at consumers in low income groups, allowing them to buy gold in the range of 1.5–9 grams with equated monthly instalment (EMI) purchase option of daily, weekly or monthly instalments. 6 This year Raksha Bandhan and Janmashtami fell on 18 August and 25 August respectively.
- 7. 07Gold Demand Trends | Third quarter 2016 Jewellery Jewellery remained subdued in the face of persistently high gold prices; fourth quarter holds better prospects. Market commentary Gold jewellery demand in Q3 fell 21% year-on-year to 493.1t. This was the largest decline since Q2 2014 and the lowest third quarter for jewellery demand since 2011 – a time when average gold prices were some 28% higher than recent levels. Year-to-date jewellery demand is 18% down on last year: 1,423.6t vs 1,732.7t. This is the lowest Q1–Q3 total since 2009. Tonnes Q3’15 Q3’16 Year-on -year change Year-to -date change World total 621.6 493.1 -21% -18% India 214.1 154.7 -28% -30% China 180.6 141.5 -22% -18% High prices were the key reason for continued weakness in the jewellery sector, which has been severely depressed throughout 2016 so far (Chart 4). Barring just three or four very minor exceptions, jewellery demand fell in every consumer market that we track. Looking ahead, the fourth quarter – having started on a stronger footing – should see a recovery in the jewellery sector. The October drop in the gold price was fortuitously timed. The approach of key buying occasions, such as: the festival and wedding season in India; the main holiday season in Western markets; and Chinese New Year, make consumers in these markets more alert to lower prices. But that is not to say that we expect a clear revival. Pressures remain. Government policy in India is disruptive to the market, at least in the short term. Chinese consumers are exhibiting changing tastes. The consumer environment in European markets and the US remains hesitant. And while troubles continue to beset the Middle Eastern markets, demand across the region will suffer. • The gold price consolidated in Q3, after its strongest H1 performance for 36 years. • Persistently high prices discouraged consumers around the globe, a fact that was mirrored in the sharp rise in recycling. • Sterling-based prices were the exception, given weakness in that currency following the referendum decision for Britain to leave the EU. 95 100 105 110 115 120 125 130 135 140 145 150 155 US dollar Euro Pound sterling Indian rupee Chinese renminbi Turkish lira Chart 4: Gold’s upward momentum paused in Q3 (index 100 = 01/01/2016) Source: ICE Benchmark Administration; Datastream; World Gold Council January 2016 March 2016 May 2016 July 2016 September 2016 Index level The sharp increase in the gold price in 2016 has knocked jewellery demand.
- 8. 08Gold Demand Trends | Third quarter 2016 India takes a smaller share of a diminished jewellery market As discussed in Key themes, jewellery demand in India was again soft due to higher and volatile prices of gold (the corollary of which was a jump in recycling activity) and government regulation curtailing unaccounted income. Demand dropped by almost a third to 154.7t. The persistent weakness in this market in recent quarters means that India’s share of total jewellery demand has shrunk from 28% in Q1–Q3 2015 to 24% year-to-date. India has taken a smaller slice from a smaller pie. Rural indian consumers were hesitant, but indications for this sector are encouraging Although demand among the rural population was softer than may have been expected, given the improved monsoon rainfall this year, it was relatively resilient compared with demand in urban areas. Partly, this is due to the typically smaller transaction size made by rural consumers, making them less likely to meet the requirement for PAN cards, which has severely hampered urban demand. And signs of continued recovery in this sector of the population can be gleaned from looking at indicators such as sales of tractors. Mahindra and Mahindra (India’s leading tractor manufacturer) reported a 37.4% increase in domestic tractor sales compared to Q3 2015, growing by a whopping 70.3% in September. Rajesh Jejurikar, President and Chief Executive of Mahindra Mahindra’s Farm Equipment and Two-Wheeler Division, commented that, “In September 2016 we had a strong growth of 70% over September 2015, with sales of 29,035 tractors in the domestic market. We expect the good momentum to continue with the upcoming festive season and the effect of a good monsoon.”7 Higher Kharif 8 output will bolster rural income in the coming quarters The monsoon rains were well distributed and about 85% of the country’s geographical area received normal or excess rains this year. Estimates are for a 7–8% increase in Kharif foodgrain output in 2016, which will generate additional income for the rural sector to divert to gold in the coming quarters.9 China’s appetite for gold slipped further in the third quarter of 2016 on high prices and changing consumer behaviour Demand for gold jewellery in China fell by more than 20% to a four-year low as gold prices reached the highest level since 2013. The decline was further reinforced by the high base effect from the mini-boom in Q3 2015, spurred by currency depreciation. Chinese consumers stayed side- lined and retailers postponed restocking. Much of the decline was concentrated in July, coinciding with the peak in the local price. Consumer preferences continue to evolve in China, aided by industry efforts Tastes are shifting further away from traditional 24k gold towards higher-designed 18k or gem-set pieces. 24k bore the brunt of the weakness, with 18k in particular making inroads in market share. However, this shifting landscape is not purely being driven by changing consumer tastes. Producers are playing a key role in promoting these products due to the higher margins they generate. The industry is still consolidating and competition is fierce. Manufacturers, wholesalers and retailers are battling for market share. Recognition of the importance of brand has led companies to promote their brands more actively through a range of channels, including franchising, celebrity endorsements and media. 7 http://www.mahindra.com/news-room/press-release/Mahindra-Tractors-Sells-29035-Units-Registers-a-Growth-of-70-in-the- Domestic-Market-during-September-2016 8 India has two main cropping seasons: Kharif and Rabi. Kharif crops are sown during the summer monsoon, beginning with the first of the rains in July, and are harvested in the winter. Rabi crops are sown during the winter months, with a spring harvest. 9 http://eands.dacnet.nic.in/Advance_Estimate/Advance_Estimate_Eng.pdf
- 9. 09Gold Demand Trends | Third quarter 2016 And the industry also faces the challenge of the rising popularity of ‘experiential’ purchases at the expense of physical consumption The trend for consumers – especially the so-called ‘millennials’ – to prefer spending their money on experiences that can be shared, rather than on material goods, is well publicised. Evidence of this can be seen in the way the Chinese populace chose to celebrate the recent ‘Golden Week’ national holiday. Over the last three years, the number of people choosing to travel during this holiday has grown by nearly 25%, reaching 589 million. 31% of this year’s tourists were millennials, born after 1980 (Chart 5). Price driven weakness in jewellery demand affected all Asian markets Jewellery demand was universally weaker among the smaller markets in South East Asia as consumers baulked at gold prices around 3-year highs. Indonesia, the largest of the group, fell by 6%. The local gold price jumped, albeit that the currency strengthened slightly against the dollar towards the end of the quarter. Taken in the context of slower-than-expected GDP growth in the country (5% p.a. as against President Widodo’s 7% target), the contraction in demand is in line with expectations. South Korea witnessed the largest decline: down 24% year-on-year to 2.8t. The high gold price was the main reason for the decline, but the country has also been affected by the economic deceleration in China, which absorbs around 25% of South Korea’s exports. Japan was also affected by China’s sphere of influence: mainland tourists have been less active in buying gold during their travels to Japan. Demand slipped 4% to 4.2t in Q3, although on a year-to-date basis the market is fairly resilient, up 2% on Q1–Q3 2015. Middle Eastern jewellery markets remain in a parlous state Jewellery demand across troubled Middle Eastern markets continued to decline, reaching record lows in Egypt and the UAE. Against the backdrop of regional conflict, which has made swingeing cuts in tourist demand, high gold prices and lower oil revenues contributed to the weakness. As in other price-sensitive markets, the corollary to this was a rise in recycling across the region. • The cohort of the Chinese population choosing to travel during the October ‘Golden Week’ national holiday has risen by nearly 25% over the last two years, reaching 589 million in 2016. • The shift away from more overt material consumption contributed to the 22% year-on-year decline in demand for gold jewellery. Source: China Tourism Academy; World Gold Council Chart 5: Growth in Chinese tourism highlights rising popularity of ‘experiential’ purchases (number of Chinese travelling, both domestically and internationally, during the Golden Week holiday) 2014 475 million 2015 526 million 2016 589 million
- 10. 10Gold Demand Trends | Third quarter 2016 Egypt’s currency crisis has resulted in an almost- doubling in the local price of gold over the first three quarters of 2016 Year-to-date demand is down 42% on the same period in 2015, and Q3 demand halved to just 6t. Persistently low oil revenues in the UAE and Saudi Arabia, have strained finances and impacted jewellery consumers: demand in both markets plunged 23%. Iran again outperformed, managing 6% growth year-on-year in Q3 as the country continues to benefit from more favourable economic conditions than other markets in the region. Record local prices in Turkey kept demand on a downward trajectory Notwithstanding the impact from cross-border conflict, the jewellery market in Turkey faced a number of headwinds – namely: the slowing economy; record local prices; and uncertainty following the attempted coup. The 22% drop in Q3 demand took year-to-date demand to 27.3t, down 20% on 2015. The prospects for the fourth quarter remain weak as political instability and continued lira weakness frame the consumer picture. Growth cycle in US jewellery demand runs out of steam A modest 1% year-on-year downturn in Q3 jewellery demand in the US was the first such decline for three years. Year-to-date demand of 74.6t is almost exactly on a par with last year. Jewellery imports subsided during the quarter as inventory levels across the supply chain are at healthy levels. Uncertainty associated with the Presidential election campaign undoubtedly explains a portion of this weakness, but research suggests that wealthy consumers have also become more reluctant to spend amid concerns about the global economy. Recent consumer research that we have conducted reveals some interesting patterns of behaviour among US jewellery consumers, and discusses possible strategies for market growth. We outline the findings in our Focus Box ‘US jewellery: motivations and opportunities for growth.’ Poor consumer confidence across European markets takes its toll on jewellery demand France was again the laggard in Europe, where the recently-introduced 9k gold segment went into retreat. Demand was the lowest in our historical series – down 4% to 1.9t. The market faces the continued risk of silver eating into the market share of low-carat gold jewellery. All other markets saw declines in the region of 1%–2%, with the exception of Spain, where demand appears to have formed something of a base around 1.7/1.9t per quarter.
- 11. 11Gold Demand Trends | Third quarter 2016 Focus: US jewellery – motivations and opportunities for growth Consumer research helps us understand US jewellery demand The first half of 2016 saw the strongest level of US jewellery demand for seven years as the market continued its gradual recovery in the wake of the 2007–9 financial crisis. Against this improving landscape, we surveyed 2,000 US females aged between 18–65, all of whom were engaged with the jewellery/luxury fashion category, to gain insights into the motives and behaviours of US gold jewellery consumers.10 Almost two-thirds of respondents own gold jewellery; 11% intend to buy in the next 12 months Silver and costume jewellery account for a significant portion of US consumers’ jewellery purchases, pushing ownership rates and purchase intentions significantly higher than those for more expensive, enduring and emotive types of jewellery, including gold. This is partly because consumers feel more comfortable buying silver and costume jewellery for themselves and are more likely to buy them spontaneously; there is less ‘meaning’ attached to these purchases. It is also because they are typically lower value transactions. Our research indicates that fine jewellery is more likely to be received as a gift, often bought by a spouse or partner, more likely to be a planned purchase, and is more likely to be a high value transaction. Despite the competitive marketplace, gold still plays an important role in the US jewellery market: almost two- thirds of respondents owned gold jewellery and 11% said they intended to buy gold jewellery in the next twelve months (Chart 6). Unsurprisingly, gold ownership and intention to buy is closely correlated to peoples’ income levels: as household income rises, so too does ownership and intention to buy. Gold jewellery purchases are typically 14 carat and unbranded, usually bought to celebrate special moments in one’s life The survey provided further supportive evidence of the dominance of 14k in the US jewellery market. Of the consumers that had bought gold jewellery during the previous 12 months, 46% bought 14k, while 22% bought 18k. While the dominance of 14k is unsurprising, it’s reassuring to see that 9k gold did not gain a meaningful foothold in recent years when the rising gold price led some retailers to push lower purity products in order to meet key price points; 9k gold accounted for only 1% of recent purchases. However, a surprisingly high 15% did not know the caratage of the jewellery they bought. Branding, while important, does not seem to play a strong role in gold jewellery: 45% of consumers who had bought gold jewellery said it was unbranded, compared to 29% and 35% for diamond and platinum jewellery respectively. This is reflected in the structure of the market and appears to be a growing trend: multi-line retailers dominate, and have been gaining market share at the expense of speciality jewellery merchants, who have suffered severe sales shrinkage so far this year. Gold resonates particularly well with those consumers looking to buy a piece of jewellery that they feel is associated with tradition or reminds them of a special moment in their life. A key strength of gold for these consumers is that it keeps an inherent emotional and financial value over time and can be passed to the next generation. And this segment of the luxury fashion and jewellery market is valuable, accounting for 42% of the total value of purchases we surveyed.11 10 We commissioned TNS to survey 2,000 females, aged between 18–65. Respondents were non-rejectors of jewellery who had either purchased or asked for – and received – as a gift a piece of jewellery or a designer/luxury item in the preceding 12 months. The competitive set included jewellery and luxury fashion purchases (e.g. gold, platinum, diamond, silver and costume jewellery, smartphones/watches and designer/luxury fashion). 11 Value measured by a spend index. Gold Platinum Diamond Silver Costume Own Last 12 month purchase Next 12 month purchase intent Source: KANTAR TNS; World Gold Council 0 10 20 30 40 50 60 70 80 Chart 6: Gold is prominent in the national jewellery box: almost two-thirds of respondents own fine gold jewellery % saying they own/have purchased gold jewellery in the last 12 months/will purchase in the next 12 months 59 16 60 71 65 17 5 9 36 45 11 4 8 21 22
- 12. 12Gold Demand Trends | Third quarter 2016 While online is important, the in-store experience remains crucial The in-store experience remains an important part of the purchase journey for jewellery and luxury fashion items, with 55% saying it was where they sought ideas before making a purchase. Friends, family and colleagues was the next most important source of inspiration. As one might expect, ‘millennials’ are a little bit different. While in-store browsing and friends, family and colleagues remain the most important sources of inspiration, online blogs were significantly more important: 21% used them to generate ideas compared to13% in the general population. This preference for the in-store experience may encourage the evolution of so-called ‘clicks and bricks’ retailing, where retailers integrate their traditional bricks-and-mortar stores with their online offerings. An example of such innovation is Blue Nile’s opening of a number of ‘webrooms’ across the country.12 These offer customers the best of both worlds: giving them the in-store experience of touching, handling and trying on jewellery pieces before ordering them online – either via the in-store iPads or at home. US jewellery demand should consolidate recent growth The US gold jewellery market is still a considerable way off where it was ten years ago: in Q4 2015 demand was valued at US$1.6bn, significantly lower than the high of US$2.5bn set in Q4 2007.13 But demand volumes have been on a gradual upward trend in recent years, averaging more than 1% growth in tonnes of gold jewellery bought each quarter since the beginning of 2014. And our consumer research suggests it could continue to grow. As part of the survey we assessed the degree to which actual purchases of gold were satisfying desired purchases. We did this by comparing gold jewellery’s share of mind14 to its share of purchase. Where share of mind is greater, it suggests there is latent demand. Encouragingly, this was very much the case for the US, with share of mind for gold jewellery outstripping its share of purchase by 11:4. (Chart 7). That is not to say it is easy to convert this latent demand into sales. There are barriers preventing people buying gold jewellery. The most obvious one is people’s price perceptions: 13% of respondents said gold jewellery was totally unaffordable, while 38% said it was quite unaffordable. This compares to India and China – the largest gold jewellery markets in the world – where gold is perceived to be far more affordable. And fine jewellery – not just gold jewellery – underperforms for millennials. When offered US$1,000, only 24% of those between 18–25 would buy fine jewellery, compared to 47% of those aged over 34. Luxury fashion and technology does a better job at engaging with millennials, who are increasingly focused on ‘experiential’ purchases. And this trend is clear in data presented by JPMorgan Chase, which revealed that in 2015, on average, 34% of spend by millennials was on experiences such as travel and entertainment, compared with 28% for the non- millennial population.15 For retailers looking to grow their gold jewellery business, the latent demand in the market is encouraging. And it is reassuring that gold performs well in the most valuable part of the jewellery and luxury fashion market. But converting this demand is not simple. Retailers will need to tackle consumers’ price and affordability perceptions, for example by continuing to develop and market pieces at lower price points, and by developing online strategies to engage more effectively with the younger generation: Blue Nile’s roll out of ‘webrooms’ might be a strategy for the industry to look towards. 12 http://www.bluenile.com/jewelry-stores 13 The US jewellery market shows strong seasonality, with demand peaking in Q4 each year. 14 ‘Share of mind’ and ‘latent demand’ are measures commonly used in market research to assess the growth potential of a product or category. Put simply, share of mind measures what would we expect consumers to purchase based on their ideal preferences. 15 https://www.jpmorganchase.com/corporate/investor-relations/document/2016-barclays-presentation.pdf 0 2 4 6 8 10 12 L12M purchase share Share of mind % Source: KANTAR TNS; World Gold Council Chart 7: % share of mind/share of last 12 month purchase for gold jewellery 4 11 Latent demand +7%
- 13. 13Gold Demand Trends | Third quarter 2016 Tonnes Q3’15 Q3’16 Year-on -year change Year-to -date change World total 295.8 190.1 -36% -13% India 57.0 40.1 -30% -25% China 53.2 41.0 -23% 0% Investment ETP inflows again commandeered the gold investment market in Q3. Demand for bars and coins was, almost without exception, weaker across all markets. Investment demand in Q3 totalled 335.7t, 44% up year-on- year and 8% above the five-year quarterly average demand for the sector of 311.4t. Year-to-date investment reached a record of 1,389.2t, 10% above the previous Q1–Q3 high of 1,268.5t from 2010. The motives behind, and geographical distribution of, inflows into ETPs are discussed in detail in Key themes. Momentum behind these inflows has tapered off slightly, but Q4 has still seen marginal inflows. In the context of a 10% fall in the price, this highlights that price momentum is secondary to the strategic motives underpinning investment. Overall, we maintain a positive outlook on the sector, particularly given the fragile macroeconomic backdrop, such as negative interest rates and geopolitical risks. Bar and coin demand was contrastingly weak in Q3, falling by more than a third to 190.1t (Chart 8). Year-to-date demand for these products of 664.2t was the lowest since 2009. The high gold prices that were a major cause of weakness in the jewellery sector were similarly off-putting for investors, and the lack of momentum in the price during the quarter was a further deterrent. Market research shows that investors look for a low, or rising, gold price as a signal to buy – both of which were notably absent in the third quarter. But the price drop in the opening weeks of Q4 has provoked a response in some markets. Our Focus Box ‘Q4 Update: impact of prices on consumer demand’ provides further detail on investors’ perceptions of – and reactions to – recent price moves. • Year-to-date retail investment demand for bars and coins is at its lowest level since 2009. • High gold prices were a major cause of weakness across most markets. Weak demand in India was compounded by the government’s focus on curbing cash transactions. • Demand may improve in Q4; the price drop in the first week of October resulted in an uptick in retail investor interest in the US, India and China. Source: Metals Focus; GFMS, Thomson Reuters; World Gold Council 0 100 200 300 400 500 600 700 Tonnes Chart 8: Retail investment demand has been weak Q1’07 Q3’08 Q1’10 Q3’11 Q1’13 Q3’14 Q1’16 In contrast to ETPs, bar and coin demand was weak in Q3, falling by more than a third to 190.1t. Year-to-date demand for these products of 664.2t was the lowest since 2009.
- 14. 14Gold Demand Trends | Third quarter 2016 Indian bar and coin demand very weak in 2016 to date; Q4 holds better prospects Investment demand fell for the third consecutive quarter in India, down 30% to 40.1t. At just 100.7t, year-to-date demand for bars and coins is the lowest for 12 years, below that even of 2009 when the first quarter saw negative investment for the only time in our time series. Investors already reluctant to buy at such persistently high gold prices, were also put off by the government’s focus on curbing cash transactions. Demand for gold bars was more greatly affected by the measures than that for gold coins, as cash remains one of the primary means of purchasing gold bars. Surging stock markets bumped gold further out of the spotlight. Despite the depressed market, there is a growing market for branded gold coins in India, which – going forward – should support investment demand in India. The Indian Gold Coin, from MMTC has sold 185kg since its launch in November 2015 and is currently available through around 300 outlets.16 Similarly, the Tola Coin will appeal to customers who look for purity and brand. In another move, IBJA launched a personalised coin this festival season. IBJA has launched a store in Mumbai and wants to set up 100 stores in the next three years.17 Our report ‘India’s gold investment evolution’, produced in conjunction with MMTC, takes a detailed look at the market for branded gold coins in India.18 European investment sank to an 8-year low, but net demand masks underlying activity Europe’s bar and coin market failed to replicate the flows pouring into ETPs in the region. Investment in bars and coins fell to an 8-year low of 37.6t in Q3, down 37% from the same period last year. The year-on-year decline is all the more marked for the fact that Q3 2015 was the strongest third quarter for four years, as investors responded to the falling gold price. Nevertheless, bar and coin demand during the most recent quarter was unarguably anaemic – 38% below the five-year quarterly average of 61.1t. The weakness is largely reflective of a sharp bout of selling in July. This was triggered by the jump in the gold price – the short-lived response to the UK’s Brexit vote – which saw the euro-denominated gold price reach three-year highs. The price based in sterling was even more marked, due to the sell-off in the pound in the immediate wake of the referendum. On the face of it, the 11% decline in UK bar and coin demand seems to indicate that investors in that market were inactive. This was far from the case. Gross levels of both buying and selling were elevated during the quarter, indicating a heightened level of activity in trading gold bars and coins. The two sides largely cancelled each other out, creating net demand of just 2.4t for the quarter. This pattern was repeated across the region: selling back of existing holdings swelled the stock of bars and coins available for purchase in the secondary market. This helps to explain depressed sales of newly minted coins. The focus among French investors on selling into the price rally, resulted in a second consecutive quarter of net negative investment. Year-to-date investment is marginally negative at -0.2t. A negative fourth quarter would result in annual disinvestment in France for the first time since 2008, prior to the global financial crisis. For Q1–Q3, demand is 14% down on 2015 and consequently Europe has slipped to second place in market size: on a year-to-date basis, China’s bar and coin market is the world’s largest. Bar and coin investment still weak in China; funds diverted to ETPs Retail investment in China stabilised after the wash-out of the preceding quarter, but the decline from 2015 levels was acute. Q3 demand of 41t – down 23% – equated to a year-to-date total of 162.5t, almost bang in line with last year. Bar and coin purchases from commercial banks and large retailer chains dropped sharply in the third quarter: data from a couple of commercial banks show sales of gold falling by, on average, 50% year-on-year. GAPs saw net redemptions as the 2-year high in the price in early July prompted a spike in liquidations. 16 https://www.gold.org/my-gold-guide/news-and-trends/indian-gold-coin 17 http://www.business-standard.com/article/pti-stories/ibja-gold-to-set-up-100-stores-in-3-years-116101200503_1.html 18 http://www.gold.org/research/india-gold-coin
- 15. 15Gold Demand Trends | Third quarter 2016 The decline in demand was partially offset by direct individual withdrawals from the SGE, which remained elevated – many multiples of the withdrawals in Q3 2015. But more permanent attrition resulted from investors diverting funds to ETPs. Lower transaction costs and the introduction of online platforms and mobile applications offering access to ETPs with minimal entry requirements attracted many erstwhile bar and coin investors. As well as a reticence to buy gold at high price levels, lower disposable incomes were a key factor underlying the weak demand picture. The sluggish economy, lower take- home incomes and rising housing outlays have fostered a desire among Chinese households to build a cash buffer. The pressure of rising real estate prices on disposable incomes is a function of the degree to which property is used as an avenue for investment in China. Research by Knight Frank, in constructing their Prime International Residential Index, put Shanghai as the third fastest- growing property market globally.19 The fourth quarter has started on a more positive note in China, thanks to the price drop in early October. Consumers were swift to respond to lower prices and remain alert to any further buying opportunities. Heightened price sensitivity still a feature of the US market US demand for gold bars and coins almost halved from Q3 2016, down 43% to 17.4t. The year-on-year comparison in US investment was never going to be easy; Q3 2015 was an exceptional quarter which saw demand jump as the gold price dipped. Putting the recent quarter into context, it is 5% stronger than the five-year quarterly average of 16.6t. And year-to-date demand is 14% ahead of last year at 62.8t. Indicative of the fact that US retail investors remain keenly aware of price fluctuations in gold, September saw a surge in sales as bargain-hunting emerged on the dip down in prices towards US$1,300/oz. And October has continued in similar fashion, with sales of Eagle coins surging thanks to the weaker gold price. Middle Eastern investment sinks to record low Paltry levels of Middle Eastern demand were largely a function of weakness in Iran. This is partly due to a downwards revision in our data series to reflect a shift from investment to jewellery purchases amid a dearth of newly minted gold coins: indeed, the market faced net disinvestment in the face of high gold prices. But demand in other regional markets was also far from healthy. Bar and coin investors faced similar challenges to jewellery consumers: high gold prices, lower oil revenues squeezing incomes and political instability all contributed to the lowest level of regional investment in our time series of just 1.9t – a fraction of the 19.7t five-year quarterly average. The 47% year-on-year drop in Turkey’s bar and coin demand was partly the result of last year’s strong Q3 base. Demand has bumped along in the range of 4–5t since the beginning of last year, with the exception of the third quarter when political turmoil coincided with lower prices to spark a rush for safe haven holdings of gold. Demand is expected to continue in a similar vein for the rest of the year, given very high local prices (due to lira weakness) and the persistent negative geo-political climate. Investment in the smaller Asian markets shelved in the face of high prices Retail investment demand across the smaller markets in Asia stalled in the face of higher gold prices. Investors viewed the price hike as temporary and held off from making any purchases of bars and coins in anticipation of a correction back towards US$1,300/oz. A relatively benign inflation environment across markets including Thailand and Indonesia also undermined the motive for buying gold as an inflation hedge. Fourth quarter demand is expected to pick up as October’s price drop offered a good buying opportunity for those waiting for lower prices. 19 Knight Frank, The Wealth Report 2016.
- 16. 16Gold Demand Trends | Third quarter 2016 Focus: Q4 update – impact of prices on consumer demand The sharp rise in the gold price this year has stifled consumer demand The rapid gold price increase in 2016, fuelled by strong institutional investor inflows, has hampered consumer demand: year-to-date bar and coin demand is down 13% and jewellery demand is at its lowest level since 2009. Field research throughout the year has indicated that some consumers have been sitting on the side-lines waiting for a price dip before entering the market. For this section of the market the sharp 4.5% price drop in the first week of October proved to be the opportunity they had been waiting for. Snapshot survey confirmed the October price dip was viewed as a buying opportunity Consumer research highlights how important price movements are for many gold investors. At the start of the year we surveyed 4,000 investors across India, China, US and Germany to better understand gold buying behaviour. Gold’s role in preserving wealth and generating good long- term returns were primary motives for investing in gold. But perceptions of the price being low, or on the way up, was one of the most significant triggers to actually buying gold. 20 In the week commencing 17 October, KANTAR TNS undertook an online omnibus survey of 1,000 consumers in India and China. The survey captured jewellery and bar and coins because a portion of jewellery demand in India and China is investment related. 21 In the week of the survey the gold price in India averaged Rs29,900 /10g, down 4% compared to the end of September. In China, it averaged RMB277/g, down 3% from the end of September. Note: the Indian rupee gold price reflects the 10% import duty. We responded to the sharp drop in prices at the beginning of October with a snapshot survey of 1,000 consumers in both India and China to see if they had been tempted to buy.20 The results confirmed that around a sixth had. Of the consumers surveyed 18% in India and 12% in China had bought gold directly in response to the price drop. A further 24% in India and 27% in China had bought gold, but unrelated to the price drop. Factors supporting this element of demand included the best monsoon in three years supporting rural incomes in India, and concerns over an ever-weakening currency and frothy property market in China. Some consumers are still hoping for lower prices before entering the market A large proportion of those surveyed – around a fifth in China and a third in India – are waiting for lower prices before entering the market (Chart 9). The price that would prompt them to buy gold varies considerably for these would-be consumers, but a significant portion would enter the market in response to a fairly modest price drop: 11% of those waiting for a price dip in India would buy before the price fell to Rs29,000/10g and 22% in China would enter the market before the price fell to RMB270/g. This suggests that we would see a healthy consumer response in both markets if the price started heading towards US$1,240/oz.21 Looking ahead, we expect Q4 consumer demand to have been boosted by the price drop in early October, and we would expect any further dips in the gold price to be met by a strong consumer response. 18 12 24 27 5 3 6 15 21 33 21 13 Purchased due to price drop Purchased irrespective of price drop Haven’t purchased, but will in next month Haven’t purchased, but considering it Not planning to buy Waiting for further price drop before purchasing India China Source: KANTAR TNS; World Gold Council 0 5 10 15 20 25 30 35 Chart 9: Indian and Chinese consumers’ reaction to the October price drop % of respondents
- 17. 17Gold Demand Trends | Third quarter 2016 Central banks and other institutions An additional 82t in the third quarter brought central banks net purchases to 23 consecutive quarters. So far in 2016, we have seen characteristic restraint from central banks Although institutional investors have flocked to gold in the face of significant uncertainty, net purchases from central banks have been more measured. Year-to-date, central banks have purchased 271.1t, lagging the 407.7t for the same period in 2015. Nonetheless, gold remains a significant – and gradually rising – part of total central bank reserves, currently accounting for more than 13%. In the third quarter, central bank net purchases fell 56% year-on-year to 81.7t, from 168t. Activity bore a striking resemblance to recent quarters: the central banks that have been consistently active in the market in recent months remained so, while little movement was seen elsewhere. Russia (43.9t), China (15.2t) and Kazakhstan (10t) continued to push forward with their buying programmes and Belarus also added 3.1t to their reserves. Net sales from other banks were again limited. Tonnes Q3’15 Q3’16 Year-on -year change Year-to -date change Central banks and other institutions 168.0 81.7 -51% -33% The case for gold remains compelling for reserve managers amid the prevalence of negative interest rate policies and diversification away from the US dollar Yet, like retail consumers, many central banks may be adopting a “wait-and-see” approach, in the hope they can bolster their gold reserves on possible dips in the price, or until they are confident gold has regained some upward momentum. But there is good reason to believe that purchases are unlikely to dry up any time soon. Having already accumulated 128.1t by the end of September, the Central Bank of Russia recently made known its aim to purchase around 200t in total this year, similar to the 206t it purchased in 2015.22 It has also been reported that Belarus intends to increase its gold and FX reserves by US$500mn in 2017.23 Furthermore, a recent survey of 19 central bank reserve managers showed that close to 90% plan to either increase or maintain their current gold reserve levels over the next three years (Chart 10).24 22 https://sputniknews.com/russia/201609291045824826-russia-gold-stock-up-comment/ 23 http://eng.belta.by/economics/view/belarus-to-raise-gold-foreign-exchange-reserves-up-to-54bn-in-2017-95041-2016/ 24 In response to the question “What is your institution’s plan for your gold holdings over the next three years?”: 56% said increase, 33% said no change, and 11% said decrease. This survey was conducted at our Executive Programme in Gold Reserves Management at the University of Cambridge Judge Business School in September 2016. • Central bank purchases of gold have slowed in 2016, assuming a more measured pace. • Survey responses confirm that gold purchases should continue, with the vast majority planning to maintain or increase their gold holdings. Increase 56% No change 33% Decrease 11% Source: World Gold Council Chart 10: Central banks show intention to maintain or increase gold reserves (% answering ‘What is your institution’s plan for your gold holdings over the next 3 years?’)
- 18. 18Gold Demand Trends | Third quarter 2016 Technology Gold demand in the technology sector improved from Q2 as conditions recovered in China and South Korea, but still registered year-on-year marginal decline. Demand for gold in the technology space stood at 82.4t in Q3, a small uptick on the previous quarter but still 1% lower than Q3 2015.Growth from a stronger performance in gold bonding wire and the LED industry was undone by weakness in the wireless sector. Electronics demand dragged by weaker wireless sector Gold used in electronics dropped 1% year-on-year to 65.1t in Q3 2016. Improved demand from the gold bonding wire and LED industry were offset by a drop in the order book of a key wireless manufacturer and a muted response from the Printed Circuit Board (PCB) industry to high smartphone shipments. Gold bonding wire consumption recovered in the third quarter on strong demand for mobile memory packages, fingerprint sensors and flash memory chips. Production growth of Chinese branded smartphones, such as Huawei and Xiaomi, is likely to underpin demand in Q4. In addition, the LED industry used 6% more gold in Q3 year-on-year as utilisation rates reached more than 90%, compared to 60–70% in Q2. As LED chip makers diversify into new fields such as the agricultural and horticultural segments for higher margins, gold volumes are likely to receive further support from these areas. Tonnes Q3’15 Q3’16 Year-on -year change Year-to -date change Technology 82.8 82.4 -1% -5% Electronics 65.5 65.1 -1% -5% Other Industrial 12.6 12.8 2% -1% Dentistry 4.7 4.4 -6% -5% But weaker than expected performance from the wireless sector and technological advances in PCB manufacturing has undermined the demand for gold. A decline in the order book at one Taiwan-based semiconductor company has cut 2% off the region’s industrial consumption of gold. Moreover, as PCB makers embraced High Density Interconnects (HDIs) that reduce the unit area of PCBs, uses of gold by this sector stayed flat despite higher smartphone shipments. More ways to recover and use gold developed Researchers at the University of Edinburgh in Scotland have developed a technique to recover gold from e-scrap that could reduce usage of hazardous chemicals.25 The process involves submerging circuit boards in a mild acid and then adding a compound to extract gold selectively from the mixture of other metals. It is claimed that this method could be more efficient in recovering gold than current methods. Midatech, an international specialty pharmaceutical company, announced that it has started a Phase 1 study of a type 1 diabetes vaccine using gold nanoparticle (GNP) technology, the first such product to be used in humans. The GNPs help to reduce the body’s immune response against insulin-producing cells.26 Slight gains in other industrial uses of gold cancelled out by further dental declines Industrial demand in Q3 inched up by 2% year-on- year, from 12.6t to 12.8t. This was largely thanks to an increase in plating demand in India. The festive season saw an increase in demand for gold-plated articles, particularly images of gods and goddesses. Also, slight growth in demand for gold-plated jewellery – and even the introduction in gold-plated silver jewellery at one or two stores in Southern India – was a consequence of the persistently high gold price. Gold used in dentistry fell another 6% year on year to 4.4t in Q3. Demand is expected to fade further as the industry and consumers turn to ceramic materials for cosmetic reasons. 25 http://www.ed.ac.uk/news/2016/gold-from-phones-becomes-real-prospect 26 https://globenewswire.com/news-release/2016/09/30/876049/10165404/en/Midatech-Pharma-Plc-Commencement- of-First-in-Human-Immunotherapy-Study-Using-Gold-Nanoparticle-Technology.html
- 19. 19Gold Demand Trends | Third quarter 2016 Supply Elevated recycling in the third quarter offset a fall in mine supply, lifting total supply 4% year-on-year. Outlook for mine production is rock steady Mine production in the third quarter was virtually unchanged (-0.5%) year-on-year, as miners brought 846.8t onto the market. Year-to-date, gold production totalled 2,393.1t, versus 2,373.3t for the same period in 2015 (+1%). Despite an expectation that 2016 will see a marginal increase in production, the overall trend of plateauing output remains in place (Chart 11). The operational changes – cost reduction and focus on core assets – enacted by gold producers over the last few years will define the industry for years to come. Tonnes Q3’15 Q3’16 Year-on -year change Year-to -date change Total supply 1,127.2 1,172.7 4% 8% Mine production 851.2 846.8 -1% 1% Net producer hedging 14.4 -15.0 - - - - Recycled gold 261.6 340.9 30% 18% While the production figures are still provisional – owing to the varied timings that producers release their quarterly results – Q3 appears to be a carbon copy of Q2: both increases and declines were seen across projects globally. Higher production at established projects helped lift year- on-year output from Canada (+1t) and Indonesia (+6t), with the latter likely to see a significant pick-up in production in Q4 owing to higher output at Grasberg. The ramping up of projects in Guyana, as well as commercial production being reached at the Merian project in Suriname (one of only a few new mines being brought on-stream by major producers), also helped the industry maintain a steady supply of gold. Offsetting these gains were lower output at some larger projects: Q3 production in the United States likely fell around 6t year-on-year, while lower-grade mining at Oyu Tolgoi dented Mongolian production (-3t). Cost management continues to significantly influence the industry. Although all-in sustaining costs (AISC) crept up in Q2 due to currency movements, costs are still significantly lower than they were in 2013. One example of this frugality is project expenditure – which captures the cost of developing projects – which peaked in 2012, and currently remains at multi-year lows as producers remain hesitant to loosen the purse strings (Chart 12). Not only are existing mines impacted by this parsimony, but the project pipeline is too, as new projects are contributing less to the amount of gold that is being mined annually. • Year-to-date, mine production is only marginally ahead of 2015 at 2,393.1t. • While full-year mine production is forecast to grow slightly in 2016, we maintain our overall view that supply from this source will plateau over the coming years. Tonnes Year-on-year % change (rhs) Source: Metals Focus; GFMS, Thomson Reuters; World Gold Council 0 500 1,000 1,500 2,000 2,500 3,000 3,500 Tonnes % Change -6 -4 -2 0 2 4 6 8 10 AISC peaked at US$1,149/oz in Q2’13, and has been brought down to US$881/oz in Q2’16. 2000 2002 2004 2006 2008 2010 2012 2014 2016E Chart 11: Annual mine production is plateauing as cost-cutting bites
- 20. 20Gold Demand Trends | Third quarter 2016 Producers’ third quarter hedging hiatus Net hedging has been a feature of the gold market since the second half of 2015. Gold producers have eyed the dramatic price increase in 2016 as a further – more favourable – opportunity to lock-in higher, in some cases record, gold prices. This led some to question whether this heralded a return to heightened levels of hedging. Yet, in a break from the last four consecutive quarters, Q3 2016 brought with it a more muted tone from producers. Net hedging of 79.8t in H1 has been followed by a return to net de-hedging of 15t in Q3, lowering the global hedgebook to 282t. This shift away from fresh hedging positions (on a net basis) was partially driven by the behaviour of the gold price. Compared to the first six months, the gold price was confined in the US$1,300– 1,350/oz range, and volatility fell. Combined with fewer new projects coming on stream – which often require hedging to secure financing – this reduced the appetite for hedging. The most notable fresh hedge position occurred at the start of the quarter, with Harmony Gold hedging 20% (432,000oz) of its production over the next two years. The company made clear that: “The limited size and duration of the hedge means shareholders retain full upside exposure on 80% of Harmony’s future gold production for the next two years, after which shareholders will have 100% exposure to the gold price.”27 Further upward momentum in the price may elicit additional small-scale hedging – on a sporadic basis – as producers continue to secure cash-flow, but it is unlikely that the industry will return to large scale hedging. 27 https://www.harmony.co.za/investors/news-and-events/company-announcements-2/announcements-2016/934-harmony- meets-annual-production-guidance-creates-further-cash-certainty • Cost management remains a key priority for the industry – costs are well below the peak levels from 2013. • In particular, continued cuts to project spending imply a constricted pipeline. Sustaining Capex Non-Sustaining/Project Capex Gold Price (US$/oz, Qtr.Avg, rhs) Note: Sustaining capital expenditure are costs incurred related to maintaining of production at current levels. Non-sustaining/project capital expenditure are those costs incurred at new operations and costs related to ‘major projects’ at existing operations where these projects will materially increase production. Source: Metals Focus Peer Group Analysis Q1’09 Q1’10 Q1’11 Q1’12 Q1’13 Q1’14 Q1’15 Q1’16 800 900 1,000 1,100 1,200 1,300 1,400 1,500 1,600 1,700 1,800 0 100 200 300 400 500 600 700 800 US$/oz US$/oz Chart 12: Cost-cutting has curtailed spending on project development
- 21. 21Gold Demand Trends | Third quarter 2016 Notes and definitions All statistics (except where specified) are in weights of fine gold. Notes Revisions to data All data is subject to revision in the light of new information. Historical data series Demand and supply data from Q1 2014 are provided by Metals Focus. Data between Q1 2010 and Q4 2013 is a synthesis of Metals Focus and GFMS, Thomson Reuters data, which was created using relatively simple statistical techniques. For more information on this process, please see Creating a consistent data series by Dr James Abdey (http://www.gold.org/supply-and-demand/gold- demand-trends/back-issues/gold-demand-trends-q1- 2015#package) Definitions Central banks and other institutions Net purchases (i.e. gross purchases less gross sales) by central banks and other official sector institutions, including supra national entities such as the IMF. Swaps and the effects of delta hedging are excluded. Consumer demand The sum of jewellery consumption and total bar and coin investment occurring within a country i.e. the amount (in fine weight) of gold purchased directly by individuals. Electronics This measures fabrication of gold into components used in the production of electronics, including – but not limited to – semiconductors and bonding wire. Dentistry The first transformation of raw gold into intermediate or final products destined for dental applications such as dental alloys. ETFs and similar products Exchange Traded Funds and similar products including, but not limited to: SPDR Gold Shares, iShares Gold Trust, ZKB Gold ETF, ETFS Physical Gold/Jersey, Gold Bullion Securities Ltd, Central Fund of Canada Ltd, Xetra-Gold, Julius Baer Precious Metals Fund – JB Physical Gold Fund, Source Physical Gold P-ETC, Sprott Physical Gold Trust. Over time, new products may be included when appropriate. Gold holdings are as reported by the ETF/ETC issuers and where data is unavailable holdings have been calculated using reported AUM numbers. Fabrication Fabrication is the first transformation of gold bullion into a semi-finished or finished product. Gold demand The total of jewellery fabrication, technology, total bar and coin demand and demand for ETFs and similar products. Jewellery End-user demand for all newly-made carat jewellery and gold watches, whether plain gold or combined with other materials. Excluded are: second-hand jewellery; other metals plated with gold; coins and bars used as jewellery; and purchases funded by the trading-in of existing carat gold jewellery. Jewellery fabrication Jewellery fabrication is the first transformation of gold bullion into semi-finished or finished jewellery. Differs from jewellery consumption as it excludes the impact of imports/exports and stocking/de-stocking by manufacturers and distributors. LBMA Gold price PM Unless otherwise specified, gold price values from 20 March 2015 are based on the LBMA Gold price PM administered by ICE Benchmark Administration (IBA), with prior values being based on the London PM Fix. London PM Fix Unless otherwise specified, gold price values prior to 20 March 2015 are based on the London PM Fix, with subsequent values being based on the LBMA Gold price PM administered by ICE Benchmark Administration (IBA). Medals/imitation coin Fabrication of gold coins without a face value, produced by both private and national mints. India dominates this category with, on average, around 90% of the total. ‘Medallion’ is the name given to unofficial coins in India. Medals of at least 99% purity, wires and lumps sold in small quantities are also included. Mine production The volume (in fine weight) of gold mined globally. This includes an estimate for gold produced as a result of artisanal and small scale mining (ASM), which is largely informal.
- 22. 22Gold Demand Trends | Third quarter 2016 Net producer hedging This measures the impact in the physical market of mining companies’ gold forward sales, loans and options positions. Hedging accelerates the sale of gold, a transaction which releases gold (from existing stocks) to the market. Over time, hedging activity does not generate a net increase in the supply of gold. De-hedging – the process of closing out hedged positions – has the opposite impact and will reduce the amount of gold available to the market in any given quarter. Official coin demand Investment by individuals in gold bullion coins. It equates to the fabrication by national mints of coins which are, or have been, legal tender in the country of issue. It is measured at the country of consumption rather than at the country of origin (for example, the Perth Mint in Australia, sells the majority of the coins it produces through its global distribution network) and is measured on a net basis. In practice it includes the initial sale of many coins destined ultimately to be considered as numismatic rather than bullion. Other industrial Gold used in the production of compounds, such as Gold Potassium Cyanide, for electro-plating in industrial applications as well as in the production of gold-plated jewellery and other decorative items such as gold thread. India accounts for the bulk of demand in this category. Over-the-counter Over-the-counter (OTC) transactions (also referred to as ‘off exchange’ trading) take place directly between two parties, unlike exchange trading which is conducted via an exchange. Physical bar demand Investment by individuals in small (1kg and below) gold bars in a form widely accepted in the countries represented within Gold Demand Trends. This also includes, where identifiable, gold bought and stored via online vendors. It is measured as net purchases. Recycled gold Gold sourced from fabricated products that have been sold or made ready for sale, which is refined back into bullion. This specifically refers to gold sold for cash. It does not include gold traded-in for other gold products (for example, by consumers at jewellery stores) or process scrap (working gold that never becomes part of a fabricated product but instead returns as scrap to a refiner). The vast majority – around 90% – of recycled gold is high-value gold (largely jewellery) and the remainder is gold recovered from industrial waste, including laptops, mobile phones, circuit boards etc. For more detail on recycling, refer to The Ups and Downs of Gold Recycling, Boston Consulting Group and World Gold Council, March 2015 (www.gold.org/supply-and-demand). Surplus/deficit This is the difference between total supply and gold demand. Partly a statistical residual, this number also captures demand in the OTC market and changes to inventories on commodity exchanges, with an additional contribution from changes to fabrication inventories. Technology This captures all gold used in the fabrication of electronics, dental, medical, decorative and other technological applications, with electronics representing the largest component of this category. It includes gold destined for plating jewellery. Tonne (Metric) 1,000 kg or 32,151 troy oz of fine gold. Total bar and coin investment The total of physical bar demand, official coin demand and demand for medals/imitation coin. Total supply The total of mine production, net producer hedging and recycling.
- 23. Gold Demand Trends | Third quarter 2016 Copyright and other rights © 2016 World Gold Council. All rights reserved. World Gold Council and the Circle device are trademarks of the World Gold Council or its affiliates. All references to LBMA Gold Price have been provided for informational purposes only. ICE Benchmark Administration Limited accepts no liability or responsibility for the accuracy of the prices or the underlying product to which the prices may be referenced. Other third party data and content is the intellectual property of the respective third party and all rights are reserved to them. Any copying, republication or redistribution of content, to reproduce, distribute or otherwise use the statistics and information in this report including by framing or similar means, is expressly prohibited without the prior written consent of the World Gold Council or the appropriate copyright owners except as provided below. The use of the statistics in this report is permitted for the purposes of review and commentary (including media commentary) in line with fair industry practice, subject to the following two pre-conditions: (i) only limited extracts of data or analysis be used; and (ii) any and all use of these statistics is accompanied by a clear acknowledgement of the World Gold Council and, where appropriate, of Thomson Reuters, as their source. Brief extracts from the analysis, commentary and other World Gold Council material are permitted provided World Gold Council is cited as the source. It is not permitted to reproduce, distribute or otherwise use the whole or a substantial part of this report or the statistics contained within it. While every effort has been made to ensure the accuracy of the information in this document, the World Gold Council does not warrant or guarantee the accuracy, completeness or reliability of this information. The World Gold Council does not accept responsibility for any losses or damages arising directly or indirectly, from the use of this document. The material contained in this document is provided solely for general information and educational purposes and is not, and should not be construed as, an offer to buy or sell, or as a solicitation of an offer to buy or sell, gold, any gold related products or any other products, securities or investments. Nothing in this document should be taken as making any recommendations or providing any investment or other advice with respect to the purchase, sale or other disposition of gold, any gold related products or any other products, securities or investments, including without limitation, any advice to the effect that any gold related transaction is appropriate for any investment objective or financial situation of a prospective investor. A decision to invest in gold, any gold related products or any other products, securities or investments should not be made in reliance on any of the statements in this document. Before making any investment decision, prospective investors should seek advice from their financial advisers, take into account their individual financial needs and circumstances and carefully consider the risks associated with such investment decision. Without limiting any of the foregoing, in no event will the World Gold Council or any of its affiliates be liable for any decision made or action taken in reliance on the information in this document and, in any event, the World Gold Council and its affiliates shall not be liable for any consequential, special, punitive, incidental, indirect or similar damages arising from, related to or connected with this document, even if notified of the possibility of such damages. This document contains forward-looking statements. The use of the words “believes,” “expects,” “may,” or “suggests,” or similar terminology, identifies a statement as “forward-looking.” The forward-looking statements included in this document are based on current expectations that involve a number of risks and uncertainties. These forward-looking statements are based on the analysis of World Gold Council of the statistics available to it. Assumptions relating to the forward-looking statement involve judgments with respect to, among other things, future economic, competitive and market conditions all of which are difficult or impossible to predict accurately. In addition, the demand for gold and the international gold markets are subject to substantial risks which increase the uncertainty inherent in the forward-looking statements. In light of the significant uncertainties inherent in the forward-looking information included herein, the inclusion of such information should not be regarded as a representation by the World Gold Council that the forward- looking statements will be achieved. The World Gold Council cautions you not to place undue reliance on its forward-looking statements. Except in the normal course of our publication cycle, we do not intend to update or revise any forward-looking statements, whether as a result of new information, future events or otherwise, and we assume no responsibility for updating any forward-looking statements. C45201611
- 24. World Gold Council 10 Old Bailey, London EC4M 7NG United Kingdom E marketintelligence@gold.org T +44 20 7826 4700 F +44 20 7826 4799 W www.gold.org Published: November 2016