zBoost creates an indoor cell zone (quantum-wireless.com)
Hw7 solution
1. Digital Communications
Homework #7
SOLUTION
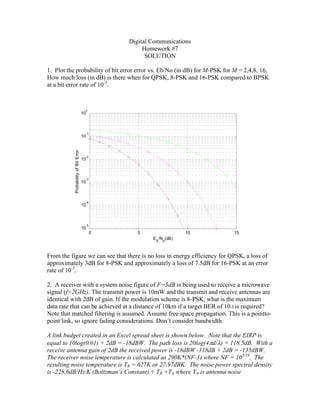
1. Plot the probability of bit error error vs. Eb/No (in dB) for M-PSK for M = 2,4,8, 16.
How much loss (in dB) is there when for QPSK, 8-PSK and 16-PSK compared to BPSK
at a bit error rate of 10-3.
0
10
-1
10
Probability of Bit Error
-2
10
-3
10
-4
10
-5
10
0 5 10 15
E b/No(dB)
From the figure we can see that there is no loss in energy efficiency for QPSK, a loss of
approximately 3dB for 8-PSK and approximately a loss of 7.5dB for 16-PSK at an error
rate of 10-3.
2. A receiver with a system noise figure of F=5dB is being used to receive a microwave
signal (f=2GHz). The transmit power is 10mW and the transmit and receive antennas are
identical with 2dB of gain. If the modulation scheme is 8-PSK, what is the maximum
data rate that can be achieved at a distance of 10km if a target BER of 10-5 is required?
Note that matched filtering is assumed. Assume free space propagation. This is a pointto-
point link, so ignore fading considerations. Don’t consider bandwidth.
A link budget created in an Excel spread sheet is shown below. Note that the EIRP is
equal to 10log(0.01) + 2dB = -18dBW. The path loss is 20log(4πd/λ) = 118.5dB. With a
receive antenna gain of 2dB the received power is -18dBW -118dB + 2dB = -135dBW.
The receiver noise temperature is calculated as 290K*(NF-1) where NF = 105/10. The
resulting noise temperature is TR = 627K or 27.97dBK. The noise power spectral density
is -228.6dB/Hz/K (Boltzman’s Constant) + TR +TA where TA is antenna noise
2. temperature. Since I didn’t specify this value, you could assume that it is zero (normally
it should assumed to be approximately 290K). Thus, the noise PSD is -201dBW/Hz.
From Figure 1, (the plot of the probability of error versus Eb/No for 8-PSK) we can see
that an Eb/No of 13.2dB is required. The received Eb/No is then 13.2dB = -135dBW -
10log(Rb) + 201dBW/Hz. Solving for Rb results in
10log(Rb) = -13.2dB - 135dBW + 201dBW/Hz
= 52.9dB b/s
Rb = 195 kbps
Transmit Power 0.01W -20 dBW
Transmit Antennna Gain 2 dB
EIRP -18 dBW distance 10000 m
Path Loss 7.113E+11 118.5 dB frequency 2 GHz
wavelength 0.149 m
Receive Antenna Gain 2 dB
PL
Received Power -135 dBW exponent 2
Noise Figure 5 dB
Noise Temp 627.06052 27.97 dBK
Noise PSD -201 dBW/Hz -228.6 dBW/Hz/K
Bit Rate 195000 52.9 dB b/s
Energy Per Bit -187 dBJ
Received Eb/No 13.2 dB
Required Margin
Required Eb/No 13.2 dB
3. -1
10
-2
10
Probability of Bit Error
-3
10
-4
10
-5
10
0 5 10 15
E b/No (dB)
Figure 1: Probability of Error for 8-PSK
4. 3 An engineer in your group has found an error correction coding chip that will provide
your system with 3dB of gain at the target error rate. Using the same system as in (2)
determine the data rate that is now supported.
With a 3dB coding gain the required Eb/No is reduced to 10.2dB. Thus, the bit rate can
be increased to 390kbps.
Transmit Power 0.01 -20 dBW
Transmit Antennna Gain 2 dB
EIRP -18 dBW distance 10000 m
Path Loss 7.11E+11 118.5205 dB frequency 2 GHz
wavelength 0.149 m
Receive Antenna Gain 2 dB
Received Power -134.52 dBW PL exponent 2
Noise Figure 5 dB
Noise Temp 627.0605 27.97309 dBK
Noise PSD -200.627 dBW/Hz -228.6 dBW/Hz/K
Bit Rate 390000 55.91065 dB b/s
Energy Per Bit -190.431 dBJ
Received Eb/No 10.19579 dB
Required Margin
Required Eb/No 13.2 dB
Coding Gain 3 dB
Required Eb/No with Coding 10.2 dB
5. 4. It turns out that this system will be used to transmit to systems throughout an
entire county. Since there is log-normal shadowing due to the hilly terrain, it is
determined that 10dB of fade margin is required to obtain 95% coverage. Assuming
the same system as in (3) what data rate can be supported?
Due to the 10dB fading margin and the 3dB coding gain, we have a required Eb/No of
20.2dB. In order to achieve this higher Eb/No value we must reduce the data rate to
39kbps as seen below.
Transmit Power 0.01 -20 dBW
Transmit Antennna
Gain 2 dB
1000
EIRP -18 dBW distance 0 m
7.1E+1 118.520 GH
Path Loss 1 5 dB frequency 2 z
wavelengt
h 0.149 m
Receive Antenna Gain 2 dB
PL
Received Power -134.52 dBW exponent 2
Noise Figure 5 dB
627.06 27.9730
Noise Temp 1 9 dBK
- dBW/H -
Noise PSD 200.627 z 228.6 dBW/Hz/K
45.9106
Bit Rate 39000 5 dB b/s
-
Energy Per Bit 180.431 dBJ
20.1957
Received Eb/No 9 dB
Required Margin 10 dB
Required Eb/No 13.2 dB
Coding Gain 3 dB
Required Eb/No with Coding 20.2 dB
6. 5. Which of the two systems listed below requires higher transmit power?
System A System B
Tx Antenna Gain 0 dB 0 dB
Tx Power W W
Path Loss 110 dB 110 dB
Data Rate 10 kbps 1 Mbps
Rx Antenna Gain 2.3 dB 2.3 dB
No -195 dB W/Hz -195 dB W/Hz
Modulation 8-PSK QPSK
Error Rate Required 0.001 0.01
Fading Margin 10 dB 10 dB
2 ⎛ 0.88Eb ⎞
We know that the performance of System A (8-PSK) is Pe = Q ⎜ ⎟ . From the
3 ⎜ ⎝ No ⎟ ⎠
Q-function table we find that Q(3.1)=0.001. Solving for Eb/No results in a 10dB
⎛ 2 Eb ⎞
requirement. For System B, since we are using QPSK, Pe = Q ⎜ ⎜ N ⎟ . Further, since
⎟
⎝ o ⎠
the target is 0.01, our required Eb/No falls to 4.3dB. Thus, System A requires 5.7dB more
Eb/No . Now, all terms in the link budget are identical except data rate. Since System B
has a data rate which is 100 times that of System A, it will require 100 times more
received power to achieve the same Eb/No. Thus, while System B requires a smaller
Eb/No value, it has a 20dB higher data rate. Since all other things are equal, System B
will require 20dB-5.7dB = 14.3dB more transmit power than System A.
7. 6. Consider the following constellation diagram
y(t) = sqrt(2/T)sin(ωt)
s1(t) s2(t)
1
0.5
1 2
x(t) = sqrt(2/T)cos(ωt)
-0.5
-1 s4(t) s3(t)
(a) Derive the probability of bit error in terms of Eb/No assuming that all symbols are
equally likely, that symbol errors are dominated by nearest neighbors, and that Gray
coding is used.
The probability of symbol error can be written as
4
Ps = ∑ Pr {s = i} Pr {e s = i}
i =1
1 4
= ∑ Pr {e s = i}
4 i =1
Since all of the symbols have the same number of nearest neighbors which are the same
distance away, we can simplify the expression as
1 4
Ps = ∑ Pr {e s = i}
4 i =1
⎛ d ⎞
= 2Q ⎜ ⎟
⎜ 2N ⎟
⎝ o ⎠
where d is the distance between adjacent symbols. Now, substituting d = 2,
8. ⎛ d ⎞
Ps = 2Q ⎜
⎜ 2N ⎟ ⎟
⎝ o ⎠
⎛ 2 ⎞
= 2Q ⎜ ⎟
⎜ 2N ⎟
⎝ o ⎠
⎛ 2 ⎞
= 2Q ⎜
⎜ N ⎟ ⎟
⎝ o ⎠
In order to put this in terms of Eb/No, we must find the average energy per symbol
(assuming that T=1):
T 4
Es = ∑ Pi
4 i =1
1
= {1 + 1 + 5 + 5}
4
=3
Thus,
⎛ 2 ⎞
Ps = 2Q ⎜
⎜ N ⎟⎟
⎝ o ⎠
⎛ 2 Es ⎞
= 2Q ⎜
⎜ 3N ⎟
⎟
⎝ o ⎠
⎛ 4 Eb ⎞
= 2Q ⎜
⎜ 3N ⎟
⎟
⎝ o ⎠
Now, since Gray coding is used, Pb =1/2*Ps. Thus,
Ps
Pb =
2
⎛ 4 Eb ⎞
= Q⎜
⎜ 3N ⎟
⎟
⎝ o ⎠
9. (b) (10 points) An analog message signal with uniform distribution and bandwidth
10kHz is to be digitized assuming Nyquist sampling and transmitted using the
modulation scheme above. The receiver noise power spectral density is found to be No =
-200dBW/Hz and due to range considerations the maximum receive power is limited to
Pr =-135dBW (note that Eb = PrTb where Tb is the bit duration in seconds). Using the
expression derived above, determine the maximum quantization SNR when the
probability of error is required to be equal to or below 10-3.
The required Eb/No is found as
⎛ 4 Eb ⎞
Pb = Q ⎜
⎜ ⎟
⎟
⎝ 3N o ⎠
⎛ 4 Eb ⎞
0.001 = Q ⎜
⎜ ⎟
⎝ 3N o ⎟
⎠
4 Eb
3.1 =
3N o
Eb
= 7.2
No
or 8.6dB. Now, Eb/No is found from
Eb
(dB) = Pr (dB) − Rb (dB) − N o (dB)
No
Eb
Rb (dB) = − (dB) + Pr (dB) − N o (dB)
No
= 56.4dB
which corresponds to 439kbps. Assuming Nyquist sampling, fs = 20kHz. Thus,
Rb
n≤
fs
439kbps
≤
20kHz
≤ 21.9
Since the quantization improves 6dB per quantization bit and we have 21 bits, the
quantization SNR is 126dB.
10. 7. Link Budgets - Consider a system which has a transmit power of 40mW, a transmit
antenna gain of 5dB, a receive antenna gain of 8dB, a path loss of 90dB, a required
fading margin of 5dB and the noise power spectral density is measured as -195dBW/Hz.
The required error rate is 0.1%. Further, assume raised cosine pulse shaping with a roll-
off factor of a = 0.25 and a matched filter receiver. The system bandwidth is limited to
500kHz. What is the maximum achievable data rate with this system? (You need only
consider BPSK, QPSK, and 8-PSK modulation schemes).
There are two limits in this problem, energy and bandwidth. The bandwidth limits are
easier, so we can tackle them first. With raised cosine pulse shaping, the maximum
supportable data rate is
Rb = r * Rs
B
= r*
1+ α
= r * 400ksps
Thus, due to bandwidth considerations we are limited to 400kbps, 800kbps, and 1.2Mbps
when using BPSK, QPSK, and 8-PSK respectively.
Now concerning energy limitations:
Eb
= Pt (dB) + Gt (dB ) − L p ( dB) + Gr ( dB) − Rb (dB ) − N o (dB) − M (dB)
No
= −14dBW + 5dB − 90dB + 8dB − Rb (dB) + 195dBW / Hz − 5dB
= 99dB − Rb (dB)
The 0.001 error rate means that we require an Eb/No of 6.75dB for BPSK or QPSK and
an Eb/No of 10dB for 8-PSK. Using these values we can find that the data rates are
limited to 1.6Gbps for BPSK and QPSK and 780Mbps for 8-PSK due to energy concerns.
Combining the two sets of limitations, we can see that the best data rate achievable is
1.2Mbps with 8-PSK.