HEED - Home Energy Efficient Design

n this Hands-On workshop participants will learn how to design high performance homes that operate with minimum energy consumption, operation costs, and generation of green house gases. Participants will learn how to quickly design and fine-tune homes using the latest version of HEED (Home Energy Efficient Design). If attendees bring their laptop, MAC or PC, they will be able to install this software for a hand’s on learning experience. Users can input their own designs using HEED’s fill-in-the-squares multi-story floor planner and click and drag window placement. The program then generates graphic plots of Annual Energy Consumption (kBTU), Carbon Footprint (CO2), or Annual Cost for Fuel and Electricity, among many other analysis images. Audience Level: Architects, builders, energy consultants, homeowners, educators, and students with all levels of experience.

Recomendados
Recomendados
Más contenido relacionado
La actualidad más candente
La actualidad más candente (20)
Destacado
Destacado (19)
Similar a HEED - Home Energy Efficient Design
Similar a HEED - Home Energy Efficient Design (20)
Más de Center for Sustainable Energy
Más de Center for Sustainable Energy (20)
Último
Último (20)
HEED - Home Energy Efficient Design
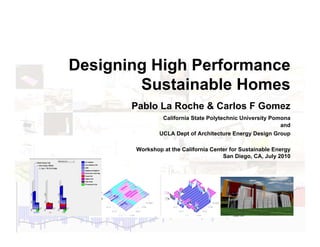
- 1. Designing High Performance Sustainable Homes Pablo La Roche & Carlos F Gomez California State Polytechnic University Pomona and UCLA Dept of Architecture Energy Design Group Workshop at the California Center for Sustainable Energy San Diego, CA, July 2010 Energy Center San Diego 2010
- 2. Introduction & loading HEED 10 minutes HEED: How does it work? 60 minutes Design with HEED 60 minutes Advanced Ideas 10 minutes Climate Consultant 20 minutes Comparison of projects 10 minutes Additional Q & A 10 minutes HEED Workshop schedule Energy Center San Diego 2010
- 3. HEED Energy Center San Diego 2010
- 4. Why is HEED important? 1. It reduces energy costs for the homeowner 2. It improves building performance 3. It helps reduce building effects on Climate Change Energy Center San Diego 2010
- 5. Climate Change Global climate change is the single biggest environmental threat facing the planet. Energy Center San Diego 2010
- 6. Architecture affects climate change Energy Center San Diego 2010
- 7. Because climate change is linked to CO2 levels. Global Temperature and CO2 Levels Over the Past 450,000 Years Source: UN Intergovernmental Panel on Climate Change (IPCC), Third Assessment Report, Climate Change 2001 Energy Center San Diego 2010
- 8. ...with 76% of all plant generated electricity used just to operate buildings. Source: ARCHITECTURE 2030 U.S. Energy Information Administration statistics. Graphic US CO2 Emissions Published first in Metropolis Magazine, October 2003 Issue. …..and the energy needed to build and operate buildings usually releases CO2. Energy Center San Diego 2010
- 9. How do we reduce our impact? Designing low energy buildings. Energy Center San Diego 2010
- 10. A large portion of GHG emissions originate from building operation. HEED can help to reduce these emissions. Energy Center San Diego 2010
- 11. It analyzes buildings to determine their performance. HEED How does it work? Energy Center San Diego 2010
- 12. To help you to design cost effective, low energy, carbon neutral buildings Energy Center San Diego 2010
- 13. HEED, Home Energy Efficient Design, is an energy analysis tool that calculates a building’s performance. When HEED is first launched it asks four questions about the project (building type, square footage, number of stories, and climate location) and with this information it creates Scheme 1, a building that meets the California Energy Code. It then designs a second Scheme that is usually about 30% better. Next it suggests other strategies that designers can test using the remaining seven schemes. HEED makes it very easy for users to change any aspect of the building’s design and after each design change HEED shows how the building’s performance compares with the initial schemes. What is HEED? Energy Center San Diego 2010
- 14. 1. To show you how to use HEED to design a Basic Residential Building 2. To show you how HEED reports site energy use and CO2 Production with each design change you make. 3. To show you concepts of energy efficient buildings using HEED’s advanced graphic evaluation tools 4. To give EACH of you a chance to use HEED on your own 5. To introduce other tools 6. To end by showing how well each of your designs compare. Specific objective Energy Center San Diego 2010
- 15. When you install the HEED disk on your laptop it will automatically begin loading... Energy Center San Diego 2010
- 16. Whenever you are in doubt about what to do next…Click ”next” to continue Next it will show you the tutorial Energy Center San Diego 2010
- 17. Energy Center San Diego 2010
- 18. Energy Center San Diego 2010
- 19. Energy Center San Diego 2010
- 20. Energy Center San Diego 2010
- 21. Using HEED to Design a Basic Residential Building 1. Start in the ‘Initial Design’ screen by giving Four Facts about your home: • Building Type • Square Footage • Number of Stories • Zipcode or Location. 2. Using this data, HEED will automatically design two basecase buildings: Scheme 1 that meets the Energy Code Scheme 2 that is more Energy Efficient. 3. It will COPY Scheme 2 and ask you to revise it to create your own design. 4. Every few minutes COPY your Scheme and keep on improving your design. 5. Try to make its Energy Costs less than the basecase designs. Energy Center San Diego 2010
- 22. Energy Center San Diego 2010
- 23. On Initial Design Screen, Answer These Questions Energy Center San Diego 2010
- 24. … HINT: Start with 2 or 3 stories because it is easier to remove stories than add them Energy Center San Diego 2010
- 25. For Other Climates.… To load in climate data for any station outside California, click on Help at the Climate screen or see the READ- USA.TXT file in the c:heed…docs folder It explains how HEED can directly read EnergyPlus Weather for over 1000 stations around the world From the HEED web site, click on the EnergyPlus site, then select the city you wish. Click on the EPW format option then Save This Page into the c:heed…solar5…tmy folder Now go back to HEED’s ‘Initial Design’ screen and click the down arrow on the Location line Energy Center San Diego 2010
- 26. Energy Center San Diego 2010
- 27. With the initial data HEED automatically creates two buildings Energy Center San Diego 2010
- 28. Scheme 1: Scheme 2: CODE MINIMUM DESIGN ENERGY EFFICIENT DESIGN •Square floor plan •Rectangular floor plan facing South •Equal area of glass on each wall •Most glass on South, min. on E &W •Windows tinted as required by •Often clear glass on South and code North •No window shading •Overhangs shading South Windows •Stud and Stucco walls •High mass walls, exterior insulation •Raised wood floor •Slab on grade floor, carpet or tile •Code required air change •Whole-house Fan, 10 air changes/hr infiltration •Lights are mostly fluorescent •Lights are mostly incandescent Both Schemes have the same: Floor area, Window area, Climate, Occupancy Schedules Energy Center San Diego 2010
- 29. Click Next Then it asks you to Copy and Re-Name Scheme 2 Energy Center San Diego 2010
- 30. You create your first design You now have the option to add PV systems Energy Center San Diego 2010
- 31. HEED gives some advice for low energy design Energy Center San Diego 2010
- 32. Now begin changing your new Scheme 3 to your own design Energy Center San Diego 2010
- 33. HEED gives you much useful information Energy Center San Diego 2010
- 34. Click Next or Back Navigating HEED Energy Center San Diego 2010
- 35. You can use the BASIC Design options to do work quickly... ……..…… but………..…. at any point you can switch to HEED’s ADVANCED Design Data Input Options or HEED’s Advanced EVALUATION Graphic Output options... Energy Center San Diego 2010
- 36. To define any term on your current screen Click on HELP Energy Center San Diego 2010
- 37. HEED Energy Center San Diego 2010
- 38. Click on the ‘Basic’ icon to see Basic Design Options Energy Center San Diego 2010
- 39. then click Next The initial building can then be used to modify your building by following a step by step process Energy Center San Diego 2010
- 40. HEED gives some advice for low energy design Energy Center San Diego 2010
- 41. Draw in your own Floorplan by Filling-the-Squares Energy Center San Diego 2010
- 42. Click and Rotate your House to its correct Orientation Energy Center San Diego 2010
- 43. Checklists let you Describe your Home’s Construction Define your windows Energy Center San Diego 2010
- 44. To Change To add new dimensions Windows or doors Click and drag to change sizes To add or modify windows… Energy Center San Diego 2010
- 45. Drag and Drop Windows/Doors to Exact Location Energy Center San Diego 2010
- 46. Define the window types Energy Center San Diego 2010
- 47. Define the insulation levels Energy Center San Diego 2010
- 48. Checklists let you Describe your Home’s Construction Energy Center San Diego 2010
- 49. Define the Roof Insulation Energy Center San Diego 2010
- 50. Define the Floor Construction Energy Center San Diego 2010
- 51. Define ventilation and infiltration rates Energy Center San Diego 2010
- 52. Define heating and cooling systems Energy Center San Diego 2010
- 53. Define shading systems Energy Center San Diego 2010
- 54. Define appliances Energy Center San Diego 2010
- 55. Economics Energy Center San Diego 2010
- 56. Summary Table Energy Center San Diego 2010
- 57. HEED provides many graphical analysis tools HEED Energy Center San Diego 2010
- 58. HEED has over three dozen different Advanced Evaluation Graphic Output options Energy Center San Diego 2010
- 59. Many of these can be viewed in a 3d image that shows whole-year performance Energy Center San Diego 2010
- 60. Or traditional bar charts that show how each of your Schemes Compare with Schemes 1 and 2 Energy Center San Diego 2010
- 61. This same Bar Chart can be plotted in terms of Site Energy or CO2 Production, in Pounds or in Pounds per Square foot Energy Center San Diego 2010
- 62. Almost everything you touch in HEED either gives you more data or moves to show more information Energy Center San Diego 2010
- 63. The ‘Energy Efficient Design’ screen shows the number of hours the building runs Passively (green) and also gives the top ten Design Guidelines for this climate Energy Center San Diego 2010
- 64. 3D Graphic Plots can show the comparison of any pair of components within a Scheme Energy Center San Diego 2010
- 65. … or click on the menu and ‘Capture a Snapshot’to compare with any component in any other Scheme Energy Center San Diego 2010
- 66. … here for Scheme 9 the Air Conditioner has been ‘Captured’ and is compared to the Outdoor Temperature Energy Center San Diego 2010
- 67. The Hourly Bar Chart shows which components need your design attention and which do not Energy Center San Diego 2010
- 68. The BEPS screen shows quantitative data for various measures of Building Energy Performance Energy Center San Diego 2010
- 69. Fuel and Electric Charges are available for 5 California Utilities, or you can input your own utility rates Energy Center San Diego 2010
- 70. This Comparison screen shows how Site Energy and CO2 Production compare for all nine schemes… Energy Center San Diego 2010
- 71. HEED Advanced Design Energy Center San Diego 2010
- 72. There are more than a dozen different Advanced Design Data Input Options The advanced menus permit to modify the information that was introduced in the basic screens. You can modify information related to climate, windows, walls, thermal mass, HVAC system, pollution, etc.. The following screens show some examples of these options. Energy Center San Diego 2010
- 73. The advanced climate option permits you to zoom in the performance of 12 days instead of 12 months Energy Center San Diego 2010
- 74. For 12- Day Plots.… To look at any individual hour of the year, you can “zoom in” on any 12-day segment you choose from the Climate Data screen For Example July 4 Energy Center San Diego 2010
- 75. For 12- Day Plots.… In this case the Outdoor Temperature reached 92º on July 9… But on most nights the Whole House Fans tried to cool down the interior. Energy Center San Diego 2010
- 76. Envelope permits to change roof and volume properties Energy Center San Diego 2010
- 77. Surface area permits to change material characteristics Energy Center San Diego 2010
- 78. Windows and doors permits to modify some of their characteristics directly Energy Center San Diego 2010
- 79. New in this version is the design of a PV system Energy Center San Diego 2010
- 80. HEED Energy Center San Diego 2010
- 81. The library pull down menu is where you select schemes or projects to work on. A project is a distinctive design in a given location. Schemes are different iterations and variations of a project in which you evaluate the performance of different ideas. You can have up to 9 schemes per project of which the first two are automatically generated. Energy Center San Diego 2010
- 82. PLEASE every few minutes click on Library... …and make a copy of your current scheme in order to create a new scheme…. and try out new design options that you think will improve its performance… Each time check back on ‘Energy Costs’ under the ‘Basic’ icon to see how well your newest scheme is doing Energy Center San Diego 2010
- 83. Energy Center San Diego 2010
- 84. How to do your own design: 1. Answer the questions on Initial Design, under Basic Design 2. When in doubt, click ‘Next’ 3. Regularly Click on Library and ‘Copy’ to create new designs 4. To see how your designs Perform, Click on Energy Costs 5. To Start with a new Project, click on Library, then Projects Energy Center San Diego 2010
- 85. Energy Center San Diego 2010
- 86. HEED’s advanced evaluation options can help you visualize graphically... Concepts of High Performance Buildings 1. Good Passive Buildings have Saddle Shaped Plots 2. Bad Passive Buildings have lots of Heat Mountains 3. High Mass Walls cause Time Lags in Heat Gain/Loss 4. Economizer Bowl shows the Free Cooling with Outdoor Air 5. Daylight Canyon shows the Electric Lighting displaced by Good Design 6. Powerful Tools help you create High Performance Buildings Energy Center San Diego 2010
- 87. 1. Good Passive Buildings have Saddle Shaped Plots 1. Good Passive Buildings have Saddle Shaped Plots (South Windows Gain more heat in Winter than in Summer, (South Windows Gain more heat in Winter than in Summer, well shaded windows flatten off summer mid-day gains) well shaded windows flatten off summer mid-day gains) Energy Center San Diego 2010
- 88. 2. Heat Mountains contribute to poor Building Performance 2. Heat Mountains contribute to poor Building Performance (for example, West Windows Gain most Heat in Mid-Afternoon in Mid-Summer) (for example, West Windows Gain most Heat in Mid-Afternoon in Mid-Summer) Energy Center San Diego 2010
- 89. 3. High Mass Walls create Time Lags in Heat Gain/Loss 3. High Mass Walls create Time Lags in Heat Gain/Loss (Mass in the Envelope can delay afternoon gain until late at night, (Mass in the Envelope can delay afternoon gain until late at night, while Mass in the Interior can help store heat until the next day) while Mass in the Interior can help store heat until the next day) Energy Center San Diego 2010
- 90. 4. Economizer Bowl shows the Free Cooling with Outdoor Air 4. Economizer Bowl shows the Free Cooling with Outdoor Air (a Smart Thermostat runs a Whole-House Fan to bring in cool night air, (a Smart Thermostat runs a Whole-House Fan to bring in cool night air, interior mass stores “coolth” for the next day: “get a handle on the Bowl”) interior mass stores “coolth” for the next day: “get a handle on the Bowl”) Energy Center San Diego 2010
- 91. 5. Daylight Canyon shows Electric Light not used by Good Design 5. Daylight Canyon shows Electric Light not used by Good Design (shallow rooms with tall wide windows will make the canyon deeper and (shallow rooms with tall wide windows will make the canyon deeper and wider) wider) Energy Center San Diego 2010
- 92. 6. Air Conditioner Energy can be Almost Eliminated 6. Air Conditioner Energy can be Almost Eliminated (powerful Tools help create High Performance Buildings) (powerful Tools help create High Performance Buildings) Energy Center San Diego 2010
- 93. Total Energy Costs are the sum of Electricity (air conditioner, lights, Total Energy Costs are the sum of Electricity (air conditioner, lights, fans, and appliances) and Fuel (heating, cooking, DHW) fans, and appliances) and Fuel (heating, cooking, DHW) Energy Center San Diego 2010
- 94. Click ‘Next’ and it will give Site Energy in kBTU/sq.ft. and CO2 Production in Lbs/sq.ft. for all nine schemes Energy Center San Diego 2010
- 95. Architecture 2030, a non-profit, non-partisan and independent organization, was established in response to the global-warming crisis by architect Edward Mazria in 2002. 2030’s mission is to rapidly transform the US and global Building Sector from the major contributor of greenhouse gas emissions to a central part of the solution to the global- warming crisis. http://www.architecture2030.org/ Energy Center San Diego 2010
- 96. The 2030 Challenge Credible scientists give us 10 years to be well on our way toward global greenhouse gas (GHG) emissions reductions in order to avoid catastrophic climate change. Yet there are hundreds of coal-fired power plants currently on the drawing boards in the US. Seventy-six percent (76%) of the energy produced by these plants will go to operate buildings. Buildings are the major source of demand for energy and materials that produce by-product greenhouse gases (GHG). Slowing the growth rate of GHG emissions and then reversing it over the next ten years is the key to keeping global warming under one degree centigrade (°C) above today's level. It will require immediate action and a concerted global effort. To accomplish this, Architecture 2030 has issued The 2030 Challenge asking the global architecture and building community to adopt the following targets: All new buildings, developments and major renovations shall be designed to meet a fossil fuel, GHG-emitting, energy consumption performance standard of 50% of the regional (or country) average for that building type. At a minimum, an equal amount of existing building area shall be renovated annually to meet a fossil fuel, GHG- emitting, energy consumption performance standard of 50% of the regional (or country) average for that building type. The fossil fuel reduction standard for all new buildings and major renovations shall be increased to: 60% in 2010 70% in 2015 80% in 2020 90% in 2025 Carbon-neutral in 2030 (using no fossil fuel GHG emitting energy to operate). These targets may be accomplished by implementing innovative sustainable design strategies, generating on-site renewable power and/or purchasing (20% maximum) renewable energy and/or certified renewable energy credits. http://www.architecture2030.org/2030_challenge/index.html 2030 challenge Energy Center San Diego 2010
- 97. This table tells you emissions reduction (%) for 2030 challenge This example shows that compared to the Scheme 1 Basecase, Scheme 9 uses only 58.13% of the Site Energy and produced only 54.14% of the CO2… (so it is almost there) Energy Center San Diego 2010
- 98. The ‘Economics’ screen will Calculate the Payback of Each Scheme Annual Savings Estimated Cost of Years to Pay Back Energy vs. Improvements Annual Energy Savings Cost Scheme 3 DIY Contracted DIY Contracted 3. As Built in 1960 $ 4066 - - - 4. Weather-Stripping $ 3950 $ 116 $ 200 $ 500 2 5 5. Hi Efficiency A/C $ 3601 $ 465 $ 2500 $ 4000 5 9 6. Double Pane Tinted $ 3377 $ 689 - $ 8000 - (12) 7. Shade Patio Sliders $ 3233 $ 833 $ 800 $ 1600 1 2 8. Attic Insulation $ 2977 $ 1089 $ 1000 $ 2000 1 2 9. Combine 4+5+7+8 $ 2244 $ 1811 $ 4500 $ 8000 2.5 4.5 years years Energy Center San Diego 2010
- 99. Validation : method used in DOE’s new EnergyPlus) • HEED calculates an Hourly Heat-Balance for all 8760 hours of the year (similar to the • HEED has been validated against DOE-2 and others programs, using BESTEST (the ASHRAE Standard 140-2001). Results are posted on web site. • HEED accommodates single zone buildings up to 4,600 s.f. per floor • HEED accommodates energy-efficient design strategies such as: natural ventilation, daylighting, external shading, smart HVAC controls, thermal mass, passive solar heating, night flushing, economizer cycles • HEED uses electric rate structures for the four major utilities, but you can input electric, gas, oil, or propane rates for your own utility • HEED has a huge Help system to answer your questions (click the Help icon), Advice, Getting Started Tutorial, an on-line Demo, and a basic Users Manual. Energy Center San Diego 2010
- 100. Climate Consultant & other tools Energy Center San Diego 2010
- 101. Climate Consultant analyzes over 1000 stations worldwide Energy Center San Diego 2010
- 102. Climate Consultant identifies best design strategies Energy Center San Diego 2010
- 103. OPAQUE calculates U, R, timelag, and decrement Energy Center San Diego 2010
- 104. SOLAR-2 evaluates window and sunshade designs Energy Center San Diego 2010
- 105. HEED en español! Energy Center San Diego 2010
- 106. HEED Additional Q & A Energy Center San Diego 2010
- 107. Comparison of Results (yearly cost) 3,000 2,500 Energy Use 2,000 1,500 1,000 500 0 Base Case More name name name name name name name name name name name name - Meets Energy Energy Efficient Code Participants Cost of Energy Total (dollars/year) HEED Project comparison Energy Center San Diego 2010
- 108. HEED Contacts for help Energy Center San Diego 2010
- 109. HEED can be downloaded at no cost from: www.energy-design-tools.aud.ucla.edu/heed Our other Design Tools can be downloaded from www.energy-design-tools.aud.ucla.edu/ Contact Murray Milne at: milne@ucla.edu Pablo La Roche at: pmlaroche@csupomona.edu Carlos F. Gomez: cfg83@earthlink.net The current version of HEED was funded by the California Energy Commission. It was developed by the Energy Design Tools Group at the UCLA Department of Architecture with the cooperation of Bill Beckman at the University of Wisconsin. Energy Center San Diego 2010
- 110. HEED Some more references Energy Center San Diego 2010
- 111. Informes de la Construccion, January 2010 http://informesdelaconstruccion.revistas.csic.es/index.php/informesdelaconstruccion/article/view/808/894 Solar Today, May 2010 http://www.solartoday-digital.org/solartoday/201005#pg44 HEED Technical Papers: http://www.energy-design-tools.aud.ucla.edu/papers.html Energy Center San Diego 2010
- 112. Solar Today: http://ases.org/index.php?option=com_content&view=article&id=1076&Itemid= 23 Energy Center San Diego 2010