Debt mutual funds - Is the time of super returns over for the time being?
•
1 recomendación•495 vistas


Recomendados
Más contenido relacionado
La actualidad más candente
La actualidad más candente (20)
Destacado
Destacado (9)
Similar a Debt mutual funds - Is the time of super returns over for the time being?
Similar a Debt mutual funds - Is the time of super returns over for the time being? (20)
Más de Dhuraivel Gunasekaran
Más de Dhuraivel Gunasekaran (20)
Último
Último (20)
Debt mutual funds - Is the time of super returns over for the time being?
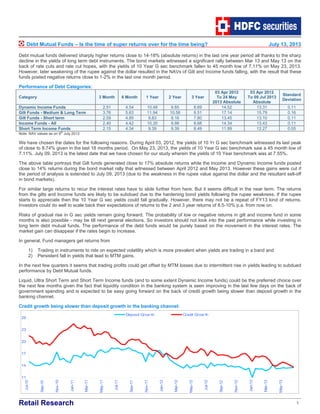
- 1. Retail Research 1 Debt Mutual Funds – Is the time of super returns over for the time being? July 13, 2013 Debt mutual funds delivered sharply higher returns close to 14-18% (absolute returns) in the last one year period all thanks to the sharp decline in the yields of long term debt instruments. The bond markets witnessed a significant rally between Mar 13 and May 13 on the back of rate cuts and rate cut hopes, with the yields of 10 Year G sec benchmark fallen to 45 month low of 7.11% on May 23, 2013. However, later weakening of the rupee against the dollar resulted in the NAVs of Gilt and Income funds falling, with the result that these funds posted negative returns close to 1-2% in the last one month period. Performance of Debt Categories: Category 3 Month 6 Month 1 Year 2 Year 3 Year 03 Apr 2012 To 24 May 2013 Absolute 03 Apr 2012 To 09 Jul 2013 Absolute Standard Deviation Dynamic Income Funds 2.51 4.54 10.48 9.85 8.69 14.52 13.31 0.11 Gilt Funds - Medium & Long Term 3.76 5.63 11.94 10.58 8.51 17.14 15.79 0.16 Gilt Funds - Short term 2.59 4.85 9.83 9.16 7.80 13.45 13.10 0.11 Income Funds - All 2.40 4.42 10.30 9.98 8.68 14.34 13.43 0.11 Short Term Income Funds 2.15 4.34 9.39 9.39 8.49 11.89 12.27 0.05 Note: NAV values as on 9th July 2013. We have chosen the dates for the following reasons. During April 03, 2012, the yields of 10 Yr G sec benchmark witnessed its last peak of close to 8.74% given in the last 18 months period. On May 23, 2013, the yields of 10 Year G sec benchmark saw a 45 month low of 7.11%. July 09, 2013 is the latest date that we have chosen for our study wherein the yields of 10 Year benchmark was at 7.55%. The above table portrays that Gilt funds generated close to 17% absolute returns while the Income and Dynamic Income funds posted close to 14% returns during the bond market rally that witnessed between April 2012 and May 2013. However these gains were cut if the period of analysis is extended to July 09, 2013 (due to the weakness in the rupee value against the dollar and the resultant sell-off in bond markets). For similar large returns to recur the interest rates have to slide further from here. But it seems difficult in the near term. The returns from the gilts and Income funds are likely to be subdued due to the hardening bond yields following the rupee weakness. If the rupee starts to appreciate then the 10 Year G sec yields could fall gradually. However, there may not be a repeat of FY13 kind of returns. Investors could do well to scale back their expectations of returns to the 2 and 3 year returns of 8.5-10% p.a. from now on. Risks of gradual rise in G sec yields remain going forward. The probability of low or negative returns in gilt and income fund in some months is also possible - may be till next general elections. So investors should not look into the past performance while investing in long term debt mutual funds. The performance of the debt funds would be purely based on the movement in the interest rates. The market gain can disappear if the rates begin to increase. In general, Fund managers get returns from 1) Trading in instruments to ride on expected volatility which is more prevalent when yields are trading in a band and 2) Persistent fall in yields that lead to MTM gains. In the next few quarters it seems that trading profits could get offset by MTM losses due to intermittent rise in yields leading to subdued performance by Debt Mutual funds. Liquid, Ultra Short Term and Short Term Income funds (and to some extent Dynamic Income funds) could be the preferred choice over the next few months given the fact that liquidity condition in the banking system is seen improving in the last few days on the back of government spending and is expected to be easy going forward on the back of credit growth being slower than deposit growth in the banking channel. Credit growth being slower than deposit growth in the banking channel: 11 14 17 20 23 26 Jul-10 Sep-10 Nov-10 Jan-11 Mar-11 May-11 Jul-11 Sep-11 Nov-11 Jan-12 Mar-12 May-12 Jul-12 Sep-12 Nov-12 Jan-13 Mar-13 May-13 Deposit Grow th Credit Grow th
- 2. Retail Research 2 All eyes are on plunging of Rupee against the dollar. The rupee hit all-time low of 61.21 on 7th July 2013. The returns from the gilts and Income funds are likely to be subdued due to the hardening bond yields following the rupee plunge. If the rupee starts to appreciate then the 10 Year G sec yields could fall gradually. At present, the 10-year G-sec yield is hovering in the range of 7.5% level. Given the moderation in the inflation, even though the RBI is willing to shift its stance from anti inflation to pro growth, further rate cut is unlikely in the near term as the rupee could take time to rise sustainably against the dollar. Dollar has been strongest among major currencies at this point of time (as reflected by the Dollar index) as the US economy is showing signs of steady growth hence the strength in the USD is likely to continue. From the above, one can assume that the RBI is unlikely to cut policy rates by more than only 25 to 50 bps in 2013-14 and that too earliest in Q3FY14 and the central bank to maintain status quo in the forthcoming policy meeting scheduled in July 30, 2013. Conclusion: Hence, short term income funds that are managed with 2-3 years Average Maturity may be the right bet in the current scenario for any kind of investors while the investors who wish to stay investing for more than 18 months or two years or more can consider Income funds, Dynamic Income funds and Gilt funds (although with reduced expectations). Selective Dynamic funds which are managed actively can be suitable for medium risk appetite investors for medium term say for one year period as these funds are flexible to manage duration and choose between corporate and government bonds. Investors those who do not want MTM risk can choose Ultra Short term funds as they are low risk low return products. 10 Year G sec yields Vs. WPI Inflation & Repo Rate: Clear correlation seen among these three -2 0 2 4 6 8 10 12 Sep-08 Dec-08 Mar-09 Jun-09 Sep-09 Dec-09 Mar-10 Jun-10 Sep-10 Dec-10 Mar-11 Jun-11 Sep-11 Dec-11 Mar-12 Jun-12 Sep-12 Dec-12 Mar-13 5 6 6 7 7 8 8 9 9 10WP I R epo R ate 10 Y (R H S) USD/INR Vs. 10 Year Gsec Yield: 40 45 50 55 60 65 Jul-09 Sep-09 Nov-09 Jan-10 Mar-10 May-10 Jul-10 Sep-10 Nov-10 Jan-11 Mar-11 May-11 Jul-11 Sep-11 Nov-11 Jan-12 Mar-12 May-12 Jul-12 Sep-12 Nov-12 Jan-13 Mar-13 May-13 Jul-13 USD/INR 6.0 6.5 7.0 7.5 8.0 8.5 9.0 10YrGsecyields USD/INR 10 Year G SecYields (RHS) Average Maturity: The Average maturity chart below reveals that despite persistent moderation seen in WPI, the debt mutual funds cut their Average Maturity in March 2013 due to profit booking. Investors booked their MTM gains from debt categories across the board given the skepticism/doubt over the fall of G sec yields below 7.50% range. However, Mutual Funds increased their portfolio duration during April
- 3. Retail Research 3 2013 and cut again in May month as the inflation numbers remained stubborn. Weakness in Rupee against the dollar also weighed on the market sentiments. Average Maturity (monthly) of Debt fund categories: 0 20 40 60 80 100 120 140 160 Jan-12 Feb-12 Mar-12 Apr-12 May-12 Jun-12 Jul-12 Aug-12 Sep-12 Oct-12 Nov-12 Dec-12 Jan-13 Feb-13 Mar-13 Apr-13 May-13 Gilt - LT Short Term Income Income - All Dynamic Income Corporate Spread: The below chart shows that the fall in spread of AAA corporate bonds vs. Gilts in December 2012 led to MTM gains for debt mutual funds. Between December 12 and March 13, as the spread started to rise, the mutual funds increased their exposure to the corporate papers, but with reduced duration. Playing on Corporate Spreads: AAA corporate bonds vs. Gilts 50 70 90 110 130 150 170 190 Jun-12 Jul-12 Aug-12 Sep-12 Oct-12 Dec-12 Jan-13 Mar-13 Apr-13 May-13 Jun-13 7 8 91 Year AAA 5 Year AAA 10 Year AAA 10 Y Yield (%) (RHS) Allocation into Government securities by debt categories over periods: 0 10 20 30 40 50 60 70 Dec-11 Jan-12 Feb-12 Mar-12 Apr-12 May-12 Jun-12 Jul-12 Aug-12 Sep-12 Oct-12 Nov-12 Dec-12 Jan-13 Feb-13 Mar-13 Apr-13 May-13 6.5 7.0 7.5 8.0 8.5 9.0 G sec holding by Dynamic Income G sec holding by Income funds - All G sec holding by Short Term Income 10 Yr Gsec Yield (RHS) G sec holding rose consistently during the period from Feb 12 to Dec 12 but sharply came off in Mar 13.
- 4. Retail Research 4 Allocation into Corporate debts by Debt categories over periods: 30 35 40 45 50 55 60 Dec-11 Jan-12 Feb-12 Mar-12 Apr-12 May-12 Jun-12 Jul-12 Aug-12 Sep-12 Oct-12 Nov-12 Dec-12 Jan-13 Feb-13 Mar-13 Apr-13 May-13 7.0 7.4 7.8 8.2 8.6 9.0 Corp debt holding by Income funds - All Corp debt holding by Dynamic Income Corp debt holding by Short Term Income 10 Yr Gsec Yield (RHS) Among the debt categories chosen Short term income funds witnessed gradual increase in the allocation into corporate debt. As per the latest data (May 2013) the Average Maturity of the Short term Income category was at 56 months. Analyst: Dhuraivel Gunasekaran (dhuraivel.gunasekaran@hdfcsec.com) RETAIL RESEARCH Fax: (022) 3075 3435 Corporate Office: HDFC Securities Limited, I Think Techno Campus, Building –B, ”Alpha”, Office Floor 8, Near Kanjurmarg Station, Opp. Crompton Greaves, Kanjurmarg (East), Mumbai 400 042 Fax: (022) 30753435 Website: www.hdfcsec.com Disclaimer: Mutual Funds investments are subject to risk. Past performance is no guarantee for future performance. This document has been prepared by HDFC Securities Limited and is meant for sole use by the recipient and not for circulation. This document is not to be reported or copied or made available to others. It should not be considered to be taken as an offer to sell or a solicitation to buy any security. The information contained herein is from sources believed reliable. We do not represent that it is accurate or complete and it should not be relied upon as such. We may have from time to time positions or options on, and buy and sell securities referred to herein. We may from time to time solicit from, or perform investment banking, or other services for, any company mentioned in this document. This report is intended for non-Institutional Clients.