Activity Based Costing
•
8 recomendaciones•3,344 vistas

This document provides an overview of Activity Based Costing (ABC) in 7 phases: 1. Determine cost objects like products, customers, markets. 2. Group cost objects and develop process maps to understand cost flows. 3. Identify overhead and direct costs like salaries, facilities, shipping. 4. Map costs to cost pools and assign drivers like units produced, orders placed. 5. Allocate pool costs to cost objects using the assigned drivers. 6. Verify the economic logic of the cost assignments for accuracy. 7. ABC provides more accurate profitability analysis by customer than traditional methods.

Recomendados
Más contenido relacionado
La actualidad más candente
La actualidad más candente (20)
Destacado
Destacado (20)
Similar a Activity Based Costing
Similar a Activity Based Costing (20)
Más de Flevy.com Best Practices
Más de Flevy.com Best Practices (20)
Último
Último (20)
Activity Based Costing
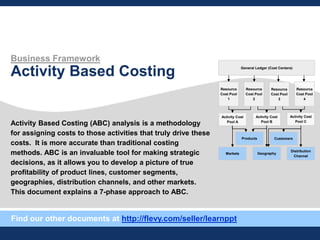
- 1. Business Framework Activity Based Costing Activity Based Costing (ABC) analysis is a methodology for assigning costs to those activities that truly drive these costs. It is more accurate than traditional costing methods. ABC is an invaluable tool for making strategic decisions, as it allows you to develop a picture of true profitability of product lines, customer segments, geographies, distribution channels, and other markets. This document explains a 7-phase approach to ABC. General Ledger (Cost Centers) Resource Cost Pool 1 Resource Cost Pool 2 Resource Cost Pool 3 Resource Cost Pool 4 Activity Cost Pool A Activity Cost Pool B Activity Cost Pool C Markets Geography Distribution Channel Products Customers Find our other documents at http://flevy.com/seller/learnppt
- 2. 3 Contents • Overview - Comparison with Traditional Costing Methods - Advantages and Drawbacks • Approach - Overview - 7 Phases • Example
- 3. 5 Activity Based Costing provides tangibly more accurate costs than traditional costing methods Comparison between ABC and Traditional Costing Methods Activity Based Costing (ABC) Traditional Costing Methods • ABC seeks to correctly assign both direct and indirect costs to the appropriate cost object (e.g. products, customers, geographies, markets, channels) • Traces direct costs correctly to the identified cost objects • Attempts to correct the misallocation of overhead costs by directing them to the correct cost objects • ABC is of greatest use when overhead costs are a significant component of total cost • Traditional costing methods result in inferior cost estimates • Direct costs are traced back to those products that cause cost • Indirect costs are spread across all products based on a standard, volume-based cost driver (e.g. labor hours, weight of raw material, machine hours) • Traditional costing methods overlook product-specific R&D, advertising, distribution/channel, and administration costs • As a result, there is no way to capture different behaviors tied to specific customers or products
- 4. 7 ABC ensures fact-based strategic decisions ABC Advantages Activity Based Costing ensures you make fact-based strategic business decisions. ABC is useful for more accurate strategic decisions in complex, high overhead environments, since strategic decisions require costs estimates by product or customer ABC allows fact-based, profit-oriented decisions to be made (e.g. significant fraction of a firm’s customers might actually be unprofitable, even though the overall firm may be profitable) ABC can facilitate decisions at the “cost object” level (e.g. drop a product line; don’t serve costly segments), at the behavioral / operational level (e.g. institute minimum order quantities; change batch sizes), and at the process level (e.g. improve processes, reduce cost per setup or cost per order) ABC can be used in benchmarking and process improvement, as well as “direct-setting” and performance measurement regarding products, channels, and customers ABC can be used as a financial analysis tool to help value alternatives, which have been identified through other means (e.g. incremental costs of adopting a differentiation strategy, making near-custom products for its customers)
- 5. 9 Contents • Overview - Comparison with Traditional Costing Methods - Advantages and Drawbacks • Approach - Overview - 7 Phases • Example
- 6. 11 Phase 1 Determine the primary “cost objects” under analysis Phase 1 – Overview Develop Cost Objects Group Cost Objects Develop Process Maps Identify Cost Elements Map GL Costs Allocate Costs Verify Economi c Logic • In ABC analysis, the first step is always to determine what the primary cost objects are • A cost object is defined as any end item to which activity costs are assigned and accumulated • These include products, customers, markets, geographies, and distribution channels • Cost objects represent logical separations in the costs of the business • When picking cost objects, it is important to keep them MECE (mutually exclusive and collectively exhaustive) COST OBJECT CATEGORY EXAMPLES Products Product X, Product Line Y, Product Category Z Customers Various ways to define customer groups Markets Various ways to define markets Geographies Countries (e.g. US, China); Regions (e.g. EMEA, APAC) Distribution Channels Direct, Indirect, Physical, Online
- 7. 13 Phase 3 Develop high level process flow maps Phase 3 – Overview Develop Cost Objects Group Cost Objects Develop Process Maps Identify Cost Elements Map GL Costs Allocate Costs Verify Economi c Logic • To create process maps, first, define all major steps required to produce, market, sell, and deliver the products or services to the customer • These steps are your process steps • The concept behind this exercise is to understand how costs flow through the organization to the customer • It may be helpful to utilize a high-level value chain diagram or the company’s supply chain when conducting this analysis • Next, identify primary activities associated with each process step: • Activities as ―primary‖ have a significant impact on the cost of that process step • These activities should be defined at a relatively high level (e.g. customer order is taken, order is processed, order is shipped) • This information can be developed through interviewing people performing the various functions involved in the process It’s important to manage scope when defining process activities, so that you don’t get mired in creating overly complex and detailed process flow maps 1 2
- 8. 15 Cost item $XX Cost item $XX Cost item $XX Cost item $XX Cost item $XX Cost item $XX Cost item $XX Cost item $XX Cost item $XX Cost item $XX Cost item $XX Cost item $XX Cost item $XX Cost item $XX Cost item $XX Cost item $XX Cost item $XX Cost item $XX Cost item $XX Cost item $XX Cost item $XX Cost item $XX Cost item $XX Cost item $XX Phase 4 (cont.) Phase 4 – Visual Representation & Overhead/GL Cost Detail General Ledger (Cost Centers) Resource Cost Pool 1 Resource Cost Pool 2 Resource Cost Pool 3 Resource Cost Pool 4 Activity Cost Pool A Activity Cost Pool B Activity Cost Pool C Markets Geography Distribution Channel Products Customers • Sources of information for detailed costs will include financial systems, financial reports, interviews with key personnel, division or department P&L statements, and divisional budgets • If detailed cost is unavailable, generic overhead categories can be used to allocate indirect costs to cost objects • Insights generated by generic overhead allocation approach will have less strategic level • However, this level of detail may be sufficient for the strategic question under analysis • Understanding the specific components of overhead/general ledger costs helps identify the drivers to these costs • Overhead/GL costs include the following: • Salaries, wages, fringe benefits, SG&A, payroll taxes, processing, marketing, support, accounting, facilities, utilities, telecommunications • Other homogeneous-type costs Develop Cost Objects Group Cost Objects Develop Process Maps Identify Cost Elements Map GL Costs Allocate Costs Verify Economi c Logic
- 9. 17 Phase 5 – Visual Representation Phase 5 (cont.) General Ledger (Cost Centers) Resource Cost Pool 1 Resource Cost Pool 2 Resource Cost Pool 3 Resource Cost Pool 4 Activity Cost Pool A Activity Cost Pool B Activity Cost Pool C Markets Geography Distribution Channel Products Customers Develop Cost Objects Group Cost Objects Develop Process Maps Identify Cost Elements Map GL Costs Allocate Costs Verify Economi c Logic Resource Cost Pool • You do not need to create a large, detailed breakdown of resource cost pools • Usually 4-7 is sufficient • One way to form logical groupings of resources into resource cost pools can be to look at the company’s value chain or supply chain Resource Driver • Resource drivers can take on many forms: e.g. • Headcount, actions taken, quantity of products, etc. • One way to determine the true drivers is by asking the process/activity owner to identify their key resource drivers Activity Cost Pool • An activity cost pool should be identified for each activity (as defined in Phase 3)
- 10. 19 Phase 6 – Visual Representation & Insurance Company Example General Ledger (Cost Centers) Resource Cost Pool 1 Resource Cost Pool 2 Resource Cost Pool 3 Resource Cost Pool 4 Markets Geography Distribution Channel Products Customers Activity Cost Pool A Activity Cost Pool B Activity Cost Pool C EXAMPLES (FOR AN INSURANCE COMPANY) Overhead/General Ledger Cost Items Resource Cost Pools Cost Objects Activity Drivers Resource Drivers Activity Cost Pools • Salaries and wages • Fringe benefits • Facilities/ease costs • Other O/GL costs • Utilities costs • Payroll related expenses • Facilities related expenses • Processing related expenses • Other expenses • FTE count • Claims processing • Benefit investigation • Phone inquiries • Written inquiries • Number of claims processed • Health insurance by US state • Dental insurance by US state • Home insurance by US state • Auto insurance by US state Develop Cost Objects Group Cost Objects Develop Process Maps Identify Cost Elements Map GL Costs Allocate Costs Verify Economi c Logic Phase 6 (cont.)
- 11. 21 Phase 7 Verify the economic logic of the resulting ABC analysis Phase 7 – Overview Develop Cost Objects Group Cost Objects Develop Process Maps Identify Cost Elements Map GL Costs Allocate Costs Verify Economi c Logic • After the profitability results of the ABC analysis have been completed, you should perform a sanity check on the results • Ask the probing questions … Does it make sense that those customers, products, and other cost objects that appear profitable (per the ABC results) are actually doing well? Conversely, does it make sense that those customers, products, and other cost objects that appear unprofitable are actually doing poorly? • If the answer to these types of questions is ―no,‖ you should review the resource and activity drivers to determine if they are accurate • Additionally, look for reasonable explanations as to why the ABC results turned out the way they did during the sanity check
- 12. 23 Let’s walk through an example where we evaluate the financials of a manufacturer of “Gadgets” and “Gizmos” Financials Overview COMPANY BACKGROUND INFO / FINANCIALS The company carries 2 products: – Gadgets, with an annual volume of 200 units – Gizmos, with an annual volume of 1,000 units Income Statement Revenues $2,500 Cost of gadgets/gizmos $400 Wages/salaries/benefits $1,000 Delivery/freight $400 Overhead $400 Total Costs $2,200 Profits $300 CUSTOMER FINANCIALS The company has 3 customers: Rick, Ron, and Randy The 3 customers have different purchase volumes and product prices Customer Gizmos Gadgets Revenu eVolume Price Volume Price Rick 200 $1.40 10 $12.00 $400 Ron 700 $0.55 140 $8.00 $1,505 Randy 100 $1.60 50 $8.70 $595 SIMPLE PROFIT ANALYSIS Total Cost $2,200 Total Units 1,200 Unit Cost $1.833 Rick Ron Randy Revenue $400 $1,505 $595 Units 210 840 150 Cost $385 $1,540 $275 Profit $15 ($35) $320 Our simple analysis shows that we are making a nice profit from Randy, but not on the other 2 customers
- 13. 25 From the allocation and total costs, we can determine the cost for each activity Activity Costs by Management Accounts Order Taking Manufacturing Packaging Delivery Customs Cost of Gadgets/Gizmos 0 $400 0 0 0 Wages, salaries, benefits $500 $250 $200 0 $50 Delivery, freight 0 0 $120 $280 0 Overhead Facilities $40 $100 $40 0 0 Insurance 0 $60 $20 $20 0 SG&A $80 $20 $20 0 0 MANAGEMENT ACCOUNTS ACTIVITIES COST ($) = $400 = $1000 = $400 = $180 = $100 = $120 Total Cost Per Activity $620 $830 $400 $300 $50 = $2,200 Total Cost of Sales (CoS)
- 14. 27 With unit cost values, we can derive product profitability Product Profitability Order Taking Manufacturing Packaging Delivery Customs ACTIVITIES COST ($) Gadget $387.50 $730 $125 $150 $25 Gizmo $232.50 $100 $275 $150 $25 PRODUCTS Revenue Cost Profit Unit Cost Unit Profit Gadget $1,675 $1,417.50 $257.50 $7.09 $1.2875 Gizmo $825 $782.50 $42.50 $0.78 $0.0425 PRODUCTS Assume 125 orders of Gadgets, 75 orders of Gizmos Assume each packaged Gadget weighs 2.5 lb, each packaged Gizmo weighs 0.5 lb Assume 10 packages each of Gadgets and Gizmos went through customs Gadget is significantly more profitable than the Gizmo PROFITABILITY SUMMARY ($)
- 15. 29 … However, Activity Based Costing provides the most accurate customer profitability analysis Activity Based Customer Profitability Driver Unit Cost Rick Ron Randy Order taking Number of calls 50 75 75 Manufacturing Gadgets manufactured Gizmos manufactured 10 200 140 700 50 100 Packaging Gadgets packed Gizmos packed 10 200 140 700 50 100 Delivery/freight Weight (in pounds) 125 700 175 Custom # of packages through customs 0 0 20 ACTIVITY USAGE Order taking Number of calls $3.10 $155 $232.50 $232.50 Manufacturing Gadgets manufactured Gizmos manufactured $3.65 $0.10 $36.50 $20 $511 $70 $182.50 $10 Packaging Gadgets packed Gizmos packed $0.63 $0.28 $6.25 $55 $87.50 $192.50 $31.25 $27.50 Delivery/freight Weight (in pounds) $0.30 $37.50 $210 $52.50 Custom # of packages through customs $2.50 $0 $0 $50 ACTIVITY FINANCIALS Total Cost $310.25 $1,303.50 $586.25 Revenue $400 $1,505 $595 Profit $89.75 $201.50 $8.75 Final customer profitability is drastically different from initial analysis