SlideShare una empresa de Scribd logo
1 de 64
Descargar para leer sin conexión
November 21, 2013
Asia Pacific
2014 Outlook: Back on track
Portfolio Strategy Research
DM recovery and China reform drive our North Asia preference
Better absolute and relative returns
We expect 13% total US$ return in 2014 (MXAPJ 525 target), which would
be an improvement on the region’s 2% return in 2013 and 20% under-
performance vs. DM. We see improving global growth, the related tapering
of quantitative easing in the US, policy adjustment in Asia (China reform,
south Asia macro tightening), and politics as key macro themes.
Earnings: key performance driver
We expect earnings to accelerate back to trend in 2015 after 4 years of sub-
trend growth. Our top-down EPS growth forecasts are 10% and 14% for
2014 and 2015. Capex discipline and moderating input costs should help
non-financial margins improve 50bp to 7% in 2015 after a 20bp gain in ’14.
Little room for valuation expansion, except in China
Equal-weighted P/E valuations are 15.9x forward earnings, 0.8sd above the
10-yr mean and 31% higher than cap-weighted multiples. Macro models
and real earnings yield gaps point to flat valuations. EPS growth will
therefore be the main return driver. China is the exception: we expect
multiples to recover from a low base as confidence in reform builds.
Upgrade China, Taiwan; three flavors of earnings
We upgrade China on improving reform momentum, and also raise
Taiwan and stay Overweight Korea for their exposure to improving DM
growth. By macro slice, we advocate global cyclicals vs. asset-sensitive
financials. Stock ideas: three flavors of earnings: delta (rising margins),
value (attractively priced growth), and destination (Europe-exposed).
Secular themes: consumption digitalization, urbanization and green GDP.
China’s valuations may respond favorably to reforms; Korea and Taiwan
are most sensitive to stronger global growth
Source: FactSet, I/B/E/S, MSCI, Goldman Sachs Global Investment Research.
Timothy Moe, CFA
+852-2978-1328 timothy.moe@gs.com
Goldman Sachs (Asia) L.L.C.
Kinger Lau, CFA
+852-2978-1224 kinger.lau@gs.com
Goldman Sachs (Asia) L.L.C.
Richard Tang, CFA
+852-2978-0722 richard.tang@gs.com
Goldman Sachs (Asia) L.L.C.
Sunil Koul
+852-2978-0924 sunil.koul@gs.com
Goldman Sachs (Asia) L.L.C.
Ketaki Garg
+91(80)6637-8601 ketaki.garg@gs.com
Goldman Sachs India SPL
Goldman Sachs does and seeks to do business with companies covered in its research reports. As a result, investors
should be aware that the firm may have a conflict of interest that could affect the objectivity of this report. Investors
should consider this report as only a single factor in making their investment decision. For Reg AC certification and other
important disclosures, see the Disclosure Appendix, or go to www.gs.com/research/hedge.html. Analysts employed by
non-US affiliates are not registered/qualified as research analysts with FINRA in the U.S. This report is intended for
distribution to GS institutional clients only.
The Goldman Sachs Group, Inc. Global Investment Research
AU
CN
HK
IN
ID
KR
MY
PH SG
TW
TH
0.1
0.2
0.3
0.4
0.5
0.25 0.3 0.35 0.4 0.45 0.5
Sensitivity
Correlation
Asian markets and global cycle
5
10
15
20
25
J-01 J-03 J-05 J-07 J-09 J-11 J-13
12-month forward P/E (MXCN)
November 21, 2013 Asia Pacific
Goldman Sachs Global Investment Research 2
Table of contents
Executive summary: Back on track 3
Market view changes: Upgrade China and Taiwan to Overweight 8
Implementation: Emphasizing earnings 14
Key questions for 2014 21
Performance context: Intra-regional differentiation at play 26
Macro: Return expectations, views, and path 29
Earnings: Back to trend growth in 2015 after 4 years of weakness 37
Valuations: Not much room for expansion except for China 43
Positioning: Potential for continuing shift to North Asia 46
Secular themes: Buy on dips 49
Events in 2014 and beyond 55
Appendix 1: Goldman Sachs macro forecasts 56
Appendix 2: Valuations at a glance 57
Appendix 3: China reform policies 58
Disclosure Appendix 62
The authors would like to thank Vincent Lau and Nitin Chanduka for their valuable contributions.
All prices in this report are as of November 18, unless mentioned otherwise.
November 21, 2013 Asia Pacific
Goldman Sachs Global Investment Research 3
Executive summary: Back on track
After a year of flat returns and dramatic underperformance vs. DM, we expect 2014 to
be a better year in absolute and relative terms. We believe earnings growth will be
the main performance driver since aggregate valuations are full. We favor China on
improving reform momentum, Korea and Taiwan for their exposure to better DM
growth, and three flavors of earnings growth (delta, value, and revenue-source).
 Regional return. We expect the MXAPJ index to reach 525 by end-2014, implying
10% price and 13% total returns in USD. Earnings growth will be the key propellant,
but 3% weighted-average exchange rate depreciation and some valuation
compression may serve to offset some of the earnings gains. Within the region,
we upgrade China and Taiwan to Overweight and stay positive on Korea. Total
US$ returns for these markets could be 15% to 23%.
 Expected path. Our 3m and 6m targets are 485 and 490, implying a modest start
to the year and a stronger 2H. Key influences are likely to be the timing and
magnitude of Fed tapering, the reaction to China’s reform policies, the political
calendar in markets like India and Indonesia, and whether corporate Asia is able to
deliver earnings. Policy decisions will be sensitive to high-frequency macro
indicators, which means markets will be data dependent and the price path noisy.
 Key themes. The main macro themes we see are the improvement in global
growth to 3.6% from 2.8% (PPP terms) driven by the US, and the related tapering
of quantitative easing as US monetary policy begins to normalize. Within the
region, policy adjustment (China reform, south Asia macro tightening) and
politics will also impact markets. The key micro theme is the potential earnings
growth recovery in 2015 (which the market will anticipate in 2H14), driven in good
measure by supply side factors such as capex discipline and cost management.
 Performance context. Regional equities are roughly flat for 2013 with wide
amplitude of intra-year swings. Performance is at the 36th
percentile in absolute
terms relative to the MXAPJ’s 26-year history and the 20th
percentile relative to DM
equities over the same time frame. Market rotation was greater than sector
rotation, and FX weakness reduced USD returns by 5%. Looking forward, we
expect currency to be an important component of returns (albeit less negative),
and expect meaningful market, theme and stock performance differentiation.
 Earnings: key return driver. We expect earnings growth to accelerate back to
trend in 2015 after 4 years of sub-trend growth. Our top-down regional earnings
growth forecasts are 10% and 14% for 2014 and 2015 (EPS integers are $38.40 and
$43.70). These are 2% below and 4% above the respective consensus expectations.
Demand-side models have overestimated earnings recently, because the shortfall
has come from margins rather than revenues. Regional capacity utilization
currently stands at 67.3%, a full 10pp below the 77.6% level in the US, and this
excess capacity has depressed profitability. Capex discipline and moderating input
cost pressures should result in non-financial margins improving 50bp to 7% in
2015 after a 20bp uptick in 2014.
 Valuation: Not much room for expansion. The region currently trades at 12.1x
forward 12m earnings and 1.6x trailing book value, about 0.7sd below the 10-yr
mean. However, cap-weighted valuations are distorted downwards by China SOEs
and Korea electronics stocks. Equal-weighted valuations are 31% higher at 15.9x
forward earnings, which is 0.8 sd above average and from which point historical
returns have been subdued. Macro models point to flat valuations relative to our
forecasts, and real earnings yield gaps also look fair relative to range. In sum, we
expect little valuation change in 2014: EPS growth will be the main return driver.
November 21, 2013 Asia Pacific
Goldman Sachs Global Investment Research 4
 Positioning: Potential for continuing shift to N Asia. Regional equity flows
recovered after the mid-year selloff, with $28bn ytd inflows overall. India continues
to attract the highest flows ($17bn) with Korea and Taiwan next at $14bn
combined, and Thailand and Indonesia seeing net selling. Active positioning
remains biased towards south Asia, with mutual funds overweight India and
ASEAN by 495 and 948bp and underweight China, Korea and Taiwan by 582, 769
and 649bp. Given better macro characteristics relative to our global forecasts, we
see scope for added flows to N Asia and for flows from bonds to equities.
 Risks: The principal macro threats to our more constructive stance are a) global
growth falling short of our expected improvement, b) more aggressive Fed policy
tightening, c) China faltering on reform implementation, d) politically-driven
volatility, e) an oil shock (we expect a benign price path), and f) contagion from
other EMs. The main micro risk is continuing earnings shortfall if Asian companies
are not able to deliver the margin recovery we expect.
 Secular themes. Focal areas include:
o Digitalization of consumption: Smartphone demand, internet
commercialization, disruptive technologies like array cameras, and big
data and cloud computing.
o Urbanization: Includes infrastructure and healthcare.
o Green GDP: Environmental protection is emerging as a key China theme,
and includes alternative energy such as solar, gas, wind and hydro.
 Key questions.
o Asia vs DM relative performance. Our forecasts for the key global
regions imply more equivalent returns in 2014 as opposed to the
lopsided performance in 2013. The region’s relative performance may
improve later in 2014 if earnings show signs of a pickup as we expect.
o ASEAN. We expect ASEAN to continue to lag the broader region after
outperforming from 2006 to 2012. 2H14 may be a better time to revisit
once the current cyclical macro adjustment is more mature.
o China internet and Macau gaming. These were the strong performers of
2013 and helped many investors perform. We advocate buying
corrections because the fundamental theme is powerful and not yet
mature.
o China banks. The top 10 country-sectors in the MXAPJ index account for
42% of market cap, meaning decisions in this area will have outsized
impact on relative performance. China banks are the fourth largest
country sector (after Australia banks and Taiwan and Korea tech). Risk is
to the upside near-term given reform momentum.
o Tech. Tech is the 2nd
largest sector regionally, accounting for 15% of
market cap. We are overweight and expect ‘old tech’ to perform well,
along with ‘new tech’.
 Markets: Raise China and Taiwan, continue to favor Korea
o Overweight
China: Upgrade: policy reform could raise valuation off low base
Korea: Attractive macro profile, mid-teens EPS growth, inexpensive
Taiwan: Upgrade: favorable macro exposure enhanced by high yield
November 21, 2013 Asia Pacific
Goldman Sachs Global Investment Research 5
o Market weight
India: Reduced external vulnerability, earnings holding up
Malaysia: Upgrade given moderating external risk and low vol; full vals
Philippines: Strongest ASEAN-4 fundamentals; valuations still high
Singapore: Downgrade: better alternatives in N Asia
o Underweight
Australia: Weak domestic fundamentals, significant AUD downside risk
Hong Kong: Challenges from QE exit; high valuation relative to China
Indonesia: Tighter policy to impact n/t growth; outlook better later in 2014
Thailand: Downgrade on macro/policy risks; earnings/valuations fair
 Sectors: selected cyclicals
o Overweight: Autos, tech hardware & semis, banks, software, transport
o Market weight: Energy, health care, capital goods, insurance,
metals/mining, chemicals, retail
o Underweight: Real estate, utilities, staples, telecom
 Implementation: Emphasizing earnings
o Markets: long Korea; HSCEI 3-month call spreads, China reform-
beneficiary basket
o Macro slices: global cyclicals vs. asset-sensitive financials (GSSZMSGC
vs. GSSZMSFA)
o Three flavors of earnings: Delta earnings (margin expansion); Value
earnings (attractively priced growth); Destination earnings (Europe-
exposed stocks)
o Secular themes: Plays on consumption digitalization, urbanization, green
GDP
o Derivatives: Preferred downside hedge is ASX 200 Mar-end puts.
November 21, 2013 Asia Pacific
Goldman Sachs Global Investment Research 6
Exhibit 1: We expect more balanced returns between regions in 2014
Note: TOPIX EPS is based on fiscal, not calendar years.
Source: Goldman Sachs Global Investment Research.
Exhibit 2: We prefer North Asia
Source: Goldman Sachs Global Investment Research.
Exhibit 3: Market scorecard
Note: Blue cells refer to favorable metrics, whilst grey cells refer to unfavorable ones. For GDP, blue (grey) cells indicate sharp acceleration (deceleration) vs 2013.
For inflation, blue (grey) cells indicate sharp deceleration (acceleration) vs 2013.
For sensitivity, blue cells refer to significant positive impact in equity market returns given changes in our Global Leading Indicator. For detail, please refer to Asia
Pacific: Portfolio Strategy: Bridging macro to micro: 18 ideas for North Asia, October 24.
Source: FactSet, MSCI, Goldman Sachs Global Investment Research
Total Forward P/E
Price Price Target Price Return Return EPS Growth Current Year-End
Index 19-Nov-13 3-mo 6-mo 12-mo 3-mo 6-mo 12-mo (USD) 2014E 2015E Consensus 2014E
TOPIX 1,237 1,350 1,375 1,450 9 % 11 % 17 % 12 % 21 % 14 % 14.3 x 13.6 x
Stoxx Europe 600 323 330 340 360 2 5 12 19 14 13 13.5 12.9
MXAPJ 478 485 490 525 1 2 10 13 10 14 12.1 12.0
S&P 500 1,788 1,800 1,850 1,900 1 3 6 8 8 8 14.9 15.2
EPS growth (%) 12-month return forecasts (%)
Allocation Market Index
Index
level (Nov
18)
CY14E CY15E
Local
price
return
FX
change
Dividend
yield
USD
total
return
China HSCEI 11,307 10 11 10.0 13,600 20 -1 3 23
Taiwan TWSE 8,191 11 13 14.0 9,200 12 2 3 17
Korea KOSPI 2,011 15 15 9.1 2,350 17 -3 1 15
Singapore FSSTI 3,203 8 14 12.5 3,300 3 8 4 15
Malaysia FBMKLCI 1,792 8 10 15.3 1,950 9 0 3 12
Philippines PCOMP 6,343 8 16 15.5 6,300 -1 9 2 10
India NIFTY 6,189 12 18 13.7 6,900 11 -3 2 10
Indonesia JCI 4,394 12 17 13.0 5,000 14 -2 3 15
Thailand SET 1,424 9 11 11.8 1,510 6 -1 4 8
Hong Kong MXHK 13,310 6 9 15.0 14,100 6 -1 3 8
Australia AS51 5,385 8 11 14.5 5,900 10 -9 5 5
Asia Pacific ex Japan (USD) MXAPJ 478 10 14 12.0 525 12 -3 3 13
Asia ex Japan (USD) MXASJ 556 11 13 11.4 625 13 -1 3 15
Underweight
Target
P/E (X)
Index
target
Marketweight
Overweight
China
Taiwan
Korea
Singapore
Malaysia
Philippines
India
Indonesia
Australia
Thailand
HongKong
2014 GDP growth (%) 7.8 3.8 3.7 3.8 5.0 6.3 5.0 5.3 2.0 4.2 3.7
2014 Inflation (%) 3.1 1.4 2.4 3.3 2.8 3.8 6.5 6.8 2.9 2.8 3.3
Sensitivity to global growth √ √ √ √
2014E-15E EPS CAGR (%) 11 12 15 11 9 12 15 15 10 10 8
NTM P/E (X) 9.3 14.1 8.8 14.1 15.5 18.5 14.4 13.3 14.5 11.9 15.0
LTM P/B (X) 1.5 1.8 1.2 1.5 2.2 3.1 2.5 3.1 2.0 2.2 1.3
Avg. of 10y Z scores for P/E & P/B (1.0) (0.2) (0.8) (0.4) 0.7 1.5 (0.6) (0.1) 0.1 0.5 (0.6)
Currency 12-mo chg vs. US$ (%) (0.6) 1.9 (3.4) 8.4 0.1 8.8 (6.0) (1.7) (9.3) (1.3) (0.6)
Positioning Asia-fund bp OW/UW √ √ √ X O O X O X X X
OW OW OW MW MW MW MW UW UW UW UW
Macro
Valuations
EPS growth
November 21, 2013 Asia Pacific
Goldman Sachs Global Investment Research 7
Exhibit 4: Cyclicals over defensives
Source: FactSet, MSCI, Goldman Sachs Global Investment Research
Exhibit 5: China, Taiwan, Korea and 3 flavors of earnings
Source: Goldman Sachs Global Investment Research
GS Asia STAMP
Current STAMP Scores based on our macro views and latest data
Macro EPS Relative Current Current GS
Views Sentiment Valuation STAMP Score Allocation
Autos & Components √√ √√ √ √√ Overweight
Tech Hardware & Semis √√ x √√ Overweight
Banks √ √√ √√ Overweight
Software & Services √√ √√ xx √ Overweight
Transportation x Overweight
Energy √√ √√ √√ Marketweight
Health Care √ √ Marketweight
Capital Goods xx √ Marketweight
Insurance & other Financials √ Marketweight
Metals & Mining √ x Marketweight
Chemicals & other Materials xx x xx Marketweight
Consumer Retail & Services √ xx xx xx Marketweight
Real Estate x √ √√ Underweight
Utilities x xx x Underweight
Consumer Staples xx x xx Underweight
Telecom Services xx x √ xx Underweight
Current "Simplified"
Macro Views
Growth: A mild pick up
Dom. vs. Extenal: External
Infl. vs. Growth: Neutral
Policy: Neutral
Current metric is:
√√ Very favorable
√ Favorable
Neutral
x Negative
xx Very Negative
Our trade recommendations
China: Reform beneficiaries; HSCEI 3-month call-spreads
Taiwan: Stock ideas in 'Old Tech'
Korea: EWY, KOSPI 200 6-month call-spreads
Macro slices Global Cyclicals vs Asset-Sensitive Fins. <GSSZMSGC vs. GSSZMSFA>
Margin expansion (Delta Earnings)
Growth at value (Value Earnings)
Europe-exposed (Destination Earnings)
Downside Hedge March expiry outright puts on ASX 200 (Australia)
Secular Themes Digitalization of consumption, Urbanization, and Green GDP
Style / Themes:
Earnings Growth
Markets
November 21, 2013 Asia Pacific
Goldman Sachs Global Investment Research 8
Market view changes: Upgrade China and Taiwan to Overweight
China: Upgrade to OW on improving reform momentum; 3 ways to
engage
We upgrade China to Overweight from Market weight for the following reasons:
 The long-waited catalyst has materialized: A full plenary document was
released on November 15, a few days after the closure of the session. The detailed
document, which covers many specific commitments including market
deregulation/financial reform, fiscal and tax policy, safety nets/demographics,
urban/rural; and SOE reform, has reinvigorated market expectations on reform and
China’s longer-term growth prospects.
 Reform momentum is likely to stay strong in the coming months: While we
are mindful of being carried away by policy-driven sentiment swings as the speed
and effectiveness with which the measures will be executed remains to be seen
and China still needs to work through numerous structural challenges, we believe
there is a reasonable chance that we may see a more concrete timetable and
implementation details to be announced at the ministry level in the coming
few months.
 A decent fundamental configuration: Our economists expect China’s GDP to
grow 7.8% on a real basis in both 2014 and 2015, leading to stable 10% and 11%
EPS growth for China in those respective years based on our top-down forecast.
 Inexpensive valuations: China currently trades on 9.3x forward P/E and 1.5x
trailing book, 0.9 and 1.1 s.d. to the attractive side of their respective 10-year
ranges. We fully acknowledge that low valuation is not always a strong argument
to turn bullish, but we think it is a tailwind for returns when catalysts emerge.
 Light positioning: EPFR data suggests GEM- and Asia-focused funds are currently
underweight China by 290 bps and 582 bps respectively, suggesting favorable
positioning normalization risk.
 Implementation: We recommend 3 ways to get upside exposure to China
o We continue to favor reform beneficiaries and highlight 9 buy-rated
stocks which revolve around the themes of mass market consumption,
healthcare, brokers and defense (Exhibit 8).
o Chinese banks, which are the fourth largest country-sector in MXAPJ, are
trading at very low absolute valuations (5.1X 2014E P/E, 0.9X P/B) and may
see asymmetric upside risk if more bank-specific reform policies are laid
out in the foreseeable future. We are OW banks at both regional market
and China levels.
o We recommend investors take advantage of moderate vol and elevated
call-skew (OTM calls expensive relative to ATM calls) by buying call-
spreads on HSCEI. 3-month 105/115% call-spreads currently cost 2.15%,
at 27% cost-savings to outright 105% calls (2.95%), much higher than
similar call-spreads on most markets globally. The trade provides a
maximum payout of 4.7x if HSCEI rallies 15% by expiry. Risks: Buyers of
105/115% call-spreads risk capped upside if HSCEI rises more than 15%
and loss of up-front premium if HSCEI rises less than 5% by expiry.
 Key risks to our upgrade: Reform implementation falls short of market
expectation, and tighter-than-market-expected liquidity. Also see China: Portfolio
Strategy Research: Third Plenary: Ambitious blueprint to boost sentiment,
November 18.
November 21, 2013 Asia Pacific
Goldman Sachs Global Investment Research 9
Exhibit 6: Chinese banks are trading at attractive
valuation levels
Exhibit 7: Active managers are underweight China
Source: FactSet, EPFR, I/B/E/S, Goldman Sachs Global Investment Research Source: FactSet, EPFR, I/B/E/S, Goldman Sachs Global Investment Research
Exhibit 8: We favor China reform-beneficiaries
* indicates the stock is on our regional Conviction List.
Source: FactSet, MSCI, I/B/E/S, Goldman Sachs Global Investment Research
Exhibit 9: HSCEI call-skew has increased with OTM calls
trading expensive vs. ATM calls, compared to their
historical relationship
Exhibit 10: Call-spreads on HSCEI currently offer
meaningful cost savings (27%) unlike most major
markets globally
Source: Goldman Sachs Global Investment Research Source: Goldman Sachs Global Investment Research.
9.3
5yr z-score:
-0.73
12.1
5yr z-score:
-0.09
4
10
16
22
28
May-06
Aug-06
Nov-06
Feb-07
May-07
Aug-07
Nov-07
Feb-08
May-08
Aug-08
Nov-08
Feb-09
May-09
Aug-09
Nov-09
Feb-10
May-10
Aug-10
Nov-10
Feb-11
May-11
Aug-11
Nov-11
Feb-12
May-12
Aug-12
Nov-12
Feb-13
May-13
Aug-13
Nov-13
MXCN 12m fP/E MXCN 12m fP/E ex. banks
Forward PE
-290
10yr z-score:
-0.32
-582
10yr z-score:
-0.89
-800
-700
-600
-500
-400
-300
-200
-100
0
100
200
Sep-03
Feb-04
Jul-04
Dec-04
May-05
Oct-05
Mar-06
Aug-06
Jan-07
Jun-07
Nov-07
Apr-08
Sep-08
Feb-09
Jul-09
Dec-09
May-10
Oct-10
Mar-11
Aug-11
Jan-12
Jun-12
Nov-12
Apr-13
Sep-13
Fund Allocation (OW/ UW, bps)
EM Funds Asian Funds
China
Bloomberg Name Reform Theme Sector
Listed
Mkt Cap
(US$ mn)
6M
ADVT
(US$ mn)
Price
(Quote)
GS
Rating
12m
Potential
+/(-)%
2013E
EPSg
(%)
2014E
EPSg
(%)
2014E
P/E
(X)
2014E
P/B
(X)
2014E
D/Y
(%)
6881 HK China Galaxy Financial reform Other financials 1,182 7 5.42 B 25% 21% 18% 13.0 1.2 2.0%
151 HK Want Want One child policy Cons. Stap. 18,487 20 10.84 B 15% 19% 20% 23.3 8.6 2.9%
2357 HK AviChina National defense Industrials 1,173 4 3.86 B 24% 20% 21% 19.3 1.6 1.0%
1193 HK China Resources Gas Environment protection Utilities 5,751 10 20.05 B* 22% 19% 22% 16.8 2.8 1.2%
270 HK Guangdong Investment Environment protection Utilities 5,263 7 6.54 B 31% 8% -4% 11.5 1.4 3.4%
958 HK Huaneng Renewables Environment protection Utilities 1,455 8 3.23 B -7% 106% 36% 14.1 1.5 1.2%
2196 HK Shanghai Fosun Pharm. Health care reform Healthcare 867 6 20.00 B -5% 4% 12% 17.4 2.1 1.5%
867 HK China Medical System Health care reform Healthcare 2,099 4 6.74 B* 26% 22% 25% 16.1 3.5 2.3%
700 HK Tencent Mass market consumption Internet 100,634 180 419.6 B* 7% 27% 28% 30.3 8.2 0.4%
Avg 16% 27% 20% 18.0 3.4 1.8%
0.86
0.88
0.90
0.92
0.94
0.96
0.98
1.00
1.02
1.04
Jan‐10
Apr‐10
Jul‐10
Oct‐10
Jan‐11
Apr‐11
Jul‐11
Oct‐11
Jan‐12
Apr‐12
Jul‐12
Oct‐12
Jan‐13
Apr‐13
Jul‐13
Oct‐13
HSCEI 3-mo call-wing skew
(25-delta call / ATM vol)
42%
27%
25%
23%
13% 13% 12%
7% 7% 6% 4% 4% 4% 3%
2%
0%
5%
10%
15%
20%
25%
30%
35%
40%
45%
Bovespa
HSCEI
Nikkei 225
TOPIX
NIFTY
RDXUSD
HSI
KOSPI 200
S&P 500
EuroStoxx50
MSCI World
TWSE
FTSE 100
MSCI Sing
ASX 200
Call-spread cost-saving vs. calls
(3-mo 105/115% call-spreads vs. 105% calls)
November 21, 2013 Asia Pacific
Goldman Sachs Global Investment Research 10
2) Taiwan: US + China exposures; upgrade to OW
We upgrade Taiwan to Overweight from Market weight for the following reasons:
 A favorable macro profile: Top-down, we still feel very comfortable on how
Taiwan stacks up against its global and Asia EM peers: Taiwan’s leverage is not
excessive, the current account is in significant surplus (12% of GDP), the currency
is not overvalued and FX volatility is low, and the FX reserve (to GDP) provides a
strong liquidity cushion.
These characteristics should help Taiwan weather market volatility when investors
turn their attention to EM macro vulnerability and contagion risk, possibly when
the Fed begins to taper, which our economists expect will be in March 2014.
 Compelling thematic exposures: In addition to Korea, we view Taiwan as an
efficient market to gain global cyclical exposures as its economy and equity market
are closely linked to the US (25% of revenue). Additionally, we feel China reform
optimism may have positive sentiment spillover to ‘China Plays’ in Taiwan,
including petrochem/materials, select financials, and tourism, which in aggregate
represent 16% of equity market revenue.
 A more sustainable and balanced earnings growth profile in 2014: After
growing earnings by 27% in 2013 from a low base, Taiwan is likely to deliver a
more sustainable mid-teen EPS growth of 11% and 13% in 2014 and 2015 as
margins gradually recover to mid-cycle levels. Growth contribution is likely to be
more balanced than in previous years when upstream semi (TSMC) and select
non-tech sectors subsidized the losses from PC supply chain segments and the
petrochem industry.
 Valuations are not low but should not be a key concern: Taiwan currently
trades on 14.1X forward P/E and 1.8X trailing book, 17% and 9% above the
regional aggregates (0.68 and 1.0 s.d.).
The high absolute and relative valuations have been a key consideration
preventing us from turning more positive on Taiwan, but given our economists’
rising conviction on DM recovery and Taiwan-specific merits (a favorable macro
profile, high and stable dividend yields), we feel the valuation burden should not
dismiss our positive investment case (and return expectation) on Taiwan which
will be driven primarily by fundamental earnings growth.
 Light investor positioning: Similar to China and Korea, global- and Asia-focused
investors are underweight by a wide margin – 249bps by GEM funds and 649bps
by Asian-mandated funds. The recent FINI inflows of US$7.6bn since July look
high at the first glance, but less significant compared with the depth of the market.
 A better year for ‘Old tech’. As we detail in the ‘Key questions’ section, we expect
'Old tech', which accounts for half of total market cap, to have a better year in
terms of absolute return as:
o Valuation has now reached arguably attractive levels, especially
relative to ‘New tech’ which focuses on software design and other tech-
related value-added services.
o Taiwan tech appears more favorably skewed towards a DM recovery story
given their revenue exposures there.
o Our analyst remains fundamentally bullish on TSMC (Buy, on Conviction
list), the largest stock in MSCI Taiwan (20%) and TAIEX (12%).
November 21, 2013 Asia Pacific
Goldman Sachs Global Investment Research 11
Exhibit 11: Taiwan’s macro profile looks solid relative to
global/Asia EMs
Exhibit 12: Taiwan’s fundamentals are well linked to the
US and China
Source: Haver, CEIC, MSCI, Goldman Sachs Global investment Research Source: MSCI, Goldman Sachs Global investment Research
Exhibit 13: Growth contribution is likely to be more
balanced in 2014
Exhibit 14: Valuations are not low but shouldn’t be a
major concern
Source: I/B/E/S, MSCI, Goldman Sachs Global Investment Research Source: FactSet
Exhibit 15: Stocks we highlight in Taiwan
B* indicates the stock is on Conviction Buy list.
Source: I/B/E/S, Lionshare, FactSet, Goldman Sachs Global Investment Research
86%
68%
25%
12%
-14%
37%
22%
9%
1%
10%
20%
44%
8%
0%
8%
-20%
0%
20%
40%
60%
80%
100%
FX reserve/GDP
(%)
GDPg correl. with
the US
Sales Exp. to the
US
C/A as % of GDP
(%)
FX over-
/undervaluation
Taiwan AeJ EM
(%)
25%
19%
12% 9% 8% 6% 8%
3% 3%
12%
16%
3%
11% 13%
8% 9% 3%
5% 1%
9%
10%
14% 13% 12%
9% 8%
6%
5%
4%
11%
0%
10%
20%
30%
40%
50%
60%
Taiwan
India
Korea
HongKong
Australia
Singapore
Philippines
Malaysia
Thailand
MXAPJ
MSCI Indexes Revenue Exposure (%)
% from EU % from CN % from US
-7%
3%
32%
8%
13%
25%
25%
20%
11%
24% 19%
9%
17%
15%
7%
13%
11%
3%
-10%
0%
10%
20%
30%
40%
50%
60%
70%
80%
90%
100%
2013E Earnings 2014E Earnings 2014E Earnings
Growth
Contribution
Technology Distributors
wafer
PCB
Solar power
Other Tech
IC packaging and testing
Acer
Consumer electronics
LED
Touch screen
ODM/OEM
Other components (NB)
Fabless design
Foundry
Others
Financials
Petrochem
TFT-LCD (panel)
8.0
10.0
12.0
14.0
16.0
18.0
20.0
-50%
-40%
-30%
-20%
-10%
0%
10%
20%
30%
40%
50% Nov-03
Nov-04
Nov-05
Nov-06
Nov-07
Nov-08
Nov-09
Nov-10
Nov-11
Nov-12
Nov-13
Fwd PE Prem/ Disc (%)
Fwd PE Prem/ Disc (MXTW vs. MXAPJ)
MXTW - 12M forward P/E
fPE: 14.1X
5-yr z-score: 0.42
Forward PE (X)
Ticker Name Sector
Listed Mkt
Cap (US$
mn)
6M
ADVT
(US$
mn)
Price
(Quote)
GS
Rating*
12m
Pot.
+/(-)%
14E
EPSg
(%)
Agg. EM
Funds
OW/UW
(bps)
5yr
avg.
ROE
5yr
avg.
CROCI
14E
P/E
(X)
5yr
PE z-
score
14E
P/B
(X)
2330 TT TSMC Semi 91,212 116 104.00 B* 25% 16% 14.5 23% 18% 12.5 -0.2 2.7
2317 TT Hon Hai Comp. H/W 33,440 81 75.30 B 17% 3% -76.2 16% 13% 9.4 -0.5 1.1
2308 TT Delta Elec Comp. H/W 11,838 23 144.00 B 17% 27% -23.2 19% 24% 15.7 0.9 3.3
2891 TT Chinatrust Fin. Banks 9,406 21 18.90 B* 22% 21% -23.1 9% - 11.3 -0.2 1.3
2311 TT Advanced Semi Semi 7,897 19 30.10 CS - 23% -15.7 14% 10% 12.5 -0.2 1.8
3008 TT Largan Comp. H/W 4,510 45 994.00 B 36% 18% -9.1 26% 41% 12.6 -1.1 3.3
2474 TT Catcher Tech. Comp. H/W 4,507 38 177.50 B 7% -3% -9.5 17% 14% 10.4 -0.5 1.8
2823 TT CH Life Insur. (TW) Insurance 2,555 12 27.75 B 23% 7% -5.2 18% - 12.6 -0.5 1.5
2439 TT Merry Electronics Comp. H/W 640 8 107.50 B* 35% 60% 0.1 11% 14% 12.2 1.2 2.8
Avg 23% 19% -16.4 17% 19% 12.1 -0.1 2.2
TW Avg - 11% -6.9 11% 14% 17.8 0.6 2.2
Taiwan
November 21, 2013 Asia Pacific
Goldman Sachs Global Investment Research 12
3) Korea: A global cyclical recovery play; reiterate Overweight
We reiterate our Overweight stance for Korea’s leverage on the global cyclical recovery.
Our end-2014 target for KOSPI is 2,350, implying 17% upside. Our arguments are as
follows:
 Macro: well positioned for DM recovery, improving domestic sentiment.
Korea is among the markets that are most leveraged to the global macro cycle. In
value-added terms, the US and Europe are the two largest markets for Korea
exports. Our economists expect GDP growth to accelerate to 2.9% in 2014 from
1.7% in 2013 in the US, and 1.1% from -0.4% in the Euro area. China, the third
largest export destination for Korea, will likely maintain stable growth in our view.
We are also seeing early signs of a pickup in domestic demand after a long period
of weakness. Housing markets have gradually improved, imports of machinery
have further risen, and credit expansion has resumed. Given the “twin engines”
of growth, we expect GDP growth to accelerate to 3.7% next year from 2.9% in
2013.
 Earnings: highest growth in the region. We forecast 15% EPS growth in Korea
each in 2014 and 2015, compared to consensus of 20% and 11%. Although some
moderate negative revisions are likely, we expect Korea will still be the market
with the fastest earnings growth in the region next year. Even without valuation
expansion, Korea should be able to deliver decent returns just “riding on
earnings”.
 Valuation: attractive relative to the region. Korea is currently trading at 8.8X
forward P/E and 1.2X trailing P/B, which are 0.5 and 1.2 s.d. below the 10-year
average. It is also trading at a deep discount to the region (27% for P/E and 32%
for P/B). Although relative valuations have risen, they are only 13% and 18%
above trough levels. We believe there is potential for further valuation expansion.
 Positioning: potential for inflow to continue given funds’ underweight. Year-
to-date, foreigners have bought US$6.5bn of Korean equities. Despite the inflows,
mutual funds remain strongly underweight the market (by 769bp). Given light
investor positioning, we see potential for more inflows.
 Implementation: Buy EWY (US-listed ETF); prefer KOSPI 200 call-spreads for
asymmetric exposure. We suggest buying EWY (US-listed ETF on MSCI Korea) as
a direct way to position for long exposure in Korea. Although EWY is US-
denominated and hence exposed to FX risk, we see modest depreciation pressure
on KRW next year.
Investors who can trade derivatives and want to limit any downside risk can take
advantage of low implied volatility. 6-month implied vols on KOSPI 200 are
currently trading at 15.4v, which is less than 1 vol point above its lows (14.8v) and
in the 3rd percentile of its history since 2007. We prefer call-spreads to outright
calls. 6-month 105/115% call-spreads on KOSPI 200 currently cost 1.9% with
maximum potential payout of 5.3x. Risks: Buyers of 105/115% call-spreads risk
capped upside if KOSPI 200 rises more than 15% and loss of up-front premium if
KOSPI 200 rises less than 5% by expiry.
November 21, 2013 Asia Pacific
Goldman Sachs Global Investment Research 13
Exhibit 16: “Twin engines” of growth: DM recovery and
improving domestic sentiment to lift GDP growth in 2014
Exhibit 17: We expect Korea to deliver the strongest
earnings growth in the region
Source: Source: EPFR, FactSet, I/B/E/S, MSCI, Goldman Sachs Global
Investment Research.
Source: Source: EPFR, FactSet, I/B/E/S, MSCI, Goldman Sachs Global
Investment Research.
Exhibit 18: Korea’s valuations remain attractive vs. the
region
Exhibit 19: Active managers are still underweight the
market
Source: EPFR, FactSet, I/B/E/S, MSCI, Goldman Sachs Global Investment
Research
Source: EPFR, FactSet, I/B/E/S, MSCI, Goldman Sachs Global Investment
Research
8.7
7.6
4.5 4.9
4.3
3.5 3.6 3.4
2.8 2.4
1.6 1.5 1.5
2.3
3.3
4.2 4.2 3.9 3.6 3.3
0.0
1.0
2.0
3.0
4.0
5.0
6.0
7.0
8.0
9.0
10.0
2010-1Q
2010-2Q
2010-3Q
2010-4Q
2011-1Q
2011-2Q
2011-3Q
2011-4Q
2012-1Q
2012-2Q
2012-3Q
2012-4Q
2013-1Q
2013-2Q
2013E-3Q
2013E-4Q
2014E-1Q
2014E-2Q
2014E-3Q
2014E-4Q
Real GDP (yoy)
Korea
15%
12%
12%
11%
10%
9% 8% 8% 8% 8%
6%
10%
4%
6%
8%
10%
12%
14%
16%
Korea
Indonesia
India
Taiwan
China
Thailand
Australia
Philippines
Malaysia
Singapore
HongKong
MXAPJ
2014E EPS growth (%)
-80%
-70%
-60%
-50%
-40%
-30%
-20%
-10%
0%
10%
20%
Nov-95
Nov-96
Nov-97
Nov-98
Nov-99
Nov-00
Nov-01
Nov-02
Nov-03
Nov-04
Nov-05
Nov-06
Nov-07
Nov-08
Nov-09
Nov-10
Nov-11
Nov-12
Nov-13
Valuation Prem/ Disc (MXKR vs MXAPJ)
Trailing PB Prem/ Disc
Fwd PE Prem/ Disc
-25%
10yr z-score:
-0.29
-31%
10yr z-score:
-1.24
-1200
-800
-400
0
400
800
1200
Oct-03
Apr-04
Oct-04
Apr-05
Oct-05
Apr-06
Oct-06
Apr-07
Oct-07
Apr-08
Oct-08
Apr-09
Oct-09
Apr-10
Oct-10
Apr-11
Oct-11
Apr-12
Oct-12
Apr-13
Oct-13
ASEAN India
Hong Kong China
Korea Taiwan
Asia-fund
OW/UW (bps)
November 21, 2013 Asia Pacific
Goldman Sachs Global Investment Research 14
Implementation: Emphasizing earnings
1) Earnings growth: Stylistic and thematic implementation
One of our core themes for 2014 is seeking earnings growth without too much exposure to
valuation risk. We highlight three different flavors of earnings-related implementation: a)
Delta Earnings (Margin expansion) b) Value earnings (attractively priced growth) and c)
Destination earnings (Europe-exposed stocks), as described in detail below.
a) Margin expansion
 Identifying cyclical margin recovery and structural margin expansion stocks:
We believe the magnitude of margin improvement next year will remain mild, but
that it will be much stronger in 2015. Despite this, we see a few sectors with
potential for early margin recovery on improving demand/supply dynamics.
Together with names that have structural margin expansion stories, we highlight a
list of 12 stocks in the region (Exhibit 20).
 Entry points matter: Within our list, some China names have rallied sharply along
with the overall market on reform enthusiasm. While we are confident on their
improving margin outlook, we suggest investors wait for better entry levels.
 Appealing growth/valuation profile: Our analysts forecast these stocks overall
will see 2014 earnings growth accelerating to 18% (from 1% in 2013), and they are
trading at 10.8X 2014E P/E on median. Their growth/valuation profile thus looks
favorable compared to the overall market.
Exhibit 20: Stocks whose earnings may benefit from expanding margins
B* indicates the stock is on Conviction Buy list.
Source: Goldman Sachs Global Investment Research.
Ticker Name Country Sector
Listed Mkt
Cap (US$
mn)
6M
ADVT
(US$ mn)
Price
(Quote)
GS
Rating
12m
Potential
+/(-)%
2013
EPSg
(%)
2014
EPSg
(%)
2013
NM
(%)
2014
NM
(%)
2015
NM
(%)
2014
P/E (X)
2014
P/B (X)
2014
D/Y
(%)
005380 KP Hyundai Motor Korea Autos 51,576 96 249000 B 18% 1% 14% 10% 10% 11% 5.6 0.9 0.8%
TTMT IS Tata Motor India Autos 16,437 53 386 B* 18% 34% 18% 7% 7% 7% 6.8 1.8 0.2%
914 HK Anhui Conch Cement China Materials 4,567 39 27.25 B* 19% 32% 18% 16% 17% 18% 11.5 1.8 1.7%
3323 HK China National Building Material China Materials 2,822 36 7.60 B 30% 9% 31% 5% 6% 7% 4.0 0.8 3.7%
SMM SP Sembcorp Marine Singapore Industrials 7,394 10 4.41 B 20% -1% 53% 10% 11% 11% 12.1 2.9 4.1%
2039 HK China Itnl' Marine Containers China Industrials 2,601 2 14.10 B 16% -36% 90% 2% 3% 5% 12.5 1.3 2.4%
012630 KP Hyundai Dev. Korea Industrials 1,701 7 24000 B* 13% NM NM -3% 5% 5% 8.2 0.8 4.2%
386 HK Sinopec China Oil and gas 21,388 67 6.50 B 12% 17% 14% 3% 3% 3% 6.8 1.0 5.8%
023530 KP Lotte Shopping Korea Retailing 11,164 13 377000 B 17% -9% 11% 3% 4% 4% 10.1 0.6 0.4%
2331 HK Li Ning Co. Ltd. China Retailing 1,169 5 6.62 B 30% -85% -115% -6% 1% 5% 125.5 2.5 0.0%
2439 TT Merry Elec. Taiwan Retailing 640 8 108 B* 35% 102% 60% 9% 12% 13% 12.2 2.8 3.5%
347 HK Angang Steel China Steel 682 9 4.87 B* 31% -130% 90% 2% 3% 5% 11.8 0.6 4.5%
Median 18% 1% 18% 4% 5% 6% 10.8 1.2 3.0%
November 21, 2013 Asia Pacific
Goldman Sachs Global Investment Research 15
b) Growth at value
We classify the bottom 25 percentile of stocks based on Forward PE as Value stocks and
top 25 percentile of stocks based on sales growth in each market as Growth stocks and
make the following observations:
 Growth has outperformed value 9 years in a row (Exhibit 21).
 Growth looks quite expensive relative to value (51% PE and 44% PB premium), but
growth remains scarce, and value stocks could be a trap given low ROEs.
 We prefer select growth stocks with reasonable valuations. We screen the bottom
25th
percentile of stocks among Growth stocks based on their P/E. The combined
Growth+Value strategy has performed better than either Growth or Value
individually. We highlight Sembcorp Marine, Largan Precision, Tata Motors and
Geely as stocks that screen well within our list (Exhibit 25).
Exhibit 21: Growth has outperformed value 9 years in a
row
Exhibit 22: Value stocks are valued at high discounts to
growth stocks
Source: DataStream, FactSet, Goldman Sachs Global Investment Research Source: DataStream, FactSet, Goldman Sachs Global Investment Research
Exhibit 23: The combined growth+value strategy has
performed even better
Exhibit 24: Value has low ROE but growth seems
expensively priced
Source: DataStream, FactSet, Goldman Sachs Global Investment Research Source: DataStream, FactSet, Goldman Sachs Global Investment Research
-60%
-30%
0%
30%
60%
90%
120%
2000
2001
2002
2003
2004
2005
2006
2007
2008
2009
2010
2011
2012
2013YTD
Annual Return (%)
Value Growth MXAPJ
-15%
0%
15%
30%
45%
60%
2001
2002
2003
2004
2005
2006
2007
2008
2009
2010
2011
2012
2013(Curr.)
Growth vs. Value
Rel Fwd PE Prem/ Disc
Growth stocks
more expensive
80
100
120
140
160
180
200
Jan-10
Mar-10
May-10
Jul-10
Sep-10
Nov-10
Jan-11
Mar-11
May-11
Jul-11
Sep-11
Nov-11
Jan-12
Mar-12
May-12
Jul-12
Sep-12
Nov-12
Jan-13
Mar-13
May-13
Jul-13
Sep-13
Rebased Index
Value Growth
Growth (Value) MXAPJ
Value vs Growth
Value Growth MXAPJ
Growth
(+Low fPE)
2014 EPSg 9.9% 20.1% 12.1% 20.2%
2015 EPSg 9.3% 16.5% 10.2% 13.0%
2014 SPSg 6.8% 18.7% 7.0% 20.5%
2015 SPSg 6.4% 15.3% 6.0% 11.1%
Fwd PE 9.8 14.9 12.6 9.2
10yr z-score (0.58) 0.76 (0.28) (0.36)
Trailing PB 1.4 2.0 1.7 1.2
10yr z-score (1.21) (0.33) (0.87) (0.86)
Return (Ytd) 1.0% 10.4% 3.1% 5.1%
Volatility (10Y, Ann.) 25% 26% 27% 30%
Sharpe Ratio (10Y, Ann.) 0.66 1.06 0.32 1.23
FundementalValuationPrice
November 21, 2013 Asia Pacific
Goldman Sachs Global Investment Research 16
Exhibit 25: Growth stocks at modest valuations
B* indicates the stock is on Conviction Buy list.
Source: FactSet, MSCI, I/B/E/S, Goldman Sachs Global Investment Research
c) Europe-exposed stocks
While our Global Cyclicals thematic slice is largely concentrated in the Info Tech sector, we
also look at specific stocks that have high revenue exposures to DM (US and Europe) and
should therefore benefit from a meaningful recovery in external demand. We note that US-
exposed stocks (with at least 35% revenue exposure to the US) have risen 16% on an
average from June lows (vs. 12% for MXAPJ) and outperformed MXAPJ by 12% year-to-
date. On the other hand, the Europe-exposed stocks have lagged underperforming MXAPJ
by 11% year-to-date. Our economists forecast expansion in Euro area GDP of 1.1% in 2014
and 1.5% in 2015 coming after two years of contraction in output, which should bode well
for our EU-exposed stocks, in our view.
We highlight a list of 18 stocks with at least 30% revenue exposure to Europe and that are
currently trading at less than 20x P/E on 2014 expected earnings (Exhibit 26). The portfolio
has an average revenue exposure of 43% to Europe, compared to 8% for the overall region.
With 20.5% EPS growth and 13.1x P/E for next year (PEG ratio of 0.64), our Europe-exposed
portfolio offers a better growth/valuation profile than the overall region on average (15.9x
avg. P/E, 16.7% avg. EPS growth and PEG ratio of 0.95). The growth/valuation profile of our
Europe-exposed portfolio is also higher than the US-exposed basket with an average
revenue exposure of 51% to US and PEG ratio of 0.9 (16.5x avg. P/E and 19% EPS growth).
>75th
Percentile
<15X
Ticker Name Country Sector
Listed
Mkt Cap
(US$ mn)
6M
ADVT
(US$ mn)
Price
(Quote)
GS
Rating
12m
Potential
+/(-)%
2014E
EPSg
(%)
2015E
EPSg
(%)
2014E
SPSg (%)
Fwd PE
(X)
2014E
P/E (X)
2014E
P/B (X)
2014E
D/Y
(%)
2014E
ROE
(%)
2015E
ROE
(%)
037620 KP Mirae Asset Korea Insur. & other fin. 1,272 4 32300 NC - 66% 10% 69% 8.1 7.8 0.6 2.5% 8% 8%
SMM SP Sembcorp Marine Singapore Industrials 7,394 10 4.41 B 20% 26% 8% 28% 14.2 14.0 3.0 3.9% 22% 21%
PGAS IJ PT Perusahaan Gas Indonesia Utilities 10,118 13 4850 N 3% 31% 8% 25% 10.7 10.5 3.3 5.0% 32% 29%
813 HK Shimao Property China Property 8,509 17 19.00 B 3% 25% 15% 23% 6.6 6.5 1.1 4.7% 17% 17%
3008 TT LARGAN Precision Taiwan Computer H/W 4,510 45 994 B 36% 15% 12% 20% 13.0 12.9 3.7 3.0% 29% 27%
HCLT IS HCL Technologies India I.T. services 11,988 22 1086 B 22% 24% 12% 20% 12.8 12.7 3.5 1.4% 28% 25%
1 HK Cheung Kong Hong Kong Property 36,175 58 121 B* 19% 8% 6% 18% 9.4 9.3 0.7 2.8% 8% 8%
TTMT IS Tata Motors India Autos 16,437 53 386 B* 18% 22% 12% 15% 8.2 8.0 2.0 0.6% 24% 22%
3968 HK China Merc. Bank China Banks 9,071 42 15.32 B* 28% 6% 13% 15% 5.6 5.6 1.0 4.9% 18% 17%
175 HK Geely Automobile China Autos 4,518 33 3.98 B* 31% 14% 13% 15% 8.8 8.7 1.5 1.6% 17% 16%
Avg 24% 11% 25% 9.7 9.6 2.0 3.0% 20% 19%
APJ Avg. 17% 16% 11% 15.9 15.4 2.4 2.9% 15% 15%
November 21, 2013 Asia Pacific
Goldman Sachs Global Investment Research 17
Exhibit 26: We expect Europe-exposed Asian stocks to benefit as external demand recovers
Criteria: EU sales exposure > 30%, 2014 P/E < 20x
Note: B= Buy, N= Neutral, NC=Not Covered; * denotes stock is on our Regional Conviction List
Source: FactSet, MSCI, I/B/E/S, Goldman Sachs Global Investment Research.
Exhibit 27: While US-exposed stocks have outperformed, Europe-exposed stocks have lagged in the recent rally
Note: Europe-exposed stocks comprises of Asian stocks with more than 30% sales exposure to Europe; US-exposed stocks comprises of Asian stocks with more
than 35% sales exposure to US
Source: FactSet, MSCI, I/B/E/S, Goldman Sachs Global Investment Research
Ric Name
EU Sales
Exposure Market Sector Curncy
Price
(Quote)
Listed
market cap
(US$ mn)
3M ADVT
(US$ mn) GS Rating 2014 P/E
2014 EPS
Growth
HGG.AX Henderson Group 90% Australia Financials AUD 3.79 3,948 10.4 B 14.8 11.9
VARD.SI Vard Holdings 80% Singapore Industrials SGD 0.83 776 3.1 N 8.1 40.2
028050.KS Samsung Engineering 63% Korea Industrials KRW 64,800 2,460 30.0 N 14.1 -
AMC.AX Amcor 55% Australia Materials AUD 11.12 12,608 38.5 N 15.6 15.5
TEML.NS Tech Mahindra 51% India Software and services INR 1,734 6,144 34.4 B* 12.7 14.0
0013.HK Hutchison Whampoa 46% Hong Kong Industrials HKD 95.9 52,071 66.7 B 12.1 12.2
SCMN.SI Sembcorp Marine 46% Singapore Industrials SGD 4.41 7,394 9.4 B 14.0 26.0
006360.KS GS Engg & Construction 42% Korea Industrials KRW 32,200 1,525 17.0 N 14.3 -
BIOS.SI Biosensors International 40% Singapore Health Care SGD 0.89 1,205 2.6 N 14.2 4.4
000210.KS Daelim Industrial 38% Korea Industrials KRW 96,000 3,177 18.5 N 7.9 19.0
TISC.NS Tata Steel 38% India Steel, aluminium INR 386.1 5,762 48.0 NC 10.0 50.7
BXB.AX Brambles 35% Australia Industrials AUD 9.30 13,631 40.5 B 17.7 14.0
ITMG.JK PT Indo Tambangraya 34% Indonesia Oil and gas IDR 31,200 3,151 2.8 N 11.0 30.4
2439.TW Merry Electronics Co. 34% Taiwan Consumer Discretionary TWD 115 640 9.9 B* 12.8 55.3
IOIB.KL IOI Corp. Bhd. 33% Malaysia Consumer Staples MYR 5.46 10,937 7.2 N 17.9 1.7
0005.HK HSBC Holdings 32% Hong Kong Banks HKD 86.3 206,973 128.1 B 10.9 7.2
REDY.NS Dr. Reddy's Laboratories 30% India Health Care INR 2,464 6,610 12.5 CS 18.8 14.5
2018.HK AAC Technologies 30% China Offshore Comp. hardware/assemblers HKD 31.5 4,846 22.9 B 11.4 2.6
43% 13.1 20.5
8% 15.9 16.7
Europe-exposed stocks (Average)
MXAPJ (Equal-weight, Avg.)
80
90
100
110
120
130
140
150
Jan‐12
Mar‐12
May‐12
Jul‐12
Sep‐12
Nov‐12
Jan‐13
Mar‐13
May‐13
Jul‐13
Sep‐13
Nov‐13
MXAPJ
Europe-
exposed stocks
US-exposed
stocks
STOXX
600
85
90
95
100
105
110
115
120
125
130
75
80
85
90
95
100
105
110
115
Jan‐12
Mar‐12
May‐12
Jul‐12
Sep‐12
Nov‐12
Jan‐13
Mar‐13
May‐13
Jul‐13
Sep‐13
Nov‐13
MXAPJ
(rhs)
Europe-exposed stocks
vs. MXAPJ
(Equal-weighted)
November 21, 2013 Asia Pacific
Goldman Sachs Global Investment Research 18
2) Global Cyclicals vs. Asset Sensitive Financials
We recommended Global Cyclicals vs. Asset Sensitive Financials as one of our preferred
trades for the fourth quarter. So far, the trade has gained 5% while the MXAPJ has posted
flat returns. We continue to like this trade for 2014 as we believe Asian equities will benefit
next year from a moderate improvement in growth (largely helped by the recovery in the
US and EU) while liquidity will marginally tighten (Fed tapering and domestic policy
normalization). The net impact should be positive for areas with export orientation and
high revenue exposures to external demand while negative for asset price inflation. Along
these lines, the Global Cyclicals and Asset Sensitive Financials (which largely includes
property stocks) remain at opposite ends.
The entry point of the long/short trade still looks attractive with almost 13% upside to 2011
highs. In addition to this, growth/valuations profile for Global Cyclicals is also better than
that of Asset Sensitive Financials. Global Cyclicals trade at 9.8x forward P/E, which is a
20% discount to Asset Sensitive Financials (at 12.5x forward P/E). With 2014 EPS growth
of 16%, Global Cyclicals offers higher growth at a lower price (PEG ratio of 0.6) than both
Asset Sensitive Financials (PEG ratio of 1.0) and the overall region (PEG ratio of 1.1).
Exhibit 28: Global Cyclicals vs. Asset Sensitive Financials theme could continue to generate alpha as external demand
recovers and monetary policy normalizes
Source: Bloomberg, FactSet, Goldman Sachs Global Investment Research
Exhibit 29: Global Cyclicals offer better growth at lower price than both Asset Sensitive Financials and broader region
Source: Bloomberg, FactSet, Goldman Sachs Global Investment Research
90
95
100
105
110
115
120
125
130
Dec-09
Mar-10
Jun-10
Sep-10
Dec-10
Mar-11
Jun-11
Sep-11
Dec-11
Mar-12
Jun-12
Sep-12
Dec-12
Mar-13
Jun-13
Sep-13
Dec-13
Global Cyclicals vs. Asset Sensitive Financials
(Relative performance, indexed)
GSSZMSGC / GSSZMSFA
0.5
1.0
1.5
2.0
2.5
3.0
3.5
(1.00) (0.50) 0.00 0.5 1.0 1.5 2.0 2.5 3.0
USGrowthSensitivity
US Rates Sensitivity
Global Cyclicals
Rate-Sensitive Financials
Asset-Sensitive Financials
Commodity Cyclicals
Defensives
Domestic Cyclicals
Size of bubble indicates sensitivity to China Growth
6X
8X
10X
12X
14X
16X
18X
20X
22X
24X
26X
Dec-03
Dec-04
Dec-05
Dec-06
Dec-07
Dec-08
Dec-09
Dec-10
Dec-11
Dec-12
Dec-13
NTMPE
Global Cyclicals Asset-Sensitive Financials
Global Cyclicals are
trading at 20%
discount to Asset
Sensitive Financials
Global
Cyclicals
Asset-
Sensitive
Financials
MXAPJ
Valuation
P/E (NTM) 9.8 12.5 12.1
10yr Z-score P/E (NTM) (1.1) (0.9) (0.3)
Consensus Earnings
Growth
2013E (%) 19.2 4.9 7.0
2014E (%) 16.0 12.7 11.1
P/E to EPS growth
ratio
2014E (X) 0.6 1.0 1.1
November 21, 2013 Asia Pacific
Goldman Sachs Global Investment Research 19
3) Preferred downside hedge: Buy ASX 200 Mar-end 95% puts
Given the potential event risk in the early part of the year regarding timing and magnitude
of Fed tapering (our expectation is for tapering to begin in March), we highlight our
preferred hedge for investors looking to limit downside risk. We recommend buying
March-expiry outright puts on ASX 200 given our cautious stance on Australian equities
on weak domestic fundamentals coupled with inexpensive option pricing and attractive
risk-reward to recent lows. We summarize our key arguments below:
 Implied vol is low globally and currently trading in the bottom decile of its 7-
yr history across most markets. Short-dated implied vols have declined
significantly over the last few months with 3-month ATM implied vol on most
markets currently trading in the bottom decile of its 7-year history.
 We prefer outright puts to put-spreads given low vol and moderate skew.
Short-dated put -skew is still low, trading below average in most markets.
Consequently cost savings on put-spreads is currently less significant. Outright
puts thus offer better risk-reward for hedging, in our view.
 ASX 200 is more sensitive to a taper surprise given significantly higher
weighting in the high-yield defensives. The high-yield defensive parts of the
market may potentially come under pressure from Fed tapering. ASX 200 has
around 60% weighting in the high-yield defensives (dividend yield > 4%, beta <1)
significantly higher than other major markets globally and thus is more sensitive
to taper surprise in our view (Exhibit 32).
 ASX 200 puts are currently the most inexpensive across major markets
globally. Indicatively March-end expiry 95% puts on ASX 200 currently cost 1.55%,
the least expensive across markets globally.
 ASX 200 puts offer best payouts if markets revert to their recent lows. Given
event risk of potential Fed tapering, we look at the payouts (return on premium
paid) on various March-end expiry 5% OTM put options if indices were to revert to
their recent lows in late June / early July. Based on this metric, ASX 200 puts
would provide a return of 465% on premium paid, the highest across major
markets we track globally.
Risks: ASX 200 95% put buyers risk loss of upfront premium if index falls less than
5% by March-end expiry.
Exhibit 30: ASX 200 puts are the most inexpensive across
major markets globally
Exhibit 31: ASX 200 puts offer best returns if markets
revert to their respective lows in June/July this year
Source: Goldman Sachs Global Investment Research Source: Goldman Sachs Global Investment Research
0.5
1.0
1.5
2.0
2.5
3.0
3.5
4.0
4.5
EWZ
Nikkei 225
RDXUSD
EEM
FXI
EWY
HSCEI
EWJ
EuroStoxx50
Bovespa
HSI
NIFTY
S&P 500
FTSE 100
KOSPI 200
TWSE
ASX 200
Indicative cost of Mar-end 95% puts
(as % of spot)
‐50%
50%
150%
250%
350%
450%
550%
ASX 200
EuroStoxx50
EWY
Bovespa
KOSPI 200
HSI
S&P 500
HSCEI
FXI
Nikkei 225
EWJ
RDXUSD
FTSE 100
EEM
EWZ
NIFTY
TWSEReturn on premium paid at expiry
(if markets revert to their respective June/July lows)
November 21, 2013 Asia Pacific
Goldman Sachs Global Investment Research 20
Exhibit 32: ASX 200 has significantly higher weighting in
the high-yield defensives vs. rest of the world
Exhibit 33: Implied vol is low across markets and
currently trading in the bottom decile of its 7-yr history
Source: FactSet, local exchanges, MSCI, Goldman Sachs Global Investment
Research
Source: Goldman Sachs Global Investment Research
57
36
28
13
7
0
10
20
30
40
50
60
Australia UK Canada Europe US
Country wgt. in defensive high yield
Country-weight in high-yield defensives
(Div. yield > 4%, beta < 1)
10
20
30
40
50
60
70
80
Jan‐07
Jun‐07
Nov‐07
Apr‐08
Sep‐08
Feb‐09
Jul‐09
Dec‐09
May‐10
Oct‐10
Mar‐11
Aug‐11
Jan‐12
Jun‐12
Nov‐12
Apr‐13
Sep‐13
AEJ 3-month ATM implied vol (%)
(Avg. of KOSPI 200, HSI, HSCEI, NIFTY,
TWSE and ASX 200)
%tile since 
2007: 5%
November 21, 2013 Asia Pacific
Goldman Sachs Global Investment Research 21
Key questions for 2014
Will Asia recover its underperformance vs. DM in 2014?
 We believe Asia’s relative performance may improve if it can deliver the earnings
growth that we expect it to in 2014 and 2015, given:
o A low starting point: Asia (MXAPJ) has trailed the world index since mid-2010. In
2013 (ytd), Asia has lagged the global benchmark by 17pp, the 20th
percentile over
the past 25 years. This underperformance has been driven by compression in
relative valuation, which has retreated to 2005 levels in term of forward P/E.
o A better fundamental configuration: Our forecasts imply a more balanced return
profile among major equity markets globally, suggesting Asia is better
positioned fundamentally relative to DM in 2014 than in the past few years.
o Earnings recovery in Asia: Asia has struggled to grow earnings in the past 3 years.
While its DM peers have as well, investors seem to have traded weak margins
more than solid topline growth in Asia, leading to valuation de-rating. We forecast
Asia’s EPS to grow 10% and 14% in 2014/2015, with margins modestly expanding
in 2014 and further in 2015.
o Narrowing policy gaps: We expect the US to start normalizing its policy in 2014,
whereas Asia is already at a more mature tightening cycle. The closing gaps may
help support Asia’s relative returns, especially if the risks of tapering are better
reflected in asset prices than in summer 2013, as we argue in the macro section.
Exhibit 34: Asia has lagged the world index since 2010 Exhibit 35: Asia’s P/E discounts are back to 2005 levels
now
Exhibit 36: Margins will likely further recover in Asia Exhibit 37: Policy gaps between DM and Asia may
narrow
Source: DataStream, FactSet, Goldman Sachs Global Investment Research
50
75
100
125
150
175
200
225
Jan-00
Apr-01
Jul-02
Oct-03
Jan-05
Apr-06
Jul-07
Oct-08
Jan-10
Apr-11
Jul-12
Oct-13
Relative Performance Index (MXAPJ vs. MXWO)
-26pp
2013ytd rel. return: -17pp
(20th percentile in annal rel. return)
144
14.4
10yr z-score:
0.51
12.1
10yr z-score:
-0.27
8.0
9.0
10.0
11.0
12.0
13.0
14.0
15.0
16.0
17.0
18.0
-40%
-30%
-20%
-10%
0%
10%
20%
Nov-03
Nov-04
Nov-05
Nov-06
Nov-07
Nov-08
Nov-09
Nov-10
Nov-11
Nov-12
Nov-13
Fwd PE Prem/ Disc (MXAPJ v.s MXWO) MXAPJ vs. MXWO
The World index
MXAPJ
Forward PE (X)
-16%
10yr z-score:
-0.90
-10%
0%
10%
20%
30%
40%
50%
60%
-10%
0%
10%
20%
30%
40%
50%
60%
2010
2011
2012
2013E
2014E
2015E
2010
2011
2012
2013E
2014E
2015E
Consensus EPSg Consensus NM Consensus SPSg
MXWO MXAPJ
Less Margin
Compression
4.4 4.3
4.3
1.7
2.1
2.3
-4.0
-3.0
-2.0
-1.0
0.0
1.0
2.0
3.0
4.0
0.0
0.5
1.0
1.5
2.0
2.5
3.0
3.5
4.0
4.5
5.0
Feb-09
Jul-09
Dec-09
May-10
Oct-10
Mar-11
Aug-11
Jan-12
Jun-12
Nov-12
Apr-13
Sep-13
Feb-14
Jul-14
Dec-14
5Y govt yield (%)
Yield Gap (RHS) Asia (GDP-weighted) US
Yield Gap (%)
November 21, 2013 Asia Pacific
Goldman Sachs Global Investment Research 22
Will ASEAN regain momentum in 2014?
 We believe it may continue to lag the region in 2014 after having outperformed
from 2006 to 2012. 2H14 could be a better time to revisit.
 We believe the classic EM growth story remains intact for the ASEAN region:
Favorable base effect, ample room for productivity enhancement, strong demographics,
and much stronger balance sheet than in the previous crisis period (e.g. AFC).
 However, a few factors could pressure equity returns cyclically:
o Indonesia and Thailand need to slow excess credit growth, which has been
running hot in recent years. Also, they have to trim their current account deficits
further, mainly through suppressing domestic demand (i.e. higher policy rates,
demand-side tightening).
o These macro adjustments mean growth estimates may need to be revised down
further, leading to lower EPS growth. Our earnings forecasts for ASEAN markets
are generally below consensus in 2014; and
o ASEAN markets’ relative valuations to the region remain at the expensive side
of their historical ranges.
 We look to re-engage in 2H14 when political visibility emerges and cyclical
adjustments become mature.
Exhibit 38: The classic EM story remains intact for
ASEAN
Exhibit 39: While the base is low, cyclical adjustments are
needed in Indonesia, and to a lesser extent, Thailand
Note: Excess credit growth is calculate by subtracting the GDP growth (209-
2012) from the nominal credit growth (2009-2012)
Source: DataStream, FactSet, Goldman Sachs Global Investment Research Source: DataStream, FactSet, Goldman Sachs Global Investment Research
Exhibit 40: More downward revisions may take place Exhibit 41: Valuations do not look attractive yet
Source: DataStream, FactSet, Goldman Sachs Global Investment Research Source: DataStream, FactSet, Goldman Sachs Global Investment Research
ASEAN4 AeJ G7
*Capita stock
per worker
(US$)
18,432 49,276 225,191
*GDP per
Capita (US$)
5,532 5,956 45,798
Population
below 40
71% 62% 53%
Avg worker
wages (Mth,
US$)
372 1061 3494
* The numbers are weighted by GDP.
273%
253%
238%
172%
152% 145%
130%
96%
85%
56%
48%
52%
46%
31%
-7%
14%
25%
11%
8%
42%
-10%
0%
10%
20%
30%
40%
50%
60%
-50%
0%
50%
100%
150%
200%
250%
300%
HongKong
Singapore
China
Malaysia
Korea
Taiwan
Thailand
India
Philippines
Indonesia
Total debt to GDP (%)
Total Debt to GDP (2012)
Excess Credit Growth (09-12, RHS)
Excess Credit Growth (%)
-1%
0%
1%
2%
3%
4%
5%
6%
7%
8%
Jan-03
Jul-03
Jan-04
Jul-04
Jan-05
Jul-05
Jan-06
Jul-06
Jan-07
Jul-07
Jan-08
Jul-08
Jan-09
Jul-09
Jan-10
Jul-10
Jan-11
Jul-11
Jan-12
Jul-12
Jan-13
Jul-13
ASEAN Consensus Estimates GDP (yoy)
2004 GDP 2005 GDP 2006 GDP
2007 GDP 2008 GDP 2009 GDP
2010 GDP 2011 GDP 2012 GDP
2013 GDP 2014 GDP
19%
5yr z-score:
0.84
21%
5yr z-score:
0.67
-20%
-10%
0%
10%
20%
30%
40%
Jul-06
Nov-06
Mar-07
Jul-07
Nov-07
Mar-08
Jul-08
Nov-08
Mar-09
Jul-09
Nov-09
Mar-10
Jul-10
Nov-10
Mar-11
Jul-11
Nov-11
Mar-12
Jul-12
Nov-12
Mar-13
Jul-13
Nov-13
Valuation Prem/ Disc (ASEAN vs. MXAPJ)
Fwd PE Prem/ Disc
Trailing PB Prem/ Disc
November 21, 2013 Asia Pacific
Goldman Sachs Global Investment Research 23
What will re-rate Chinese banks?
 We believe specific policies will be the key re-rating catalysts for Chinese banks in
2014. We see upside risks to the sector as reform momentum gathers pace.
 Chinese banks are the fourth largest country-sector in MXAPJ, and are trading at
very low absolute valuations (5.1X 2014E P/E, 0.9X P/B), meaning decisions in this
area will have outsized impact on relative performance.
 Chinese banks’ valuations have significantly de-rated relative to their global and
regional peers, and are now implying a 6.1% NPL ratio, versus the 1% reported in 3Q.
These suggest a great deal of banks specific risk is already priced in.
 However, we do not think cyclical growth on its own or liquidity improvement
would be enough to re-rate Chinese banks (or prompt outperformance) because they
have become less sensitive to macro factors.
 In that vein, we think bank-specific policies including a timetable of interest rate
liberalization (remove overhang), more clarity on preferred share issuance scheme
(improve capital structure), more transparency on accounting and classifying liability
and NPLs (estimate potential loss), and potential measures regarding bad debt
management (NPL carve out, loss absorption, etc.) will be important share price drivers.
Exhibit 42: China banks are the 4th
largest country sector
in AeJ, and are trading at very low absolute valuations
Exhibit 43: Current market prices are implying 6.1% NPL
for Chinese banks
Source: DataStream, FactSet, Goldman Sachs Global Investment Research Source: DataStream, FactSet, Goldman Sachs Global Investment Research
Exhibit 44: Chinese banks have de-rated relative to global
peers
Exhibit 45: Chinese banks have become less sensitive to
macro factors
Source: DataStream, FactSet, Goldman Sachs Global Investment Research Source: DataStream, FactSet, Goldman Sachs Global Investment Research
9%
6% 5%
4%
4%
3%
3% 2% 2%
1%
13.8 14.0
7.3
5.1
12.0
12.6
8.9
10.9
18.4
14.0
4.0
6.0
8.0
10.0
12.0
14.0
16.0
18.0
20.0
0%
1%
2%
3%
4%
5%
6%
7%
8%
9%
10%
AUBanks
TWTech
KRTech
AUMetal
HKProperty
CNEnergy
CNTelcos
HKInsurance
INBanks
MXAPJ Weighting (%) 2014E PE (X)
ChinaBanks
6.3
5.7
6.4
8.4
6.0 5.8
5.5
6.7
8.2
6.6
5.8
6.7
8.8
6.16.1
5.2
6.0
5.6 5.85.8
4.8
6.2
5.35.4
0
1
2
3
4
5
6
7
8
9
ICBC(H)
BOC(H)
CCB(H)
ABC(H)
BoCom(H)
CMB(H)
CNCB(H)
Minsheng(H)
CQRCB
ICBC(A)
BOC(A)
CCB(A)
ABC(A)
BoCom(A)
CMB(A)
CNCB(A)
Minsheng(A)
SPDB
Industrial
HuaXia
BONB
BOBJ
BONJ
CEB
Formation covered by general provision Implied new formation
Buy-rated stocks 2013 NPL ratio
Average = 6.1
-29%
5yr z-score:
-1.34
-9%
5yr z-score:
-1.68
-19%
5yr z-score:
-1.00
-80%
-60%
-40%
-20%
0%
20%
40%
60%
80%
100%
120%
140%
160%
Jul-05
Dec-05
May-06
Oct-06
Mar-07
Aug-07
Jan-08
Jun-08
Nov-08
Apr-09
Sep-09
Feb-10
Jul-10
Dec-10
May-11
Oct-11
Mar-12
Aug-12
Jan-13
Jun-13
Nov-13
Trailing PB Prem/ Disc (%) CN Banks vs. MXAPJ Banks
CN Banks vs. World Banks
CN Banks vs. EM Banks
-6
-4
-2
0
2
4
6
Sep-08
Dec-08
Mar-09
Jun-09
Sep-09
Dec-09
Mar-10
Jun-10
Sep-10
Dec-10
Mar-11
Jun-11
Sep-11
Dec-11
Mar-12
Jun-12
Sep-12
Dec-12
Mar-13
Jun-13
Sep-13
Rolling 3Y t-Stat of CN CAI, FCI on MXCN banks return
CN FCI CN CAI
Insignificant zone (Critical value = +/- 1.96)
November 21, 2013 Asia Pacific
Goldman Sachs Global Investment Research 24
China internet and Macau gaming: Buy, hold, or sell?
 We recommend buying on any major corrections, China internet in particular.
 Macau gaming and China internet (HK- and US-listed) have been the favorite
‘consensus buy’ sectors in the HK/China universe. They boast strong fundamental
investment case; they are liquid; and have performed well enough that many investors
can’t afford to go underweight.
 Top-down, we think these two sectors are not yet at the levels where investors
should be too concerned about risks of overshooting, because:
o Their past 3Y returns don’t look stretched relative to historical boom-bust episodes;
o Their performance has been supported by fundamental earnings growth (and
upgrades), which appears healthier than past cases where valuation was a key
return driver.
 Bottom-up, while our analysts (and consensus) continue to forecast strong but declining
EPS growth for these two sectors, the growth is mostly contributed by top-line as
opposed to margin expansion (China internet in particular), suggesting that their
optimistic EPS growth forecasts are not aided by stretching their profitability
assumptions.
Exhibit 46: Macau gaming and China internet have been
the two best performing sectors in the past few years
Exhibit 47: Their performance does not look stretched
relative to some historical episodes
Source: DataStream, FactSet, Goldman Sachs Global Investment Research Source: DataStream, FactSet, Goldman Sachs Global Investment Research
Exhibit 48: The rally has been backed by fundamentals Exhibit 49: EPS growth is not driven by stretching
margins
Source: DataStream, FactSet, Goldman Sachs Global Investment Research Source: DataStream, FactSet, Goldman Sachs Global Investment Research
66%
64%
66%
43%
67%
60%
21%
56%
59%
45%
52%
55%
62%
51%
61%
51%
40%
20%
30%
40%
50%
60%
70%
-100%
0%
100%
200%
300%
400%
500%
600%
700%
Macau(626%)
CNInternet(244%)
HKTelcos(82%)
HKDisc.(56%)
HKIndustrials(51%)
CNUtilities(47%)
HKUtilities(33%)
HKFin.(19%)
CNTelcos(10%)
CNStap.(-1%)
CNEnergy(-4%)
CNHealthcare(-16%)
CNFin.(-18%)
CNDisc.(-21%)
CNIndustrials(-26%)
CNMaterials(-43%)
HKI.T.(-47%)
Return since 2010 (%)
Return since 2010
% of buy rating (RHS)
I/B/E/S Consensus Rating (%)
0
100
200
300
400
500
600
700
800
900
T=0
T=7
T=14
T=21
T=28
T=35
T=42
T=49
T=56
T=63
T=70
T=77
T=84
T=91
T=98
T=105
T=112
T=119
T=126
T=133
T=140
T=147
T=154
Rebased Performance Index
KR Telcos (TMT)
KR ID (China 03-07)
CN Property
(China 03-07)
CN Materials
(China 03-07)
Macau Gaming
TW I.T. (TMT)
JP Property (1980s)
CH Software
(# of Weeks)
3 years before the peak
63%
472%
603%
475%
630%
244%
182%
-19%
294%
84%
185% 136%
-18% -13%
82%
178%
519% 290%
494%
262%
195%
-100%
0%
100%
200%
300%
400%
500%
600%
700%
-100%
0%
100%
200%
300%
400%
500%
600%
700%
JapanProperty
KRTelcos+TWI.T.
ChinaRealEstate
ChinaMaterials
KoreaIndustrials
MacauGaming
ChinaSoftware
% Chg in country sectors rally (since 3 years before the peak)
Price Chg
Earnings Chg
Valuation Chg
-30%
-20%
-10%
0%
10%
20%
30%
40%
50%
60%
70%
80%
2011
2012
2013E
2014E
2015E
EPSg NM SPSg
Macau Gaming
2011
2012
2013E
2014E
2015E
China Internet
November 21, 2013 Asia Pacific
Goldman Sachs Global Investment Research 25
How should investors position in the tech sector?
 While we think internet and software (a.k.a new technology) will continue to do
well in 2014, we expect ‘Old tech’ to perform better than in 2013.
 Tech is the 2nd largest sector in MXAPJ, accounting for 14.5% of the regional index
weighting of which 54% comes from Samsung and TSMC combined.
 Regional tech has performed reasonably well so far in 2013 but with noticeable
divergence: ‘New tech’ has significantly outperformed ‘Old tech’, which primarily
focuses on semi and hardware design and manufacturing.
 As noted in several sections in this report, we expect ‘New tech’ to continue to perform
well, backed by secular growth drivers. However, we think ‘Old tech’ will likely have a
better year in absolute return terms, because:
o Valuation has now reached arguably attractive levels in both absolute and
relative terms;
o Our analysts remain fundamentally bullish on Samsung (Buy) and TSMC (Buy,
on Conviction List), the largest and 5th
largest stocks in MXAPJ;
o Thematically, ‘Old tech’ appears more favorably skewed towards a DM recovery
story given their revenue exposures there.
Exhibit 50: ‘New tech’ has generated significant alpha for
investors in 2013...
Exhibit 51: ...but ‘Old tech’ still remains important for
absolute returns given its heavy index weighting
Source: DataStream, FactSet, Goldman Sachs Global Investment Research Source: DataStream, FactSet, Goldman Sachs Global Investment Research
Exhibit 52: The valuation gaps between ‘New’ and ‘Old’
are quite substantial
Exhibit 53: ‘Old tech’ seems better positioned for a DM
recovery theme
Source: DataStream, FactSet, Goldman Sachs Global Investment Research Source: DataStream, FactSet, Goldman Sachs Global Investment Research
78%
68% 65%
31%
8% 7%
1%
-11% -12%
-40%
-20%
0%
20%
40%
60%
80%
KRSoftware
CNSoftware
CNSemi
INSoftware
MXAPJTech
TWSemi
KRSemi
TWComp.H/W
KRComp.H/W
Ytd Return (%, USD)
KR Semi
33%
KR Software
4%
KR Comp. H/W
3%
TW Semi
23%
TW Comp. H/W
16%
CN Software
10%
CN Comp. H/W
2%
CN Semi
0%
IN Software
8%
Korea
39%
Taiwan
39%
China
12%
India
8%
Weighting in MXAPJTech (%)
22.5
10yr z-score:
0.81
12.1
10yr z-score:
-0.19
8.4
10yr z-score:
-1.05
5.0
7.0
9.0
11.0
13.0
15.0
17.0
19.0
21.0
23.0
25.0
Jan-10
Mar-10
May-10
Jul-10
Sep-10
Nov-10
Jan-11
Mar-11
May-11
Jul-11
Sep-11
Nov-11
Jan-12
Mar-12
May-12
Jul-12
Sep-12
Nov-12
Jan-13
Mar-13
May-13
Jul-13
Sep-13
Nov-13
Fwd PE (X)
MXAPJ Software & Services
MXAPJ Technology H/W
MXAPJ Semi
99% 97%
75%
61%
51% 49%
42%
16%
8%
13%
22%
38%
21%
53%
9%
17% 17%
9%
20%
24%
9% 9% 10%
4%
17%
8%
0%
10%
20%
30%
40%
50%
60%
70%
80%
90%
100%
CN
Software
KR
Software
KR
Comp.
H/W
CN
Comp.
H/W
TW
Comp.
H/W
TW Semi KR Semi IN
Software
Sales exposure as % of total Others EU US Asia
November 21, 2013 Asia Pacific
Goldman Sachs Global Investment Research 26
Performance context: Intra-regional differentiation at play
Year-to-date, the MXAPJ index essentially posted flat returns, but beneath the headline,
the region had a tough summer followed by a sharp rebound. With excessive volatility
coupled with frequent market rotations, the risk-reward on AEJ equities this year has been
less attractive compared to DM equities or Asian currencies. We highlight various themes
that were in play in 2013 which inform our views and implementation ideas for next year:
 A difficult “flat” year with less attractive risk-reward. MXAPJ has essentially
posted flat returns ytd, but beneath the surface the region has witnessed a roller-
coaster ride with four rallies and four pullbacks. Looking over the past 26 years of
history, the ytd returns for MXAPJ are well below historical averages (at 36th
percentile in absolute terms and at 20th percentile relative to DM equities). To
capture the excessive volatility, we compare AEJ with DM equities and currencies
on a risk-adjusted return basis (as measured by returns / realized vol) and note that
DM equities and Asian FX have had much better risk-adjusted returns than AEJ
equities.
 Frequent market rotations: country macro in focus. Market leadership
continued to rotate frequently in 2013, continuing the pattern in 2012. Korea fell
almost 15% during 1H13, underperforming MXAPJ, but bounced back 15% in 3Q
posting the best returns in the region. Similarly ASEAN retained its leadership in
1H13 but underperformed in 2H13 on concerns over Fed tapering. Sector
leadership saw relatively less intense rotations. Looking at the dispersion of
returns (as measured by standard deviation) also shows that country dispersion
was higher in 2013.
 Currency weakness impacting total equity returns. Most Asian currencies
weakened in 2013 impacting the total returns in dollar terms (particularly for South
Asian markets). For example, currency depreciation subtracted 13% and 17% from
India and Indonesia, respectively, in US dollar total return terms and 5% return
from the overall region. We have previously noted that FX changes make up on
average 25% of short and longer-term total returns and expect currency to play an
important role next year as well.
 Better stock picking opportunities. Average stock correlations, which had risen
during the May-June sell-off, have reduced meaningfully suggesting more
opportunities for bottom-up stock picking.
 Several intra-regional themes at play. The excessive volatility coupled with
frequent market rotations made navigating the investment environment tougher
this year. But several intra-regional trends were still at play, as summarized below:
o North Asia outperformed ASEAN. We argued at the beginning of the
year that ASEAN would underperform the region in 2013 after 7 years of
consistent outperformance. Although ASEAN continued to do well early in
the year, it came under intense pressure during the summer. The North
Asian markets also rallied strongly post summer and outperformed South
Asia (India, ASEAN) by 23% from their July low.
o Thematic alpha opportunities. Notwithstanding frequent rotation,
several macro themes, as embodied in our “macro slice” framework,
priced consistently in 2013. Global Cyclicals consistently outperformed
given tailwinds of improving DM growth and weaker Asian currencies.
Asset Sensitive Financials and Commodity Cyclicals remained under
pressure given headwinds of Fed tapering and slowing China growth.
November 21, 2013 Asia Pacific
Goldman Sachs Global Investment Research 27
Exhibit 54: DM equities have had much better risk-adjusted returns than MXAPJ in 2013
Source: Bloomberg, FactSet, MSCI, Goldman Sachs Global Investment Research
Exhibit 55: Most Asian currencies have also had better risk-adjusted returns than AEJ equities
Source: Bloomberg, FactSet, MSCI, Goldman Sachs Global Investment Research
Exhibit 56: Stock correlations have reduced, suggesting
“alpha” opportunities
Exhibit 57: Correlation of market returns is still quite
negative, indicating frequent rotation
Source: FactSet, MSCI, Goldman Sachs Global Investment Research Source: FactSet, MSCI, Goldman Sachs Global Investment Research
Price returns Realized vol
2013 Ytd %tile vs. Vol-adj returns %tile vs.
returns 26-yr history (Returns / vol) 26-yr history
S&P 500 ($) SPX 26.1% 76% 10.0 2.61 96%
Topix (¥) TPX 44.4% 96% 23.3 1.91 84%
Stoxx Europe 600 (£) SXXP 15.5% 60% 11.5 1.35 64%
MSCI Asia-Pac ex-Japan ($) MXAPJ 2.5% 36% 12.6 0.20 36%
MSCI Emerging Market ($) MXEF -3.0% 40% 13.1 -0.23 40%
MXAPJ vs. MSCI Dev. World ($) MXAPJ / MXWO -15.6% 20% 11.0 -1.42 4%
Risk-adjusted returns
Equities Ticker 2013 Ytd rlzd
vol (%)
0.00
0.20
0.40
0.60
0.80
1.00
1.20
1.40
1.60
IDR
Australia
INR
JPY
AUD
PHP
Malaysia
MYR
TWD
THB
SGD
Philippines
Taiwan
Hong Kong
India
Singapore
China
EUR
Thailand
KRW
MXAPJ
HKD
Korea
Indonesia
Equities FX
3.6
Absolute Risk-adjusted returns
(Returns / realized vol, YTD)
20%
30%
40%
50%
60%
70%
80%
Nov-08
May-09
Nov-09
May-10
Nov-10
May-11
Nov-11
May-12
Nov-12
May-13
Nov-13
Avg Stock Correlation
(3-mo correlation with MXAPJ)
"Macro"
Trading
"Micro"
Trading
-0.50
-0.25
0.00
0.25
0.50
May-96
Mar-97
Jan-98
Nov-98
Sep-99
Jul-00
May-01
Mar-02
Jan-03
Nov-03
Sep-04
Jul-05
May-06
Mar-07
Jan-08
Nov-08
Sep-09
Jul-10
May-11
Mar-12
Jan-13
Nov-13
Correlation
This month's return vs. last month's return
(across Asian markets, 12-mo avg)
Relative to the past 17 years, 2012 and 2013
are years of extreme rotation
November 21, 2013 Asia Pacific
Goldman Sachs Global Investment Research 28
Exhibit 58: Market rotation has been more intense than sector rotation
Source: FactSet, MSCI, Goldman Sachs Global Investment Research
Exhibit 59: Markets have varied more than sectors,
indicating country macro was more in focus
Exhibit 60: Currency weakness has had a significant
impact on MXAPJ market returns in USD terms
Source: FactSet, MSCI, Goldman Sachs Global Investment Research Source: FactSet, MSCI, Goldman Sachs Global Investment Research
Exhibit 61: North Asian markets have outperformed
South Asia
Exhibit 62: Global Cyclicals have outperformed Asset
sensitive financials
Source: FactSet, MSCI Source: Bloomberg, Goldman Sachs Global Investment Research
Quarterly Market Rotation (US$ Returns)
1Q13 2Q13 3Q13 4Qtd
Australia 8% Taiwan 2% Korea 15% India 7%
ASEAN 6% ASEAN -5% China 11% China 6%
HK 3% HK -6% Australia 10% Korea 4%
Taiwan 0% India -6% HK 8% Australia 4%
India -3% China -9% Taiwan 1% ASEAN 3%
Korea -4% Korea -10% India -6% HK 3%
China -5% Australia -15% ASEAN -6% Taiwan 1%
Outperform
In-Line
Underperform
Quarterly Sector Rotation (US$ returns)
1Q13 2Q13 3Q13 4Qtd
Healthcare 7% Telcos. 1% Materials 13% Cons. Disc. 6%
Utilities 6% Info. Tech. -4% Cons. Disc. 10% Info. Tech. 5%
Financials 6% Cons. Disc. -4% Industrials 9% Healthcare 5%
Cons. Stap. 4% Healthcare -6% Info. Tech. 7% Materials 5%
Info. Tech. 1% Cons. Stap. -7% Energy 7% Financials 5%
Cons. Disc. 0% Utilities -8% Financials 5% Energy 4%
Industrials -1% Industrials -9% Healthcare 3% Cons. Stap. 3%
Telcos. -2% Financials -10% Cons. Stap. 2% Industrials 2%
Energy -4% Energy -14% Telcos. 1% Utilities 1%
Materials -9% Materials -15% Utilities 1% Telcos. -1%
Outperform
In-Line
Underperform
(6.0)
(4.0)
(2.0)
0.0
2.0
4.0
6.0
8.0
Mar-06
Jul-06
Nov-06
Mar-07
Jul-07
Nov-07
Mar-08
Jul-08
Nov-08
Mar-09
Jul-09
Nov-09
Mar-10
Jul-10
Nov-10
Mar-11
Jul-11
Nov-11
Mar-12
Jul-12
Nov-12
Mar-13
Jul-13
Nov-13
in Local currency in USD
Higher COUNTRY
dispersion
Higher SECTOR
dispersion
Country LESS Sector Dispersion
(Rolling 3-mo return basis)
% YTD returns
(Local)
YTD returns
(US$)
Australia 17% Hong Kong 8%
Philippines 11% Australia 5%
Malaysia 8% Philippines 4%
Hong Kong 8% Korea 3%
MXAPJ 7% Malaysia 3%
India 5% Taiwan 3%
Taiwan 4% China 3%
Singapore 3% MXAPJ 2%
China 3% Singapore 1%
Korea 2% Thailand -4%
Thailand -1% India -8%
Indonesia -2% Indonesia -19%
85
90
95
100
105
110
Jan-13
Feb-13
Mar-13
Apr-13
May-13
Jun-13
Jul-13
Aug-13
Sep-13
Oct-13
Nov-13
MXAPJ
(local, +7% ytd)
MXAPJ
(US$, +2% ytd)
85
90
95
100
105
110
115
Jan‐13
Feb‐13
Mar‐13
Apr‐13
May‐13
Jun‐13
Jul‐13
Aug‐13
Sep‐13
Oct‐13
Nov‐13
North Asia vs.South Asia
(Relative performance, indexed)
North Asia = China, Korea and Taiwan ; South Asia = India and ASEAN
+23%
-9%
90
92
94
96
98
100
102
104
106
108
110
Dec-12
Jan-13
Feb-13
Mar-13
Apr-13
May-13
Jun-13
Jul-13
Aug-13
Sep-13
Oct-13
Nov-13
Global Cyclicals vs. Asset Sensitive Financials
(Relative performance, indexed)
GSSZMSGC / GSSZMSFA
November 21, 2013 Asia Pacific
Goldman Sachs Global Investment Research 29
Macro: Return expectations, views, and path
Bottom-line: Roughly 10% fundamental-driven returns, event-
dependent path and trading strategies
 Our 2014 macro forecasts for Asia: Growth to improve moderately (6.1% to 6.4%),
inflation to stay in check (3.4% to 3.9%), policy to tighten marginally (+40bps on
average across AeJ), and Asian FX to weaken vs. the USD (-3% weighted by GDP).
The key growth delta is the macro recovery in DM, and its reinforcing impact on
domestic demand in Asia.
 Top-down returns expectation: Close to 10% fundamental upside for MXAPJ
(slightly different from our official forecast); likely range between 470 and 580, +/-
10% from our end-14 MXAPJ target of 525.
 An eventful policy and political year: QE tapering in the US (March 2014), growth
rebalancing and reform in China, potential further easing in Japan (April 2014),
and important elections in Europe and South Asia in mid-2014.
 An event-dependent path and intra-year allocation, specifically:
1. Start the year with a positive tilt to China on a favorable yoy growth trend
and liquidity combo and potential carry-through of positive reform
momentum from 4Q13, and stay conservative on ASEAN due mainly to the
looming tapering concerns;
2. Look to accumulate Korea, especially on weakness, around the BoJ
meeting in April to trade a better external demand picture in 2H14 and 2015;
3. Watch for buying opportunities for Indonesia, and possibly India around
summer when political visibility emerges and cyclical adjustments mature
there;
4. Turn aggressive on broad market beta in 2H14, notably our three earnings-
related ideas, for a potential acceleration in earnings growth in 2015.
Baseline views for 2014: Growth to improve moderately, inflation to
stay in check, and policy to tighten marginally
 Our economists expect the overall growth picture for AEJ to improve next year,
from 6.1% in 2013 to 6.4%, in line with current consensus;
 The driver of growth would be a meaningful recovery in external demand, and
the resulting positive spillover to domestic private consumption growth. The
external demand recovery will be led by the US (2.9% in 2014), which may operate
close to trend growth, and the Euro area, which may return to expansion (+1.1%)
after staying in recession for two consecutive years (-0.6% for 2012 and -0.4% for
2013);
 Inflation is likely to edge higher to 3.9% for 2014, from 3.4% in 2013 as output
gaps close;
 Liquidity normalization may continue given our expected QE tapering in the US,
and forecasted policy rate hikes across Asian economies;
 Except for SGD and PHP, our economists see Asian FX generally trading weaker
against the USD as the US begins to normalize its policy in 2014.
Details of our economists’ forecast on growth, inflation, rates, and FX are shown in
Appendix 1.
November 21, 2013 Asia Pacific
Goldman Sachs Global Investment Research 30
Exhibit 63: The growth and inflation configuration for
AEJ is likely to be similar to 2013
Exhibit 64: Our economists expect a moderate pickup in
growth, in line with consensus expectation
Source: DataStream, FactSet, Goldman Sachs Global Investment Research Source: DataStream, FactSet, Goldman Sachs Global Investment Research
Exhibit 65: Growth contribution will likely come from net
exports and the ripple effects on local consumption
Exhibit 66: Liquidity conditions may normalize in Asia,
partly driven by QE tapering in the US
Note: The forecasted paths are calculated based on our interest rate forecasts
Source: DataStream, FactSet, Goldman Sachs Global Investment Research Source: DataStream, FactSet, Goldman Sachs Global Investment Research
Translating our macro expectations into equity returns
 Approach 1: Top-down regression model points to 8% upside for the region.
 While we fully acknowledge the drawbacks of basing our views on regression
models, it helps distill the macro-to-market transmission mechanisms and locate a
reasonable range of where fair value may lie relative to macro fundamentals, in
our view.
 Specifically, we employ two models—level and yoy return for MXAPJ—to estimate
fundamental upside for the region. Our models, which incorporate GDP growth,
inflation, financial conditions (US and Asia), and nominal earnings in Asia, show
8% potential upside for the MXAPJ index in 2014 (USD), based on our end-14
forecasts on these variables.
2003
2004
2005
2006
2007
2008
2009
2010
2011
2012
2013E
2014E
5
6
7
8
9
10
11
0 1 2 3 4 5 6 7
AnnualrealGDP(yoy)
Annual CPI (yoy)
Year
GS Consensus GS Consensus
Dec-03 6.4% 7.3% 6.5% 90 bp 10 bp
Dec-04 8.2% 6.8% 6.8% -140 bp -140 bp
Dec-05 7.7% 7.6% 7.1% -10 bp -60 bp
Dec-06 8.7% 8.2% 7.6% -50 bp -110 bp
Dec-07 9.5% 8.5% 8.8% -100 bp -70 bp
Dec-08 7.0% 5.5% 6.3% -150 bp -70 bp
Dec-09 5.7% 8.7% 7.6% 300 bp 190 bp
Dec-10 9.1% 8.4% 7.8% -70 bp -130 bp
Dec-11 7.4% 7.1% 7.2% -30 bp -20 bp
Dec-12 6.2% 6.9% 6.6% 70 bp 40 bp
Dec-13 6.1% 6.4% 6.4% 30 bp 30 bp
Change in GDP growth
expectationsGS Current year
expected GDP
(yoy)
Next year GDP growth
(yoy)
Asia ex-Japan
2.5 2.6 2.8 2.9 2.6 2.7
1.0
1.7
0.8 0.9
1.0 1.2
0.6 0.4
0.4
0.4
2.6 2.5
3.9 3.4
1.4 1.4
0.4
1.0
0.3 0.4
0.0 0.2
0.2
0.7
1.0
0.7
-1.0
0.0
1.0
2.0
3.0
4.0
5.0
6.0
7.0
8.0
2013E 2014E 2013E 2014E 2013E 2014E 2013E 2014E
AeJ China South Asia North Asia
Real GDP (yoy) Net Exports
Total Fixed Investment
Public consumption
Private Consumption
99 (1% yoy)
102 (0.7% yoy)
96
98
100
102
Jan-09
Jun-09
Nov-09
Apr-10
Sep-10
Feb-11
Jul-11
Dec-11
May-
12
Oct-12
Mar-13
Aug-13
Jan-14
Jun-14
Nov-14
FCI Ex-Equity (Yr 1999 = 100)
US FCI AeJ FCI
Financial tightening
Financial loosening
November 21, 2013 Asia Pacific
Goldman Sachs Global Investment Research 31
 Approach 2: Earnings growth/valuation sensitivity suggests the fair value of
MXAPJ may range from 470 to 580.
 We complement our top-down return forecasts with bottom-up earnings and
valuation analysis.
 A combination of our 14/15 EPS growth forecast of 10%/14% and a target forward
P/E multiple of 12.0X in Dec 2014 suggests MXAPJ should trade at 525 by end-14,
10% upside from current levels.
 To account for forecasting errors (EPS growth) and potential valuation over-/under-
shoots (+/- 0.5 standard deviation), we believe the reasonable fair-value range for
MXAPJ should be bounded between 470 and 580, about 10% downside/upside
from our base-case return. This is admittedly a wide range but not an implausible
one given the volatility that we have seen so far this year.
Exhibit 67: Our top-down model for MXAPJ suggests around 8% for the regional market
Source: FactSet, MSCI, Bloomberg
Exhibit 68: A combination of our EPS growth forecast and target P/E multiple suggests a reasonable range of 470 to
580
Source: FactSet, MSCI, Bloomberg
514
0
100
200
300
400
500
600
Dec-95
Dec-96
Dec-97
Dec-98
Dec-99
Dec-00
Dec-01
Dec-02
Dec-03
Dec-04
Dec-05
Dec-06
Dec-07
Dec-08
Dec-09
Dec-10
Dec-11
Dec-12
Dec-13
Dec-14
MXAPJ Index Level
MXAPJ
Fitted line
Dependent Variable = MXAPJ price level
Format Variables Coefficients t-Stat Assumption
Level Intercept -59 -4.8 -
yoy Regional GDP 1866 12.5 6.4%
yoy Regional CPI 837 4.2 3.9%
yoy Regional FCI -3293 -8.1 0.7%
level nominal tEPS 11 29.5 10.0%
R^2 89%
2014 expected annual return 8%
Format Variables Coefficients t-Stat Assumptions
Level Intercept -0.6 -12.9 -
yoy Regional GDP 10.2 16.5 6.4%
yoy Regional CPI 0.9 1.2 3.9%
yoypp UST10Y 11.7 7.6 0.5%
yoy Regional FCI -8.6 -5.9 0.7%
R^2 75%
2014 expected annual return 7%
7%
-80%
-60%
-40%
-20%
0%
20%
40%
60%
80%
100%
Dec-95
Dec-96
Dec-97
Dec-98
Dec-99
Dec-00
Dec-01
Dec-02
Dec-03
Dec-04
Dec-05
Dec-06
Dec-07
Dec-08
Dec-09
Dec-10
Dec-11
Dec-12
Dec-13
Dec-14
MXAPJ (USD, yoy)
MXAPJ
Fitted line
Dependent Variable = MXAPJ yoy return
Avg. 2014 expected annual return = 8%
Estimate - 5% Estimate + 5%
-2.5% 0.0% 2.5% 5.0% 7.5% 10.0% 12.5% 15.0% 17.5% 20.0% 22.5%
10.8 417 427 438 449 459 470 481 491 502 513 523
11.0 426 437 448 459 470 481 492 503 514 525 536
Target - 0.5SD 11.3 436 447 458 470 481 492 503 514 525 537 548
11.5 446 457 469 480 491 503 514 526 537 549 560
11.8 455 467 479 490 502 514 525 537 549 560 572
12.0 465 477 489 501 513 525 537 549 560 572 584
12.3 475 487 499 511 523 536 548 560 572 584 596
12.5 484 497 509 522 534 547 559 571 584 596 609
Target + 0.5SD 12.8 494 507 519 532 545 557 570 583 596 608 621
13.0 504 517 530 543 556 568 581 594 607 620 633
13.3 514 527 540 553 566 579 593 606 619 632 645
2014 EPS Growth (%)
TargetForwardPEMultiple(X)
GS 2014E
EPS Growth
2014 year-end target
Fwd PE multiple
November 21, 2013 Asia Pacific
Goldman Sachs Global Investment Research 32
Framing views and path around macro and political events
We anticipate an eventful year in terms of macro, political, and policy developments
globally: QE tapering in the world’s largest economy, growth rebalancing and reform in
the 2nd
largest (China), a potential increase of QE in the 3rd
largest (Japan), and important
elections in select parts of Europe and Asia where the results may have significant
implications to the rest of their regions, and even to the global markets.
In this vein, while our macro forecasts, which drive our equity return forecast for Asia,
reflect our best estimate of how fundamentals may evolve over the course of 2014, these
event uncertainties imply the variance around our base case would likely be high.
Additionally, the rapid advancement and adoption of technology, globalization, and
high equity valuations (average) will likely further complicate the reaction functions
in the equity market than would normally be implied by simple historical analysis.
Below, we overlay our fundamental return expectations with our view on the
aforementioned macro and political events, aiming to form a guide as to how and when
the market may trade these events, and calibrate our intra-year market allocations and
strategies accordingly.
Exhibit 69: Our hypothetical path of return: A slow start, followed by a strong finish
Source: Goldman Sachs Global Investment Research.
1) QE tapering in March 2014: A less dramatic response than in summer 2013
 Our expectations: The Fed to begin tapering in March 2014 (from US$85bn/month
to US$75bn), and exit QE by the end of 2014. However, its strong commitment to
forward guidance should keep financial conditions at very accommodative levels,
especially at the front-end of the yield curve. Our economists expect the 10Y UST
to rise to 3.25% by end-14.
 Non-linear and specific impact to Asian equities: Equities that are favorably
exposed to improving global demand but less affected by rising rates (interest cost,
valuation, FX, and property), and vice versa. By markets and sectors, they include
Korea, autos, and select financials on the long side, and Australia, Philippines, HK,
utilities, telecoms, and property on the short side (Exhibit 70).
470
480
490
500
510
520
530
Dec-13
Jan-14
Feb-14
Mar-14
Apr-14
May-14
Jun-14
Jul-14
Aug-14
Sep-14
Oct-14
Nov-14
Dec-14
MXAPJ Index
Mar 2014
1)US QE Tapering
2)China policy
momentum carries
over 1Q
Apr 2014
BOJ Monetary
Policy Meeting
(Potential stimulus
announcement)
2H2014
2015E EPS growth
accelerates
2014E MXAPJ
return +10%
May-July 2014
Indonesia, India, UK,
Spain, Portugal,
Greece Election
1Q14 2Q14 3Q14
November 21, 2013 Asia Pacific
Goldman Sachs Global Investment Research 33
 How will the market react when the Fed tapers in March? We believe the
reaction will be less dramatic than in summer 2013 when MXAPJ plunged 16%
from peak to trough, given: a) the meaningful macro and asset market adjustments
that have been made in several CA deficit economies; b) US rates are less
undervalued from a term-premium standpoint and relative to our Sudoku model,
and; c) market participants are arguably better prepared, mentally and in terms of
positioning. That said, we still believe the expectation of QE tapering will keep
Asia, notably South Asia, under pressure until this overhang is removed.
Exhibit 70: QE tapering framework: We think the impact on Asian equities would be non-linear and specific
Source: Goldman Sachs Global Investment Research
Exhibit 71: We expect current accounts in South Asia to
improve in 2014
Exhibit 72: US rates are currently more in line with
fundamentals
Source: DataStream, FactSet, Goldman Sachs Global Investment Research Source: DataStream, FactSet, Goldman Sachs Global Investment Research
Exhibit 73: Asian financial assets appear less vulnerable to the QE/liquidity shocks than they were in May
Source: Goldman Sachs Global Investment Research
Improving growth and
rising interest rate
Higher Interest rate
AU/TH;
Utilities/
Transport.
Utilities/
Telecoms
Philippines
Multinational
banks and
regional insurers
Property
Foreign
Exchange
Growth recovery
(Better demand
outlook)
Korea,
Taiwan
Autos/
Industrials
Cost of
funding
Yield
compression
Valuation
compression
Yield curve
shift/
steepening
Exporters Cyclicals
Potentially
stronger
USD
Real asset
valuation
Hong Kong/
Regional
property
Asian
exporters
to the US
Companies
reporting in
USD/ CA deficit
Potential
Beneficiaries
Potential
Losers
16.5
1.0 1.5 1.7
3.0
8.3
-5.1
-3.1
-1.4
0.8
2.0
-4.4 -4.0 -3.9
-2.9-2.2
-4.9
-3.1 -3.8
-2.9
3.84
2.49
2.61
2.75
3.25
2.0
2.2
2.4
2.6
2.8
3.0
3.2
3.4
3.6
3.8
4.0
-6
-3
0
3
6
9
12
15
18
2009 2013-2Q 2013E-3Q 2013E-4Q 2014E
Current Account Deficit (As % of GDP)
Malaysia Thailand
Indonesia India
UST10Y (RHS)
UST10Y Yield
1.0
1.5
2.0
2.5
3.0
3.5
4.0
4.5
2009
2010
2011
2012
2013
2014
2015
2016
(%)
+/- 1 std dev. US 10-yr yield
Sudoku 'Fair' Value Current Market Pricing
Old GS forecast
5%
-1%-1%
-4%-5%-5%
-7%
-13%
-16%-17%
-28%
-4%
10%
-35%
-30%
-25%
-20%
-15%
-10%
-5%
0%
5%
10%
15%
Korea
China
HongKong
Taiwan
Australia
Malaysia
Singapore
India
Thailand
Philippines
Indonesia
MXAPJ
SPX
Chg in equities since May peak (USD, %)
3%
1% 0%
0%
-2%
-6%
-6% -6%
-8%
-13%
-15%
-4%
-16%
-12%
-8%
-4%
0%
4%
KRW
CNY
HKD
TWD
SGD
PHP
THB
MYR
AUD
INR
IDR
DXY
Chg in FX since May peak (%)
239
121
75 71
50 46 43 41 39 34
-56
58
-100
-50
0
50
100
150
200
250
300
Indonesia
India
Australia
China
Thailand
Korea
HongKong
Singapore
Taiwan
Malaysia
Philippines
US
Chg in bond yield Since May Peak (bps)
November 21, 2013 Asia Pacific
Goldman Sachs Global Investment Research 34
2) China: 1H is likely a better trading environment
A reasonably favorable growth + liquidity combo in 1H14; reform momentum may
continue. Besides improving reform momentum, which is the key argument for our
upgrade on China, we suggest starting the year with a positive tilt to China because:
 Growth: Our economists project yoy GDP growth momentum to be strong in 1H14,
mainly on a favorable base effect, but the sequential trend could be weak due to
inventory destocking. Overall, this seems to provide a conducive environment for
equity returns in 1H as we note that the market tends to trade yoy growth rather
than sequential growth (Exhibit 75).
 Liquidity: Liquidity conditions tend to be more accommodative early in the year.
As last June’s interbank rate spike and ensuing market sell-off demonstrated,
China’s asset markets are sensitive to liquidity conditions, especially given the
increase in corporate leverage in recent years.
Exhibit 74: China’s yoy and sequential growth
momentum is likely to diverge in 1H14
Exhibit 75: Equity markets tend to trade yoy growth
more than sequential growth momentum
Period of analysis: Since 2007, monthly frequency. The calculation is done with
a 1-month lag to take into account the reporting lag of China econ data.
Source: DataStream, FactSet, Goldman Sachs Global Investment Research Source: DataStream, FactSet, Goldman Sachs Global Investment Research
Exhibit 76: Liquidity conditions have tended to be more
favorable in the early part of the year in China
Exhibit 77: Reform may bode well for the economy, but
the fundamental impact on the equity market is likely to
be mixed
Source: DataStream, FactSet, Goldman Sachs Global Investment Research Source: DataStream, FactSet, Goldman Sachs Global Investment Research
7.3
7.4
7.5
7.6
7.7
7.8
7.9
8
8.1
8.2
5.0
5.5
6.0
6.5
7.0
7.5
8.0
8.5
9.0
9.5
10.0
2012-1Q
2012-2Q
2012-3Q
2012-4Q
2013-1Q
2013-2Q
2013-3Q
2013E-4Q
2014E-1Q
2014E-2Q
2014E-3Q
2014E-4Q
China GDP (qoq. Ann.)
GDP (qoq. Ann.) GDP (yoy, RHS)
China GDP (%)
-10.0
-5.0
0.0
5.0
10.0
15.0
20.0
APJ
China
HK
India
Indonesia
Korea
Malaysia
Philippines
Singapore
Taiwan
Thailand
Australia
yoy +, seq +
yoy +, seq -
yoy -, seq +
yoy -, seq -
308.8
-129.0
403.1
98.6
-2.5
117.4
-269.7
-60.5
12.9
-307.1
-162.3
-36.5
-400
-300
-200
-100
0
100
200
300
400
500
Jan Feb Mar Apr May Jun Jul Aug Sep Oct Nov Dec
Average difference in NSA.TSF and SA.TSF since 2002 (RMBbn)
Better liquidity conditions in 1Q
17% 17%
13% 9%
16%
16%
25%
40%
28%
18%
0%
10%
20%
30%
40%
50%
60%
70%
80%
90%
100%
Market cap weighted 2013E earnings
weighted
Impact of Policy Reforms on MXCN Sectors (%)
Others
Negative (Banks)
Negative
Neutral
Positive
November 21, 2013 Asia Pacific
Goldman Sachs Global Investment Research 35
3) Abenomics: Limited impact on AEJ’s fundamentals, more manageable headwinds
to Korea this time around
 Abe’s first arrow set to be loosed again. Our economists expect the BoJ to step
up its monetary easing effort to offset the negative impacts of the consumption tax
hike in April and to boost inflation which is far short of its 2% target. They believe
the monetary policy easing is likely to be the most important driver for USD/JPY
(JPY to weaken), and continue to expect USDJPY to rise to 107 in 12 months.
 Muted fundamental impact on AEJ so far. At the macro level, the relationships
between Japan’s FCI and AEJ’s have been weak, suggesting limited
financial/liquidity spillover to the region from Abenomics so far (Exhibit 79).
In terms of real activity, Korean exports (nominal and relative to Japan’s exports),
which have been widely regarded as the major loser when JPY depreciates, have
posted record numbers in the latest October print, supporting our strong and long-
held view that Korean exports’ FX sensitivity is much lower than investors have
generally perceived.
 Potential headwinds to Korea in March/April, but more manageable than in
1H13. However, investors’ perception/concern remains entrenched: Korea
underperformed MXAPJ by 8pp in 1H13 when USDJPY and TPX rallied 16% and
28%. Looking ahead to the April BoJ meeting, we believe Korea will be less
impacted, mainly because:
a) the extent to which the JPY may depreciate should be much smaller than
when Abenomics was first announced; and,
b) investors should be less concerned about Korea’s deteriorating FX
competitiveness by then given the resilient export performance since
September 2012.
We would take any JPY-created market weakness as a buying opportunity to
position for global growth acceleration in the next two years.
Exhibit 78: Our economists expect the BoJ to announce further easing measures in April
Source: FactSet, Goldman Sachs Global Investment Research.
Jan 1 NISA initiation
Mid Jan. Ordinary Diet Session begins (FY2014 budget, FY2013 supplementary budget bills deliberation)
Late Jan. - Feb. Earnings results for 3Q13/14
Jan. 21-22 Jan. 21-22 BOJ Monetary Policy Meeting (Interim assessment on the BOJ outlook report)
Feb. 22-23 G20 Finance minister & central bank governors meeting (Sydney)
Feb-Mar Annual spring wage negotiation
End Mar FY2014 budget established
Apr 1 Consumption tax rate hike from 5% to 8%
Apr 30
BOJ Monetary Policy Meeting (Outlook Report) - Our Econ team expected that BOJ will
remain under pressure to provide additional easing to mitigate the impact of the tax hike. If
economic conditions deteriorate versus BOJ’s current scenario, our econ team believes BOJ
will make additional easing moves by purchasing ETFs and other risking assets.
May 20-21 BOJ Monetary Policy Meeting
Jun 4-5 G8 Summit Meeting (Russia)
Jun 12-13 BOJ Monetary Policy Meeting
During Jun Public works from the October 2013 economic package starts to kick in
Mid Nov 2014 Q3 GDP (Important for final devision of 2nd consumption tax rate hike, from Oct 2015)
Key Events in 2014
November 21, 2013 Asia Pacific
Goldman Sachs Global Investment Research 36
Exhibit 79: Japan’s financial conditions do not seem to
have significant spillover impact on AEJ
Exhibit 80: Korea’s exports do not seem severely
impacted by a weakening JPY
Source: DataStream, FactSet, Goldman Sachs Global Investment Research Source: DataStream, FactSet, Goldman Sachs Global Investment Research
Exhibit 81: Korea has traded more negatively than what
history would suggest when JPY depreciates
Exhibit 82: We expect JPY to weaken further, but the
magnitude should be moderate
Source: DataStream, FactSet, Goldman Sachs Global Investment Research Source: DataStream, FactSet, Goldman Sachs Global Investment Research
4) Elections in South Asia and Europe
While we do not take a view on the outcome of these elections, we believe they may be
market-moving events with fundamental implications in some cases, and investors should
monitor developments for better risk management and more effective tactical trading.
In this vein, we have compiled a detailed timetable of policies and events that may
have significant implications for Asia in the Appendix.
We believe these events include the parliamentary and presidential elections in India and
Indonesia, and a number of parliamentary elections in the peripheral European economies
which may have spillover effects to specific areas (e.g. Europe-exposed stocks) and even to
the global markets.
89
91
93
95
97
99
101
103
105
107
Jan-05
Jun-05
Nov-05
Apr-06
Sep-06
Feb-07
Jul-07
Dec-07
May-08
Oct-08
Mar-09
Aug-09
Jan-10
Jun-10
Nov-10
Apr-11
Sep-11
Feb-12
Jul-12
Dec-12
May-13
Oct-13
Financial Condition Index (Yr 2005 = 100)
Japan Korea Regional FCI
Financial tightening
Financial loosening
148
11.3
11.0
11.5
12.0
12.5
13.0
13.5
14.0
14.5
15.0
15.590
100
110
120
130
140
150
May-09
Aug-09
Nov-09
Feb-10
May-10
Aug-10
Nov-10
Feb-11
May-11
Aug-11
Nov-11
Feb-12
May-12
Aug-12
Nov-12
Feb-13
May-13
Aug-13
Rebased Index
Relative export Index (KR vs JP)
KRW/JPY (RHS)
JPY/KRW (Reverse)
18% 17% 17% 16% 15% 15% 14% 14% 13%
9%
4%
17%
21%
12%
17%
-15%
7%
-7%
23%
-16%
4%
6%
9%
1%
-20%
-15%
-10%
-5%
0%
5%
10%
15%
20%
25%
China
India
HongKong
Korea
Malaysia
Singapore
Philippines
Australia
Indonesia
Taiwan
Thailand
MXAPJ
Market Return Correlation with USDJPY
10 Year
Since Sep 2012
65
70
75
80
85
90
95
100
105
Jan-12
Jun-12
Nov-12
Apr-13
Sep-13
Feb-14
Jul-14
Dec-14
Rebased Currency Index
JPYUSD JPYKRW
20131121 goldman sachs-asia pacific portfolio strategy 2014 outlook

Más contenido relacionado

La actualidad más candente

Asia Economics Outlook 2018
Asia Economics Outlook 2018Asia Economics Outlook 2018
Asia Economics Outlook 2018Bloomberg LP
 
Investment Strategy: Midyear Update
Investment Strategy: Midyear UpdateInvestment Strategy: Midyear Update
Investment Strategy: Midyear UpdateSarah Cuddy
 
Asean-5’s Challenges May Persist Into 2018
Asean-5’s Challenges May Persist Into 2018Asean-5’s Challenges May Persist Into 2018
Asean-5’s Challenges May Persist Into 2018Bloomberg LP
 
2014_07_22 USE!!!Final_Portfolio_Project
2014_07_22 USE!!!Final_Portfolio_Project2014_07_22 USE!!!Final_Portfolio_Project
2014_07_22 USE!!!Final_Portfolio_ProjectCourtney Fenwick
 
Intralinks Deal Flow Predictor
Intralinks Deal Flow PredictorIntralinks Deal Flow Predictor
Intralinks Deal Flow PredictorMissMarvel70
 
Callan 2017-2026 Capital Market Projections
Callan 2017-2026 Capital Market ProjectionsCallan 2017-2026 Capital Market Projections
Callan 2017-2026 Capital Market ProjectionsCallan
 
Banking in Singapore and Malaysia
Banking in Singapore and MalaysiaBanking in Singapore and Malaysia
Banking in Singapore and MalaysiaHantec Markets
 
LBS - Asset Allocation Model – February Update
LBS - Asset Allocation Model – February UpdateLBS - Asset Allocation Model – February Update
LBS - Asset Allocation Model – February UpdateMark MacIsaac
 

La actualidad más candente (20)

Asia Economics Outlook 2018
Asia Economics Outlook 2018Asia Economics Outlook 2018
Asia Economics Outlook 2018
 
Investment Insights for December, 2017
Investment Insights for December, 2017Investment Insights for December, 2017
Investment Insights for December, 2017
 
Investment Strategy: Midyear Update
Investment Strategy: Midyear UpdateInvestment Strategy: Midyear Update
Investment Strategy: Midyear Update
 
Weekly market review - May 31, 2013
Weekly market review - May 31, 2013Weekly market review - May 31, 2013
Weekly market review - May 31, 2013
 
Asean-5’s Challenges May Persist Into 2018
Asean-5’s Challenges May Persist Into 2018Asean-5’s Challenges May Persist Into 2018
Asean-5’s Challenges May Persist Into 2018
 
Lsa 2016 market outlook
Lsa   2016 market outlookLsa   2016 market outlook
Lsa 2016 market outlook
 
Weekly Market Review - August 2, 2013
Weekly Market Review - August 2, 2013Weekly Market Review - August 2, 2013
Weekly Market Review - August 2, 2013
 
Adroit PMS Investment Strategy - April 2020 Update
Adroit PMS Investment Strategy - April 2020 UpdateAdroit PMS Investment Strategy - April 2020 Update
Adroit PMS Investment Strategy - April 2020 Update
 
Weekly Market Review - September 06, 2013
Weekly Market Review - September 06, 2013Weekly Market Review - September 06, 2013
Weekly Market Review - September 06, 2013
 
Weekly Market Review Apr 19, 2013
Weekly Market Review  Apr 19, 2013Weekly Market Review  Apr 19, 2013
Weekly Market Review Apr 19, 2013
 
Weekly Market Review - September 27, 2013
Weekly Market Review - September 27, 2013Weekly Market Review - September 27, 2013
Weekly Market Review - September 27, 2013
 
Hospitality Industry Overview
Hospitality Industry OverviewHospitality Industry Overview
Hospitality Industry Overview
 
2014_07_22 USE!!!Final_Portfolio_Project
2014_07_22 USE!!!Final_Portfolio_Project2014_07_22 USE!!!Final_Portfolio_Project
2014_07_22 USE!!!Final_Portfolio_Project
 
Intralinks Deal Flow Predictor
Intralinks Deal Flow PredictorIntralinks Deal Flow Predictor
Intralinks Deal Flow Predictor
 
Callan 2017-2026 Capital Market Projections
Callan 2017-2026 Capital Market ProjectionsCallan 2017-2026 Capital Market Projections
Callan 2017-2026 Capital Market Projections
 
Weekly Market Review - May 24, 2013
Weekly Market Review - May 24, 2013Weekly Market Review - May 24, 2013
Weekly Market Review - May 24, 2013
 
Banking in Singapore and Malaysia
Banking in Singapore and MalaysiaBanking in Singapore and Malaysia
Banking in Singapore and Malaysia
 
2016 Outlook
2016 Outlook2016 Outlook
2016 Outlook
 
LBS - Asset Allocation Model – February Update
LBS - Asset Allocation Model – February UpdateLBS - Asset Allocation Model – February Update
LBS - Asset Allocation Model – February Update
 
Weekly Market Review, May 17, 2013
Weekly Market Review, May 17, 2013Weekly Market Review, May 17, 2013
Weekly Market Review, May 17, 2013
 

Destacado

Brochure & Order Form_India B2C E-Commerce Report 2011
Brochure & Order Form_India B2C E-Commerce Report 2011Brochure & Order Form_India B2C E-Commerce Report 2011
Brochure & Order Form_India B2C E-Commerce Report 2011yStats.com
 
Edi la contaminacion[1]
Edi la contaminacion[1]Edi la contaminacion[1]
Edi la contaminacion[1]ecogirls
 
Palmity en20131012 edited v5
Palmity en20131012  edited v5Palmity en20131012  edited v5
Palmity en20131012 edited v5ttran321
 
Force proyecto (1) 5 bloque
Force proyecto (1) 5 bloqueForce proyecto (1) 5 bloque
Force proyecto (1) 5 bloquepanteracarol
 
E J (Ted) Shaw CV
E J (Ted) Shaw CVE J (Ted) Shaw CV
E J (Ted) Shaw CVTed Shaw
 
Las minas del rey salomón
Las minas del rey salomónLas minas del rey salomón
Las minas del rey salomónalvaromerima
 
Diretriz antiagregantes plaquetarios 2013
Diretriz antiagregantes plaquetarios 2013Diretriz antiagregantes plaquetarios 2013
Diretriz antiagregantes plaquetarios 2013Arquivo-FClinico
 
The Evolving Internet: A look ahead to 2025
The Evolving Internet: A look ahead to 2025The Evolving Internet: A look ahead to 2025
The Evolving Internet: A look ahead to 2025Ufuk Kılıç
 
Edición electrónica y los nuevos formatos de autoría y lectura
 Edición electrónica y los nuevos formatos de autoría y lectura Edición electrónica y los nuevos formatos de autoría y lectura
Edición electrónica y los nuevos formatos de autoría y lecturaSocialBiblio
 
El éxodo rural y las barriadas urbanas de aluvión
El éxodo rural y las barriadas urbanas de aluviónEl éxodo rural y las barriadas urbanas de aluvión
El éxodo rural y las barriadas urbanas de aluvióniesfraypedro
 
Reaccion catalitica
Reaccion cataliticaReaccion catalitica
Reaccion cataliticalynetsita
 
Beacon, proximity marketing e user experience
Beacon, proximity marketing e user experienceBeacon, proximity marketing e user experience
Beacon, proximity marketing e user experienceLuca Rosati
 

Destacado (20)

Brochure & Order Form_India B2C E-Commerce Report 2011
Brochure & Order Form_India B2C E-Commerce Report 2011Brochure & Order Form_India B2C E-Commerce Report 2011
Brochure & Order Form_India B2C E-Commerce Report 2011
 
Edi la contaminacion[1]
Edi la contaminacion[1]Edi la contaminacion[1]
Edi la contaminacion[1]
 
Palmity en20131012 edited v5
Palmity en20131012  edited v5Palmity en20131012  edited v5
Palmity en20131012 edited v5
 
Force proyecto (1) 5 bloque
Force proyecto (1) 5 bloqueForce proyecto (1) 5 bloque
Force proyecto (1) 5 bloque
 
E J (Ted) Shaw CV
E J (Ted) Shaw CVE J (Ted) Shaw CV
E J (Ted) Shaw CV
 
Las propuestas regionales y sectoriales de Agenda Interna
Las propuestas regionales y sectoriales de Agenda InternaLas propuestas regionales y sectoriales de Agenda Interna
Las propuestas regionales y sectoriales de Agenda Interna
 
Las minas del rey salomón
Las minas del rey salomónLas minas del rey salomón
Las minas del rey salomón
 
Diretriz antiagregantes plaquetarios 2013
Diretriz antiagregantes plaquetarios 2013Diretriz antiagregantes plaquetarios 2013
Diretriz antiagregantes plaquetarios 2013
 
The Evolving Internet: A look ahead to 2025
The Evolving Internet: A look ahead to 2025The Evolving Internet: A look ahead to 2025
The Evolving Internet: A look ahead to 2025
 
Edición electrónica y los nuevos formatos de autoría y lectura
 Edición electrónica y los nuevos formatos de autoría y lectura Edición electrónica y los nuevos formatos de autoría y lectura
Edición electrónica y los nuevos formatos de autoría y lectura
 
Advanced API Security
Advanced API SecurityAdvanced API Security
Advanced API Security
 
Cocina 2
Cocina 2Cocina 2
Cocina 2
 
Manual comuneros 2015 (2)
Manual comuneros 2015 (2)Manual comuneros 2015 (2)
Manual comuneros 2015 (2)
 
El éxodo rural y las barriadas urbanas de aluvión
El éxodo rural y las barriadas urbanas de aluviónEl éxodo rural y las barriadas urbanas de aluvión
El éxodo rural y las barriadas urbanas de aluvión
 
Reaccion catalitica
Reaccion cataliticaReaccion catalitica
Reaccion catalitica
 
Beacon, proximity marketing e user experience
Beacon, proximity marketing e user experienceBeacon, proximity marketing e user experience
Beacon, proximity marketing e user experience
 
Afl Scm Project
Afl Scm ProjectAfl Scm Project
Afl Scm Project
 
Normas abnt prof_edson
Normas abnt prof_edsonNormas abnt prof_edson
Normas abnt prof_edson
 
ModularIT at FOSDEM
ModularIT at FOSDEMModularIT at FOSDEM
ModularIT at FOSDEM
 
Chap10 Media Planning And Strategy
Chap10 Media Planning And StrategyChap10 Media Planning And Strategy
Chap10 Media Planning And Strategy
 

Similar a 20131121 goldman sachs-asia pacific portfolio strategy 2014 outlook

EY Global Capital Confidence Barometer (12th Edition)
EY Global Capital Confidence Barometer (12th Edition)EY Global Capital Confidence Barometer (12th Edition)
EY Global Capital Confidence Barometer (12th Edition)EY
 
201405 EY Capital-Confidence-Barometer-april-2014
201405 EY Capital-Confidence-Barometer-april-2014201405 EY Capital-Confidence-Barometer-april-2014
201405 EY Capital-Confidence-Barometer-april-2014Francisco Calzado
 
Right Horizons market outlook for 2016 - stay invested
Right Horizons market outlook for 2016 - stay investedRight Horizons market outlook for 2016 - stay invested
Right Horizons market outlook for 2016 - stay investedRight Horizons
 
Global Capital Confidence Barometer 21st edition
Global Capital Confidence Barometer 21st editionGlobal Capital Confidence Barometer 21st edition
Global Capital Confidence Barometer 21st editionEY
 
Indonesia strategy 2018 - many risks,few rewards
Indonesia strategy 2018 - many risks,few rewardsIndonesia strategy 2018 - many risks,few rewards
Indonesia strategy 2018 - many risks,few rewardsBambang Muliyadi
 
ATRADIUS Payment-Practices-Barometer-ASIA PACIFIC Ene17
ATRADIUS Payment-Practices-Barometer-ASIA PACIFIC Ene17ATRADIUS Payment-Practices-Barometer-ASIA PACIFIC Ene17
ATRADIUS Payment-Practices-Barometer-ASIA PACIFIC Ene17Jaime Cubillo Fleming
 
How to compete in tumultuous times and operate in complexity
How to compete in tumultuous times and operate in complexityHow to compete in tumultuous times and operate in complexity
How to compete in tumultuous times and operate in complexityDavid Graham
 
Idea annual report_2012-13
Idea annual report_2012-13Idea annual report_2012-13
Idea annual report_2012-13mayank jain
 
Advice For The Wise - February, 2016
Advice For The Wise - February, 2016Advice For The Wise - February, 2016
Advice For The Wise - February, 2016Karvy Private Wealth
 
_ C@p_T3st
_ C@p_T3st_ C@p_T3st
_ C@p_T3stflipdemo
 
Microclimates of opportunity - Real estate & construction report 2014
Microclimates of opportunity - Real estate & construction report 2014Microclimates of opportunity - Real estate & construction report 2014
Microclimates of opportunity - Real estate & construction report 2014Misbah Hussain
 
The World This Week November 7 - November 11 - 2016
The World This Week November 7 - November 11 - 2016The World This Week November 7 - November 11 - 2016
The World This Week November 7 - November 11 - 2016Karvy Private Wealth
 
Fame Value Security Analysis Competition- EDU
Fame Value Security Analysis Competition- EDUFame Value Security Analysis Competition- EDU
Fame Value Security Analysis Competition- EDULeon Liang
 
Global Capital Confidence Barometer | How can you reshape your future before ...
Global Capital Confidence Barometer | How can you reshape your future before ...Global Capital Confidence Barometer | How can you reshape your future before ...
Global Capital Confidence Barometer | How can you reshape your future before ...EY
 

Similar a 20131121 goldman sachs-asia pacific portfolio strategy 2014 outlook (20)

EY Global Capital Confidence Barometer (12th Edition)
EY Global Capital Confidence Barometer (12th Edition)EY Global Capital Confidence Barometer (12th Edition)
EY Global Capital Confidence Barometer (12th Edition)
 
201405 EY Capital-Confidence-Barometer-april-2014
201405 EY Capital-Confidence-Barometer-april-2014201405 EY Capital-Confidence-Barometer-april-2014
201405 EY Capital-Confidence-Barometer-april-2014
 
Top trends 15 r
Top trends 15 rTop trends 15 r
Top trends 15 r
 
Bank of America Merrill Lynch CFO Outlook 2014 Asia
Bank of America Merrill Lynch CFO Outlook 2014 AsiaBank of America Merrill Lynch CFO Outlook 2014 Asia
Bank of America Merrill Lynch CFO Outlook 2014 Asia
 
2014 Global Macro Outlook - Nov 2013
2014 Global Macro Outlook - Nov 20132014 Global Macro Outlook - Nov 2013
2014 Global Macro Outlook - Nov 2013
 
Right Horizons market outlook for 2016 - stay invested
Right Horizons market outlook for 2016 - stay investedRight Horizons market outlook for 2016 - stay invested
Right Horizons market outlook for 2016 - stay invested
 
Global Capital Confidence Barometer 21st edition
Global Capital Confidence Barometer 21st editionGlobal Capital Confidence Barometer 21st edition
Global Capital Confidence Barometer 21st edition
 
Indonesia strategy 2018 - many risks,few rewards
Indonesia strategy 2018 - many risks,few rewardsIndonesia strategy 2018 - many risks,few rewards
Indonesia strategy 2018 - many risks,few rewards
 
ATRADIUS Payment-Practices-Barometer-ASIA PACIFIC Ene17
ATRADIUS Payment-Practices-Barometer-ASIA PACIFIC Ene17ATRADIUS Payment-Practices-Barometer-ASIA PACIFIC Ene17
ATRADIUS Payment-Practices-Barometer-ASIA PACIFIC Ene17
 
CRA Industry Primer
CRA Industry PrimerCRA Industry Primer
CRA Industry Primer
 
How to compete in tumultuous times and operate in complexity
How to compete in tumultuous times and operate in complexityHow to compete in tumultuous times and operate in complexity
How to compete in tumultuous times and operate in complexity
 
Idea annual report_2012-13
Idea annual report_2012-13Idea annual report_2012-13
Idea annual report_2012-13
 
Deloitte_SEA_CFO_Survey_201412
Deloitte_SEA_CFO_Survey_201412Deloitte_SEA_CFO_Survey_201412
Deloitte_SEA_CFO_Survey_201412
 
Advice For The Wise - February, 2016
Advice For The Wise - February, 2016Advice For The Wise - February, 2016
Advice For The Wise - February, 2016
 
April 2020
April 2020April 2020
April 2020
 
_ C@p_T3st
_ C@p_T3st_ C@p_T3st
_ C@p_T3st
 
Microclimates of opportunity - Real estate & construction report 2014
Microclimates of opportunity - Real estate & construction report 2014Microclimates of opportunity - Real estate & construction report 2014
Microclimates of opportunity - Real estate & construction report 2014
 
The World This Week November 7 - November 11 - 2016
The World This Week November 7 - November 11 - 2016The World This Week November 7 - November 11 - 2016
The World This Week November 7 - November 11 - 2016
 
Fame Value Security Analysis Competition- EDU
Fame Value Security Analysis Competition- EDUFame Value Security Analysis Competition- EDU
Fame Value Security Analysis Competition- EDU
 
Global Capital Confidence Barometer | How can you reshape your future before ...
Global Capital Confidence Barometer | How can you reshape your future before ...Global Capital Confidence Barometer | How can you reshape your future before ...
Global Capital Confidence Barometer | How can you reshape your future before ...
 

Último

Keppel Ltd. 1Q 2024 Business Update Presentation Slides
Keppel Ltd. 1Q 2024 Business Update  Presentation SlidesKeppel Ltd. 1Q 2024 Business Update  Presentation Slides
Keppel Ltd. 1Q 2024 Business Update Presentation SlidesKeppelCorporation
 
8447779800, Low rate Call girls in Kotla Mubarakpur Delhi NCR
8447779800, Low rate Call girls in Kotla Mubarakpur Delhi NCR8447779800, Low rate Call girls in Kotla Mubarakpur Delhi NCR
8447779800, Low rate Call girls in Kotla Mubarakpur Delhi NCRashishs7044
 
Case study on tata clothing brand zudio in detail
Case study on tata clothing brand zudio in detailCase study on tata clothing brand zudio in detail
Case study on tata clothing brand zudio in detailAriel592675
 
The CMO Survey - Highlights and Insights Report - Spring 2024
The CMO Survey - Highlights and Insights Report - Spring 2024The CMO Survey - Highlights and Insights Report - Spring 2024
The CMO Survey - Highlights and Insights Report - Spring 2024christinemoorman
 
8447779800, Low rate Call girls in Uttam Nagar Delhi NCR
8447779800, Low rate Call girls in Uttam Nagar Delhi NCR8447779800, Low rate Call girls in Uttam Nagar Delhi NCR
8447779800, Low rate Call girls in Uttam Nagar Delhi NCRashishs7044
 
Pitch Deck Teardown: Geodesic.Life's $500k Pre-seed deck
Pitch Deck Teardown: Geodesic.Life's $500k Pre-seed deckPitch Deck Teardown: Geodesic.Life's $500k Pre-seed deck
Pitch Deck Teardown: Geodesic.Life's $500k Pre-seed deckHajeJanKamps
 
Buy gmail accounts.pdf Buy Old Gmail Accounts
Buy gmail accounts.pdf Buy Old Gmail AccountsBuy gmail accounts.pdf Buy Old Gmail Accounts
Buy gmail accounts.pdf Buy Old Gmail AccountsBuy Verified Accounts
 
Call Girls Miyapur 7001305949 all area service COD available Any Time
Call Girls Miyapur 7001305949 all area service COD available Any TimeCall Girls Miyapur 7001305949 all area service COD available Any Time
Call Girls Miyapur 7001305949 all area service COD available Any Timedelhimodelshub1
 
Digital Transformation in the PLM domain - distrib.pdf
Digital Transformation in the PLM domain - distrib.pdfDigital Transformation in the PLM domain - distrib.pdf
Digital Transformation in the PLM domain - distrib.pdfJos Voskuil
 
8447779800, Low rate Call girls in Saket Delhi NCR
8447779800, Low rate Call girls in Saket Delhi NCR8447779800, Low rate Call girls in Saket Delhi NCR
8447779800, Low rate Call girls in Saket Delhi NCRashishs7044
 
Call US-88OO1O2216 Call Girls In Mahipalpur Female Escort Service
Call US-88OO1O2216 Call Girls In Mahipalpur Female Escort ServiceCall US-88OO1O2216 Call Girls In Mahipalpur Female Escort Service
Call US-88OO1O2216 Call Girls In Mahipalpur Female Escort Servicecallgirls2057
 
8447779800, Low rate Call girls in Shivaji Enclave Delhi NCR
8447779800, Low rate Call girls in Shivaji Enclave Delhi NCR8447779800, Low rate Call girls in Shivaji Enclave Delhi NCR
8447779800, Low rate Call girls in Shivaji Enclave Delhi NCRashishs7044
 
Call Girls In Radisson Blu Hotel New Delhi Paschim Vihar ❤️8860477959 Escorts...
Call Girls In Radisson Blu Hotel New Delhi Paschim Vihar ❤️8860477959 Escorts...Call Girls In Radisson Blu Hotel New Delhi Paschim Vihar ❤️8860477959 Escorts...
Call Girls In Radisson Blu Hotel New Delhi Paschim Vihar ❤️8860477959 Escorts...lizamodels9
 
Kenya Coconut Production Presentation by Dr. Lalith Perera
Kenya Coconut Production Presentation by Dr. Lalith PereraKenya Coconut Production Presentation by Dr. Lalith Perera
Kenya Coconut Production Presentation by Dr. Lalith Pereraictsugar
 
2024 Numerator Consumer Study of Cannabis Usage
2024 Numerator Consumer Study of Cannabis Usage2024 Numerator Consumer Study of Cannabis Usage
2024 Numerator Consumer Study of Cannabis UsageNeil Kimberley
 
APRIL2024_UKRAINE_xml_0000000000000 .pdf
APRIL2024_UKRAINE_xml_0000000000000 .pdfAPRIL2024_UKRAINE_xml_0000000000000 .pdf
APRIL2024_UKRAINE_xml_0000000000000 .pdfRbc Rbcua
 
Contemporary Economic Issues Facing the Filipino Entrepreneur (1).pptx
Contemporary Economic Issues Facing the Filipino Entrepreneur (1).pptxContemporary Economic Issues Facing the Filipino Entrepreneur (1).pptx
Contemporary Economic Issues Facing the Filipino Entrepreneur (1).pptxMarkAnthonyAurellano
 
Islamabad Escorts | Call 03070433345 | Escort Service in Islamabad
Islamabad Escorts | Call 03070433345 | Escort Service in IslamabadIslamabad Escorts | Call 03070433345 | Escort Service in Islamabad
Islamabad Escorts | Call 03070433345 | Escort Service in IslamabadAyesha Khan
 
/:Call Girls In Indirapuram Ghaziabad ➥9990211544 Independent Best Escorts In...
/:Call Girls In Indirapuram Ghaziabad ➥9990211544 Independent Best Escorts In.../:Call Girls In Indirapuram Ghaziabad ➥9990211544 Independent Best Escorts In...
/:Call Girls In Indirapuram Ghaziabad ➥9990211544 Independent Best Escorts In...lizamodels9
 
Innovation Conference 5th March 2024.pdf
Innovation Conference 5th March 2024.pdfInnovation Conference 5th March 2024.pdf
Innovation Conference 5th March 2024.pdfrichard876048
 

Último (20)

Keppel Ltd. 1Q 2024 Business Update Presentation Slides
Keppel Ltd. 1Q 2024 Business Update  Presentation SlidesKeppel Ltd. 1Q 2024 Business Update  Presentation Slides
Keppel Ltd. 1Q 2024 Business Update Presentation Slides
 
8447779800, Low rate Call girls in Kotla Mubarakpur Delhi NCR
8447779800, Low rate Call girls in Kotla Mubarakpur Delhi NCR8447779800, Low rate Call girls in Kotla Mubarakpur Delhi NCR
8447779800, Low rate Call girls in Kotla Mubarakpur Delhi NCR
 
Case study on tata clothing brand zudio in detail
Case study on tata clothing brand zudio in detailCase study on tata clothing brand zudio in detail
Case study on tata clothing brand zudio in detail
 
The CMO Survey - Highlights and Insights Report - Spring 2024
The CMO Survey - Highlights and Insights Report - Spring 2024The CMO Survey - Highlights and Insights Report - Spring 2024
The CMO Survey - Highlights and Insights Report - Spring 2024
 
8447779800, Low rate Call girls in Uttam Nagar Delhi NCR
8447779800, Low rate Call girls in Uttam Nagar Delhi NCR8447779800, Low rate Call girls in Uttam Nagar Delhi NCR
8447779800, Low rate Call girls in Uttam Nagar Delhi NCR
 
Pitch Deck Teardown: Geodesic.Life's $500k Pre-seed deck
Pitch Deck Teardown: Geodesic.Life's $500k Pre-seed deckPitch Deck Teardown: Geodesic.Life's $500k Pre-seed deck
Pitch Deck Teardown: Geodesic.Life's $500k Pre-seed deck
 
Buy gmail accounts.pdf Buy Old Gmail Accounts
Buy gmail accounts.pdf Buy Old Gmail AccountsBuy gmail accounts.pdf Buy Old Gmail Accounts
Buy gmail accounts.pdf Buy Old Gmail Accounts
 
Call Girls Miyapur 7001305949 all area service COD available Any Time
Call Girls Miyapur 7001305949 all area service COD available Any TimeCall Girls Miyapur 7001305949 all area service COD available Any Time
Call Girls Miyapur 7001305949 all area service COD available Any Time
 
Digital Transformation in the PLM domain - distrib.pdf
Digital Transformation in the PLM domain - distrib.pdfDigital Transformation in the PLM domain - distrib.pdf
Digital Transformation in the PLM domain - distrib.pdf
 
8447779800, Low rate Call girls in Saket Delhi NCR
8447779800, Low rate Call girls in Saket Delhi NCR8447779800, Low rate Call girls in Saket Delhi NCR
8447779800, Low rate Call girls in Saket Delhi NCR
 
Call US-88OO1O2216 Call Girls In Mahipalpur Female Escort Service
Call US-88OO1O2216 Call Girls In Mahipalpur Female Escort ServiceCall US-88OO1O2216 Call Girls In Mahipalpur Female Escort Service
Call US-88OO1O2216 Call Girls In Mahipalpur Female Escort Service
 
8447779800, Low rate Call girls in Shivaji Enclave Delhi NCR
8447779800, Low rate Call girls in Shivaji Enclave Delhi NCR8447779800, Low rate Call girls in Shivaji Enclave Delhi NCR
8447779800, Low rate Call girls in Shivaji Enclave Delhi NCR
 
Call Girls In Radisson Blu Hotel New Delhi Paschim Vihar ❤️8860477959 Escorts...
Call Girls In Radisson Blu Hotel New Delhi Paschim Vihar ❤️8860477959 Escorts...Call Girls In Radisson Blu Hotel New Delhi Paschim Vihar ❤️8860477959 Escorts...
Call Girls In Radisson Blu Hotel New Delhi Paschim Vihar ❤️8860477959 Escorts...
 
Kenya Coconut Production Presentation by Dr. Lalith Perera
Kenya Coconut Production Presentation by Dr. Lalith PereraKenya Coconut Production Presentation by Dr. Lalith Perera
Kenya Coconut Production Presentation by Dr. Lalith Perera
 
2024 Numerator Consumer Study of Cannabis Usage
2024 Numerator Consumer Study of Cannabis Usage2024 Numerator Consumer Study of Cannabis Usage
2024 Numerator Consumer Study of Cannabis Usage
 
APRIL2024_UKRAINE_xml_0000000000000 .pdf
APRIL2024_UKRAINE_xml_0000000000000 .pdfAPRIL2024_UKRAINE_xml_0000000000000 .pdf
APRIL2024_UKRAINE_xml_0000000000000 .pdf
 
Contemporary Economic Issues Facing the Filipino Entrepreneur (1).pptx
Contemporary Economic Issues Facing the Filipino Entrepreneur (1).pptxContemporary Economic Issues Facing the Filipino Entrepreneur (1).pptx
Contemporary Economic Issues Facing the Filipino Entrepreneur (1).pptx
 
Islamabad Escorts | Call 03070433345 | Escort Service in Islamabad
Islamabad Escorts | Call 03070433345 | Escort Service in IslamabadIslamabad Escorts | Call 03070433345 | Escort Service in Islamabad
Islamabad Escorts | Call 03070433345 | Escort Service in Islamabad
 
/:Call Girls In Indirapuram Ghaziabad ➥9990211544 Independent Best Escorts In...
/:Call Girls In Indirapuram Ghaziabad ➥9990211544 Independent Best Escorts In.../:Call Girls In Indirapuram Ghaziabad ➥9990211544 Independent Best Escorts In...
/:Call Girls In Indirapuram Ghaziabad ➥9990211544 Independent Best Escorts In...
 
Innovation Conference 5th March 2024.pdf
Innovation Conference 5th March 2024.pdfInnovation Conference 5th March 2024.pdf
Innovation Conference 5th March 2024.pdf
 

20131121 goldman sachs-asia pacific portfolio strategy 2014 outlook

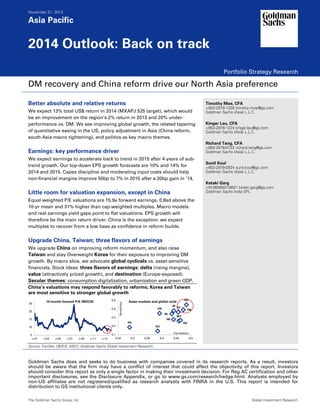
  • 1. November 21, 2013 Asia Pacific 2014 Outlook: Back on track Portfolio Strategy Research DM recovery and China reform drive our North Asia preference Better absolute and relative returns We expect 13% total US$ return in 2014 (MXAPJ 525 target), which would be an improvement on the region’s 2% return in 2013 and 20% under- performance vs. DM. We see improving global growth, the related tapering of quantitative easing in the US, policy adjustment in Asia (China reform, south Asia macro tightening), and politics as key macro themes. Earnings: key performance driver We expect earnings to accelerate back to trend in 2015 after 4 years of sub- trend growth. Our top-down EPS growth forecasts are 10% and 14% for 2014 and 2015. Capex discipline and moderating input costs should help non-financial margins improve 50bp to 7% in 2015 after a 20bp gain in ’14. Little room for valuation expansion, except in China Equal-weighted P/E valuations are 15.9x forward earnings, 0.8sd above the 10-yr mean and 31% higher than cap-weighted multiples. Macro models and real earnings yield gaps point to flat valuations. EPS growth will therefore be the main return driver. China is the exception: we expect multiples to recover from a low base as confidence in reform builds. Upgrade China, Taiwan; three flavors of earnings We upgrade China on improving reform momentum, and also raise Taiwan and stay Overweight Korea for their exposure to improving DM growth. By macro slice, we advocate global cyclicals vs. asset-sensitive financials. Stock ideas: three flavors of earnings: delta (rising margins), value (attractively priced growth), and destination (Europe-exposed). Secular themes: consumption digitalization, urbanization and green GDP. China’s valuations may respond favorably to reforms; Korea and Taiwan are most sensitive to stronger global growth Source: FactSet, I/B/E/S, MSCI, Goldman Sachs Global Investment Research. Timothy Moe, CFA +852-2978-1328 timothy.moe@gs.com Goldman Sachs (Asia) L.L.C. Kinger Lau, CFA +852-2978-1224 kinger.lau@gs.com Goldman Sachs (Asia) L.L.C. Richard Tang, CFA +852-2978-0722 richard.tang@gs.com Goldman Sachs (Asia) L.L.C. Sunil Koul +852-2978-0924 sunil.koul@gs.com Goldman Sachs (Asia) L.L.C. Ketaki Garg +91(80)6637-8601 ketaki.garg@gs.com Goldman Sachs India SPL Goldman Sachs does and seeks to do business with companies covered in its research reports. As a result, investors should be aware that the firm may have a conflict of interest that could affect the objectivity of this report. Investors should consider this report as only a single factor in making their investment decision. For Reg AC certification and other important disclosures, see the Disclosure Appendix, or go to www.gs.com/research/hedge.html. Analysts employed by non-US affiliates are not registered/qualified as research analysts with FINRA in the U.S. This report is intended for distribution to GS institutional clients only. The Goldman Sachs Group, Inc. Global Investment Research AU CN HK IN ID KR MY PH SG TW TH 0.1 0.2 0.3 0.4 0.5 0.25 0.3 0.35 0.4 0.45 0.5 Sensitivity Correlation Asian markets and global cycle 5 10 15 20 25 J-01 J-03 J-05 J-07 J-09 J-11 J-13 12-month forward P/E (MXCN)
  • 2. November 21, 2013 Asia Pacific Goldman Sachs Global Investment Research 2 Table of contents Executive summary: Back on track 3 Market view changes: Upgrade China and Taiwan to Overweight 8 Implementation: Emphasizing earnings 14 Key questions for 2014 21 Performance context: Intra-regional differentiation at play 26 Macro: Return expectations, views, and path 29 Earnings: Back to trend growth in 2015 after 4 years of weakness 37 Valuations: Not much room for expansion except for China 43 Positioning: Potential for continuing shift to North Asia 46 Secular themes: Buy on dips 49 Events in 2014 and beyond 55 Appendix 1: Goldman Sachs macro forecasts 56 Appendix 2: Valuations at a glance 57 Appendix 3: China reform policies 58 Disclosure Appendix 62 The authors would like to thank Vincent Lau and Nitin Chanduka for their valuable contributions. All prices in this report are as of November 18, unless mentioned otherwise.
  • 3. November 21, 2013 Asia Pacific Goldman Sachs Global Investment Research 3 Executive summary: Back on track After a year of flat returns and dramatic underperformance vs. DM, we expect 2014 to be a better year in absolute and relative terms. We believe earnings growth will be the main performance driver since aggregate valuations are full. We favor China on improving reform momentum, Korea and Taiwan for their exposure to better DM growth, and three flavors of earnings growth (delta, value, and revenue-source).  Regional return. We expect the MXAPJ index to reach 525 by end-2014, implying 10% price and 13% total returns in USD. Earnings growth will be the key propellant, but 3% weighted-average exchange rate depreciation and some valuation compression may serve to offset some of the earnings gains. Within the region, we upgrade China and Taiwan to Overweight and stay positive on Korea. Total US$ returns for these markets could be 15% to 23%.  Expected path. Our 3m and 6m targets are 485 and 490, implying a modest start to the year and a stronger 2H. Key influences are likely to be the timing and magnitude of Fed tapering, the reaction to China’s reform policies, the political calendar in markets like India and Indonesia, and whether corporate Asia is able to deliver earnings. Policy decisions will be sensitive to high-frequency macro indicators, which means markets will be data dependent and the price path noisy.  Key themes. The main macro themes we see are the improvement in global growth to 3.6% from 2.8% (PPP terms) driven by the US, and the related tapering of quantitative easing as US monetary policy begins to normalize. Within the region, policy adjustment (China reform, south Asia macro tightening) and politics will also impact markets. The key micro theme is the potential earnings growth recovery in 2015 (which the market will anticipate in 2H14), driven in good measure by supply side factors such as capex discipline and cost management.  Performance context. Regional equities are roughly flat for 2013 with wide amplitude of intra-year swings. Performance is at the 36th percentile in absolute terms relative to the MXAPJ’s 26-year history and the 20th percentile relative to DM equities over the same time frame. Market rotation was greater than sector rotation, and FX weakness reduced USD returns by 5%. Looking forward, we expect currency to be an important component of returns (albeit less negative), and expect meaningful market, theme and stock performance differentiation.  Earnings: key return driver. We expect earnings growth to accelerate back to trend in 2015 after 4 years of sub-trend growth. Our top-down regional earnings growth forecasts are 10% and 14% for 2014 and 2015 (EPS integers are $38.40 and $43.70). These are 2% below and 4% above the respective consensus expectations. Demand-side models have overestimated earnings recently, because the shortfall has come from margins rather than revenues. Regional capacity utilization currently stands at 67.3%, a full 10pp below the 77.6% level in the US, and this excess capacity has depressed profitability. Capex discipline and moderating input cost pressures should result in non-financial margins improving 50bp to 7% in 2015 after a 20bp uptick in 2014.  Valuation: Not much room for expansion. The region currently trades at 12.1x forward 12m earnings and 1.6x trailing book value, about 0.7sd below the 10-yr mean. However, cap-weighted valuations are distorted downwards by China SOEs and Korea electronics stocks. Equal-weighted valuations are 31% higher at 15.9x forward earnings, which is 0.8 sd above average and from which point historical returns have been subdued. Macro models point to flat valuations relative to our forecasts, and real earnings yield gaps also look fair relative to range. In sum, we expect little valuation change in 2014: EPS growth will be the main return driver.
  • 4. November 21, 2013 Asia Pacific Goldman Sachs Global Investment Research 4  Positioning: Potential for continuing shift to N Asia. Regional equity flows recovered after the mid-year selloff, with $28bn ytd inflows overall. India continues to attract the highest flows ($17bn) with Korea and Taiwan next at $14bn combined, and Thailand and Indonesia seeing net selling. Active positioning remains biased towards south Asia, with mutual funds overweight India and ASEAN by 495 and 948bp and underweight China, Korea and Taiwan by 582, 769 and 649bp. Given better macro characteristics relative to our global forecasts, we see scope for added flows to N Asia and for flows from bonds to equities.  Risks: The principal macro threats to our more constructive stance are a) global growth falling short of our expected improvement, b) more aggressive Fed policy tightening, c) China faltering on reform implementation, d) politically-driven volatility, e) an oil shock (we expect a benign price path), and f) contagion from other EMs. The main micro risk is continuing earnings shortfall if Asian companies are not able to deliver the margin recovery we expect.  Secular themes. Focal areas include: o Digitalization of consumption: Smartphone demand, internet commercialization, disruptive technologies like array cameras, and big data and cloud computing. o Urbanization: Includes infrastructure and healthcare. o Green GDP: Environmental protection is emerging as a key China theme, and includes alternative energy such as solar, gas, wind and hydro.  Key questions. o Asia vs DM relative performance. Our forecasts for the key global regions imply more equivalent returns in 2014 as opposed to the lopsided performance in 2013. The region’s relative performance may improve later in 2014 if earnings show signs of a pickup as we expect. o ASEAN. We expect ASEAN to continue to lag the broader region after outperforming from 2006 to 2012. 2H14 may be a better time to revisit once the current cyclical macro adjustment is more mature. o China internet and Macau gaming. These were the strong performers of 2013 and helped many investors perform. We advocate buying corrections because the fundamental theme is powerful and not yet mature. o China banks. The top 10 country-sectors in the MXAPJ index account for 42% of market cap, meaning decisions in this area will have outsized impact on relative performance. China banks are the fourth largest country sector (after Australia banks and Taiwan and Korea tech). Risk is to the upside near-term given reform momentum. o Tech. Tech is the 2nd largest sector regionally, accounting for 15% of market cap. We are overweight and expect ‘old tech’ to perform well, along with ‘new tech’.  Markets: Raise China and Taiwan, continue to favor Korea o Overweight China: Upgrade: policy reform could raise valuation off low base Korea: Attractive macro profile, mid-teens EPS growth, inexpensive Taiwan: Upgrade: favorable macro exposure enhanced by high yield
  • 5. November 21, 2013 Asia Pacific Goldman Sachs Global Investment Research 5 o Market weight India: Reduced external vulnerability, earnings holding up Malaysia: Upgrade given moderating external risk and low vol; full vals Philippines: Strongest ASEAN-4 fundamentals; valuations still high Singapore: Downgrade: better alternatives in N Asia o Underweight Australia: Weak domestic fundamentals, significant AUD downside risk Hong Kong: Challenges from QE exit; high valuation relative to China Indonesia: Tighter policy to impact n/t growth; outlook better later in 2014 Thailand: Downgrade on macro/policy risks; earnings/valuations fair  Sectors: selected cyclicals o Overweight: Autos, tech hardware & semis, banks, software, transport o Market weight: Energy, health care, capital goods, insurance, metals/mining, chemicals, retail o Underweight: Real estate, utilities, staples, telecom  Implementation: Emphasizing earnings o Markets: long Korea; HSCEI 3-month call spreads, China reform- beneficiary basket o Macro slices: global cyclicals vs. asset-sensitive financials (GSSZMSGC vs. GSSZMSFA) o Three flavors of earnings: Delta earnings (margin expansion); Value earnings (attractively priced growth); Destination earnings (Europe- exposed stocks) o Secular themes: Plays on consumption digitalization, urbanization, green GDP o Derivatives: Preferred downside hedge is ASX 200 Mar-end puts.
  • 6. November 21, 2013 Asia Pacific Goldman Sachs Global Investment Research 6 Exhibit 1: We expect more balanced returns between regions in 2014 Note: TOPIX EPS is based on fiscal, not calendar years. Source: Goldman Sachs Global Investment Research. Exhibit 2: We prefer North Asia Source: Goldman Sachs Global Investment Research. Exhibit 3: Market scorecard Note: Blue cells refer to favorable metrics, whilst grey cells refer to unfavorable ones. For GDP, blue (grey) cells indicate sharp acceleration (deceleration) vs 2013. For inflation, blue (grey) cells indicate sharp deceleration (acceleration) vs 2013. For sensitivity, blue cells refer to significant positive impact in equity market returns given changes in our Global Leading Indicator. For detail, please refer to Asia Pacific: Portfolio Strategy: Bridging macro to micro: 18 ideas for North Asia, October 24. Source: FactSet, MSCI, Goldman Sachs Global Investment Research Total Forward P/E Price Price Target Price Return Return EPS Growth Current Year-End Index 19-Nov-13 3-mo 6-mo 12-mo 3-mo 6-mo 12-mo (USD) 2014E 2015E Consensus 2014E TOPIX 1,237 1,350 1,375 1,450 9 % 11 % 17 % 12 % 21 % 14 % 14.3 x 13.6 x Stoxx Europe 600 323 330 340 360 2 5 12 19 14 13 13.5 12.9 MXAPJ 478 485 490 525 1 2 10 13 10 14 12.1 12.0 S&P 500 1,788 1,800 1,850 1,900 1 3 6 8 8 8 14.9 15.2 EPS growth (%) 12-month return forecasts (%) Allocation Market Index Index level (Nov 18) CY14E CY15E Local price return FX change Dividend yield USD total return China HSCEI 11,307 10 11 10.0 13,600 20 -1 3 23 Taiwan TWSE 8,191 11 13 14.0 9,200 12 2 3 17 Korea KOSPI 2,011 15 15 9.1 2,350 17 -3 1 15 Singapore FSSTI 3,203 8 14 12.5 3,300 3 8 4 15 Malaysia FBMKLCI 1,792 8 10 15.3 1,950 9 0 3 12 Philippines PCOMP 6,343 8 16 15.5 6,300 -1 9 2 10 India NIFTY 6,189 12 18 13.7 6,900 11 -3 2 10 Indonesia JCI 4,394 12 17 13.0 5,000 14 -2 3 15 Thailand SET 1,424 9 11 11.8 1,510 6 -1 4 8 Hong Kong MXHK 13,310 6 9 15.0 14,100 6 -1 3 8 Australia AS51 5,385 8 11 14.5 5,900 10 -9 5 5 Asia Pacific ex Japan (USD) MXAPJ 478 10 14 12.0 525 12 -3 3 13 Asia ex Japan (USD) MXASJ 556 11 13 11.4 625 13 -1 3 15 Underweight Target P/E (X) Index target Marketweight Overweight China Taiwan Korea Singapore Malaysia Philippines India Indonesia Australia Thailand HongKong 2014 GDP growth (%) 7.8 3.8 3.7 3.8 5.0 6.3 5.0 5.3 2.0 4.2 3.7 2014 Inflation (%) 3.1 1.4 2.4 3.3 2.8 3.8 6.5 6.8 2.9 2.8 3.3 Sensitivity to global growth √ √ √ √ 2014E-15E EPS CAGR (%) 11 12 15 11 9 12 15 15 10 10 8 NTM P/E (X) 9.3 14.1 8.8 14.1 15.5 18.5 14.4 13.3 14.5 11.9 15.0 LTM P/B (X) 1.5 1.8 1.2 1.5 2.2 3.1 2.5 3.1 2.0 2.2 1.3 Avg. of 10y Z scores for P/E & P/B (1.0) (0.2) (0.8) (0.4) 0.7 1.5 (0.6) (0.1) 0.1 0.5 (0.6) Currency 12-mo chg vs. US$ (%) (0.6) 1.9 (3.4) 8.4 0.1 8.8 (6.0) (1.7) (9.3) (1.3) (0.6) Positioning Asia-fund bp OW/UW √ √ √ X O O X O X X X OW OW OW MW MW MW MW UW UW UW UW Macro Valuations EPS growth
  • 7. November 21, 2013 Asia Pacific Goldman Sachs Global Investment Research 7 Exhibit 4: Cyclicals over defensives Source: FactSet, MSCI, Goldman Sachs Global Investment Research Exhibit 5: China, Taiwan, Korea and 3 flavors of earnings Source: Goldman Sachs Global Investment Research GS Asia STAMP Current STAMP Scores based on our macro views and latest data Macro EPS Relative Current Current GS Views Sentiment Valuation STAMP Score Allocation Autos & Components √√ √√ √ √√ Overweight Tech Hardware & Semis √√ x √√ Overweight Banks √ √√ √√ Overweight Software & Services √√ √√ xx √ Overweight Transportation x Overweight Energy √√ √√ √√ Marketweight Health Care √ √ Marketweight Capital Goods xx √ Marketweight Insurance & other Financials √ Marketweight Metals & Mining √ x Marketweight Chemicals & other Materials xx x xx Marketweight Consumer Retail & Services √ xx xx xx Marketweight Real Estate x √ √√ Underweight Utilities x xx x Underweight Consumer Staples xx x xx Underweight Telecom Services xx x √ xx Underweight Current "Simplified" Macro Views Growth: A mild pick up Dom. vs. Extenal: External Infl. vs. Growth: Neutral Policy: Neutral Current metric is: √√ Very favorable √ Favorable Neutral x Negative xx Very Negative Our trade recommendations China: Reform beneficiaries; HSCEI 3-month call-spreads Taiwan: Stock ideas in 'Old Tech' Korea: EWY, KOSPI 200 6-month call-spreads Macro slices Global Cyclicals vs Asset-Sensitive Fins. <GSSZMSGC vs. GSSZMSFA> Margin expansion (Delta Earnings) Growth at value (Value Earnings) Europe-exposed (Destination Earnings) Downside Hedge March expiry outright puts on ASX 200 (Australia) Secular Themes Digitalization of consumption, Urbanization, and Green GDP Style / Themes: Earnings Growth Markets
  • 8. November 21, 2013 Asia Pacific Goldman Sachs Global Investment Research 8 Market view changes: Upgrade China and Taiwan to Overweight China: Upgrade to OW on improving reform momentum; 3 ways to engage We upgrade China to Overweight from Market weight for the following reasons:  The long-waited catalyst has materialized: A full plenary document was released on November 15, a few days after the closure of the session. The detailed document, which covers many specific commitments including market deregulation/financial reform, fiscal and tax policy, safety nets/demographics, urban/rural; and SOE reform, has reinvigorated market expectations on reform and China’s longer-term growth prospects.  Reform momentum is likely to stay strong in the coming months: While we are mindful of being carried away by policy-driven sentiment swings as the speed and effectiveness with which the measures will be executed remains to be seen and China still needs to work through numerous structural challenges, we believe there is a reasonable chance that we may see a more concrete timetable and implementation details to be announced at the ministry level in the coming few months.  A decent fundamental configuration: Our economists expect China’s GDP to grow 7.8% on a real basis in both 2014 and 2015, leading to stable 10% and 11% EPS growth for China in those respective years based on our top-down forecast.  Inexpensive valuations: China currently trades on 9.3x forward P/E and 1.5x trailing book, 0.9 and 1.1 s.d. to the attractive side of their respective 10-year ranges. We fully acknowledge that low valuation is not always a strong argument to turn bullish, but we think it is a tailwind for returns when catalysts emerge.  Light positioning: EPFR data suggests GEM- and Asia-focused funds are currently underweight China by 290 bps and 582 bps respectively, suggesting favorable positioning normalization risk.  Implementation: We recommend 3 ways to get upside exposure to China o We continue to favor reform beneficiaries and highlight 9 buy-rated stocks which revolve around the themes of mass market consumption, healthcare, brokers and defense (Exhibit 8). o Chinese banks, which are the fourth largest country-sector in MXAPJ, are trading at very low absolute valuations (5.1X 2014E P/E, 0.9X P/B) and may see asymmetric upside risk if more bank-specific reform policies are laid out in the foreseeable future. We are OW banks at both regional market and China levels. o We recommend investors take advantage of moderate vol and elevated call-skew (OTM calls expensive relative to ATM calls) by buying call- spreads on HSCEI. 3-month 105/115% call-spreads currently cost 2.15%, at 27% cost-savings to outright 105% calls (2.95%), much higher than similar call-spreads on most markets globally. The trade provides a maximum payout of 4.7x if HSCEI rallies 15% by expiry. Risks: Buyers of 105/115% call-spreads risk capped upside if HSCEI rises more than 15% and loss of up-front premium if HSCEI rises less than 5% by expiry.  Key risks to our upgrade: Reform implementation falls short of market expectation, and tighter-than-market-expected liquidity. Also see China: Portfolio Strategy Research: Third Plenary: Ambitious blueprint to boost sentiment, November 18.
  • 9. November 21, 2013 Asia Pacific Goldman Sachs Global Investment Research 9 Exhibit 6: Chinese banks are trading at attractive valuation levels Exhibit 7: Active managers are underweight China Source: FactSet, EPFR, I/B/E/S, Goldman Sachs Global Investment Research Source: FactSet, EPFR, I/B/E/S, Goldman Sachs Global Investment Research Exhibit 8: We favor China reform-beneficiaries * indicates the stock is on our regional Conviction List. Source: FactSet, MSCI, I/B/E/S, Goldman Sachs Global Investment Research Exhibit 9: HSCEI call-skew has increased with OTM calls trading expensive vs. ATM calls, compared to their historical relationship Exhibit 10: Call-spreads on HSCEI currently offer meaningful cost savings (27%) unlike most major markets globally Source: Goldman Sachs Global Investment Research Source: Goldman Sachs Global Investment Research. 9.3 5yr z-score: -0.73 12.1 5yr z-score: -0.09 4 10 16 22 28 May-06 Aug-06 Nov-06 Feb-07 May-07 Aug-07 Nov-07 Feb-08 May-08 Aug-08 Nov-08 Feb-09 May-09 Aug-09 Nov-09 Feb-10 May-10 Aug-10 Nov-10 Feb-11 May-11 Aug-11 Nov-11 Feb-12 May-12 Aug-12 Nov-12 Feb-13 May-13 Aug-13 Nov-13 MXCN 12m fP/E MXCN 12m fP/E ex. banks Forward PE -290 10yr z-score: -0.32 -582 10yr z-score: -0.89 -800 -700 -600 -500 -400 -300 -200 -100 0 100 200 Sep-03 Feb-04 Jul-04 Dec-04 May-05 Oct-05 Mar-06 Aug-06 Jan-07 Jun-07 Nov-07 Apr-08 Sep-08 Feb-09 Jul-09 Dec-09 May-10 Oct-10 Mar-11 Aug-11 Jan-12 Jun-12 Nov-12 Apr-13 Sep-13 Fund Allocation (OW/ UW, bps) EM Funds Asian Funds China Bloomberg Name Reform Theme Sector Listed Mkt Cap (US$ mn) 6M ADVT (US$ mn) Price (Quote) GS Rating 12m Potential +/(-)% 2013E EPSg (%) 2014E EPSg (%) 2014E P/E (X) 2014E P/B (X) 2014E D/Y (%) 6881 HK China Galaxy Financial reform Other financials 1,182 7 5.42 B 25% 21% 18% 13.0 1.2 2.0% 151 HK Want Want One child policy Cons. Stap. 18,487 20 10.84 B 15% 19% 20% 23.3 8.6 2.9% 2357 HK AviChina National defense Industrials 1,173 4 3.86 B 24% 20% 21% 19.3 1.6 1.0% 1193 HK China Resources Gas Environment protection Utilities 5,751 10 20.05 B* 22% 19% 22% 16.8 2.8 1.2% 270 HK Guangdong Investment Environment protection Utilities 5,263 7 6.54 B 31% 8% -4% 11.5 1.4 3.4% 958 HK Huaneng Renewables Environment protection Utilities 1,455 8 3.23 B -7% 106% 36% 14.1 1.5 1.2% 2196 HK Shanghai Fosun Pharm. Health care reform Healthcare 867 6 20.00 B -5% 4% 12% 17.4 2.1 1.5% 867 HK China Medical System Health care reform Healthcare 2,099 4 6.74 B* 26% 22% 25% 16.1 3.5 2.3% 700 HK Tencent Mass market consumption Internet 100,634 180 419.6 B* 7% 27% 28% 30.3 8.2 0.4% Avg 16% 27% 20% 18.0 3.4 1.8% 0.86 0.88 0.90 0.92 0.94 0.96 0.98 1.00 1.02 1.04 Jan‐10 Apr‐10 Jul‐10 Oct‐10 Jan‐11 Apr‐11 Jul‐11 Oct‐11 Jan‐12 Apr‐12 Jul‐12 Oct‐12 Jan‐13 Apr‐13 Jul‐13 Oct‐13 HSCEI 3-mo call-wing skew (25-delta call / ATM vol) 42% 27% 25% 23% 13% 13% 12% 7% 7% 6% 4% 4% 4% 3% 2% 0% 5% 10% 15% 20% 25% 30% 35% 40% 45% Bovespa HSCEI Nikkei 225 TOPIX NIFTY RDXUSD HSI KOSPI 200 S&P 500 EuroStoxx50 MSCI World TWSE FTSE 100 MSCI Sing ASX 200 Call-spread cost-saving vs. calls (3-mo 105/115% call-spreads vs. 105% calls)
  • 10. November 21, 2013 Asia Pacific Goldman Sachs Global Investment Research 10 2) Taiwan: US + China exposures; upgrade to OW We upgrade Taiwan to Overweight from Market weight for the following reasons:  A favorable macro profile: Top-down, we still feel very comfortable on how Taiwan stacks up against its global and Asia EM peers: Taiwan’s leverage is not excessive, the current account is in significant surplus (12% of GDP), the currency is not overvalued and FX volatility is low, and the FX reserve (to GDP) provides a strong liquidity cushion. These characteristics should help Taiwan weather market volatility when investors turn their attention to EM macro vulnerability and contagion risk, possibly when the Fed begins to taper, which our economists expect will be in March 2014.  Compelling thematic exposures: In addition to Korea, we view Taiwan as an efficient market to gain global cyclical exposures as its economy and equity market are closely linked to the US (25% of revenue). Additionally, we feel China reform optimism may have positive sentiment spillover to ‘China Plays’ in Taiwan, including petrochem/materials, select financials, and tourism, which in aggregate represent 16% of equity market revenue.  A more sustainable and balanced earnings growth profile in 2014: After growing earnings by 27% in 2013 from a low base, Taiwan is likely to deliver a more sustainable mid-teen EPS growth of 11% and 13% in 2014 and 2015 as margins gradually recover to mid-cycle levels. Growth contribution is likely to be more balanced than in previous years when upstream semi (TSMC) and select non-tech sectors subsidized the losses from PC supply chain segments and the petrochem industry.  Valuations are not low but should not be a key concern: Taiwan currently trades on 14.1X forward P/E and 1.8X trailing book, 17% and 9% above the regional aggregates (0.68 and 1.0 s.d.). The high absolute and relative valuations have been a key consideration preventing us from turning more positive on Taiwan, but given our economists’ rising conviction on DM recovery and Taiwan-specific merits (a favorable macro profile, high and stable dividend yields), we feel the valuation burden should not dismiss our positive investment case (and return expectation) on Taiwan which will be driven primarily by fundamental earnings growth.  Light investor positioning: Similar to China and Korea, global- and Asia-focused investors are underweight by a wide margin – 249bps by GEM funds and 649bps by Asian-mandated funds. The recent FINI inflows of US$7.6bn since July look high at the first glance, but less significant compared with the depth of the market.  A better year for ‘Old tech’. As we detail in the ‘Key questions’ section, we expect 'Old tech', which accounts for half of total market cap, to have a better year in terms of absolute return as: o Valuation has now reached arguably attractive levels, especially relative to ‘New tech’ which focuses on software design and other tech- related value-added services. o Taiwan tech appears more favorably skewed towards a DM recovery story given their revenue exposures there. o Our analyst remains fundamentally bullish on TSMC (Buy, on Conviction list), the largest stock in MSCI Taiwan (20%) and TAIEX (12%).
  • 11. November 21, 2013 Asia Pacific Goldman Sachs Global Investment Research 11 Exhibit 11: Taiwan’s macro profile looks solid relative to global/Asia EMs Exhibit 12: Taiwan’s fundamentals are well linked to the US and China Source: Haver, CEIC, MSCI, Goldman Sachs Global investment Research Source: MSCI, Goldman Sachs Global investment Research Exhibit 13: Growth contribution is likely to be more balanced in 2014 Exhibit 14: Valuations are not low but shouldn’t be a major concern Source: I/B/E/S, MSCI, Goldman Sachs Global Investment Research Source: FactSet Exhibit 15: Stocks we highlight in Taiwan B* indicates the stock is on Conviction Buy list. Source: I/B/E/S, Lionshare, FactSet, Goldman Sachs Global Investment Research 86% 68% 25% 12% -14% 37% 22% 9% 1% 10% 20% 44% 8% 0% 8% -20% 0% 20% 40% 60% 80% 100% FX reserve/GDP (%) GDPg correl. with the US Sales Exp. to the US C/A as % of GDP (%) FX over- /undervaluation Taiwan AeJ EM (%) 25% 19% 12% 9% 8% 6% 8% 3% 3% 12% 16% 3% 11% 13% 8% 9% 3% 5% 1% 9% 10% 14% 13% 12% 9% 8% 6% 5% 4% 11% 0% 10% 20% 30% 40% 50% 60% Taiwan India Korea HongKong Australia Singapore Philippines Malaysia Thailand MXAPJ MSCI Indexes Revenue Exposure (%) % from EU % from CN % from US -7% 3% 32% 8% 13% 25% 25% 20% 11% 24% 19% 9% 17% 15% 7% 13% 11% 3% -10% 0% 10% 20% 30% 40% 50% 60% 70% 80% 90% 100% 2013E Earnings 2014E Earnings 2014E Earnings Growth Contribution Technology Distributors wafer PCB Solar power Other Tech IC packaging and testing Acer Consumer electronics LED Touch screen ODM/OEM Other components (NB) Fabless design Foundry Others Financials Petrochem TFT-LCD (panel) 8.0 10.0 12.0 14.0 16.0 18.0 20.0 -50% -40% -30% -20% -10% 0% 10% 20% 30% 40% 50% Nov-03 Nov-04 Nov-05 Nov-06 Nov-07 Nov-08 Nov-09 Nov-10 Nov-11 Nov-12 Nov-13 Fwd PE Prem/ Disc (%) Fwd PE Prem/ Disc (MXTW vs. MXAPJ) MXTW - 12M forward P/E fPE: 14.1X 5-yr z-score: 0.42 Forward PE (X) Ticker Name Sector Listed Mkt Cap (US$ mn) 6M ADVT (US$ mn) Price (Quote) GS Rating* 12m Pot. +/(-)% 14E EPSg (%) Agg. EM Funds OW/UW (bps) 5yr avg. ROE 5yr avg. CROCI 14E P/E (X) 5yr PE z- score 14E P/B (X) 2330 TT TSMC Semi 91,212 116 104.00 B* 25% 16% 14.5 23% 18% 12.5 -0.2 2.7 2317 TT Hon Hai Comp. H/W 33,440 81 75.30 B 17% 3% -76.2 16% 13% 9.4 -0.5 1.1 2308 TT Delta Elec Comp. H/W 11,838 23 144.00 B 17% 27% -23.2 19% 24% 15.7 0.9 3.3 2891 TT Chinatrust Fin. Banks 9,406 21 18.90 B* 22% 21% -23.1 9% - 11.3 -0.2 1.3 2311 TT Advanced Semi Semi 7,897 19 30.10 CS - 23% -15.7 14% 10% 12.5 -0.2 1.8 3008 TT Largan Comp. H/W 4,510 45 994.00 B 36% 18% -9.1 26% 41% 12.6 -1.1 3.3 2474 TT Catcher Tech. Comp. H/W 4,507 38 177.50 B 7% -3% -9.5 17% 14% 10.4 -0.5 1.8 2823 TT CH Life Insur. (TW) Insurance 2,555 12 27.75 B 23% 7% -5.2 18% - 12.6 -0.5 1.5 2439 TT Merry Electronics Comp. H/W 640 8 107.50 B* 35% 60% 0.1 11% 14% 12.2 1.2 2.8 Avg 23% 19% -16.4 17% 19% 12.1 -0.1 2.2 TW Avg - 11% -6.9 11% 14% 17.8 0.6 2.2 Taiwan
  • 12. November 21, 2013 Asia Pacific Goldman Sachs Global Investment Research 12 3) Korea: A global cyclical recovery play; reiterate Overweight We reiterate our Overweight stance for Korea’s leverage on the global cyclical recovery. Our end-2014 target for KOSPI is 2,350, implying 17% upside. Our arguments are as follows:  Macro: well positioned for DM recovery, improving domestic sentiment. Korea is among the markets that are most leveraged to the global macro cycle. In value-added terms, the US and Europe are the two largest markets for Korea exports. Our economists expect GDP growth to accelerate to 2.9% in 2014 from 1.7% in 2013 in the US, and 1.1% from -0.4% in the Euro area. China, the third largest export destination for Korea, will likely maintain stable growth in our view. We are also seeing early signs of a pickup in domestic demand after a long period of weakness. Housing markets have gradually improved, imports of machinery have further risen, and credit expansion has resumed. Given the “twin engines” of growth, we expect GDP growth to accelerate to 3.7% next year from 2.9% in 2013.  Earnings: highest growth in the region. We forecast 15% EPS growth in Korea each in 2014 and 2015, compared to consensus of 20% and 11%. Although some moderate negative revisions are likely, we expect Korea will still be the market with the fastest earnings growth in the region next year. Even without valuation expansion, Korea should be able to deliver decent returns just “riding on earnings”.  Valuation: attractive relative to the region. Korea is currently trading at 8.8X forward P/E and 1.2X trailing P/B, which are 0.5 and 1.2 s.d. below the 10-year average. It is also trading at a deep discount to the region (27% for P/E and 32% for P/B). Although relative valuations have risen, they are only 13% and 18% above trough levels. We believe there is potential for further valuation expansion.  Positioning: potential for inflow to continue given funds’ underweight. Year- to-date, foreigners have bought US$6.5bn of Korean equities. Despite the inflows, mutual funds remain strongly underweight the market (by 769bp). Given light investor positioning, we see potential for more inflows.  Implementation: Buy EWY (US-listed ETF); prefer KOSPI 200 call-spreads for asymmetric exposure. We suggest buying EWY (US-listed ETF on MSCI Korea) as a direct way to position for long exposure in Korea. Although EWY is US- denominated and hence exposed to FX risk, we see modest depreciation pressure on KRW next year. Investors who can trade derivatives and want to limit any downside risk can take advantage of low implied volatility. 6-month implied vols on KOSPI 200 are currently trading at 15.4v, which is less than 1 vol point above its lows (14.8v) and in the 3rd percentile of its history since 2007. We prefer call-spreads to outright calls. 6-month 105/115% call-spreads on KOSPI 200 currently cost 1.9% with maximum potential payout of 5.3x. Risks: Buyers of 105/115% call-spreads risk capped upside if KOSPI 200 rises more than 15% and loss of up-front premium if KOSPI 200 rises less than 5% by expiry.
  • 13. November 21, 2013 Asia Pacific Goldman Sachs Global Investment Research 13 Exhibit 16: “Twin engines” of growth: DM recovery and improving domestic sentiment to lift GDP growth in 2014 Exhibit 17: We expect Korea to deliver the strongest earnings growth in the region Source: Source: EPFR, FactSet, I/B/E/S, MSCI, Goldman Sachs Global Investment Research. Source: Source: EPFR, FactSet, I/B/E/S, MSCI, Goldman Sachs Global Investment Research. Exhibit 18: Korea’s valuations remain attractive vs. the region Exhibit 19: Active managers are still underweight the market Source: EPFR, FactSet, I/B/E/S, MSCI, Goldman Sachs Global Investment Research Source: EPFR, FactSet, I/B/E/S, MSCI, Goldman Sachs Global Investment Research 8.7 7.6 4.5 4.9 4.3 3.5 3.6 3.4 2.8 2.4 1.6 1.5 1.5 2.3 3.3 4.2 4.2 3.9 3.6 3.3 0.0 1.0 2.0 3.0 4.0 5.0 6.0 7.0 8.0 9.0 10.0 2010-1Q 2010-2Q 2010-3Q 2010-4Q 2011-1Q 2011-2Q 2011-3Q 2011-4Q 2012-1Q 2012-2Q 2012-3Q 2012-4Q 2013-1Q 2013-2Q 2013E-3Q 2013E-4Q 2014E-1Q 2014E-2Q 2014E-3Q 2014E-4Q Real GDP (yoy) Korea 15% 12% 12% 11% 10% 9% 8% 8% 8% 8% 6% 10% 4% 6% 8% 10% 12% 14% 16% Korea Indonesia India Taiwan China Thailand Australia Philippines Malaysia Singapore HongKong MXAPJ 2014E EPS growth (%) -80% -70% -60% -50% -40% -30% -20% -10% 0% 10% 20% Nov-95 Nov-96 Nov-97 Nov-98 Nov-99 Nov-00 Nov-01 Nov-02 Nov-03 Nov-04 Nov-05 Nov-06 Nov-07 Nov-08 Nov-09 Nov-10 Nov-11 Nov-12 Nov-13 Valuation Prem/ Disc (MXKR vs MXAPJ) Trailing PB Prem/ Disc Fwd PE Prem/ Disc -25% 10yr z-score: -0.29 -31% 10yr z-score: -1.24 -1200 -800 -400 0 400 800 1200 Oct-03 Apr-04 Oct-04 Apr-05 Oct-05 Apr-06 Oct-06 Apr-07 Oct-07 Apr-08 Oct-08 Apr-09 Oct-09 Apr-10 Oct-10 Apr-11 Oct-11 Apr-12 Oct-12 Apr-13 Oct-13 ASEAN India Hong Kong China Korea Taiwan Asia-fund OW/UW (bps)
  • 14. November 21, 2013 Asia Pacific Goldman Sachs Global Investment Research 14 Implementation: Emphasizing earnings 1) Earnings growth: Stylistic and thematic implementation One of our core themes for 2014 is seeking earnings growth without too much exposure to valuation risk. We highlight three different flavors of earnings-related implementation: a) Delta Earnings (Margin expansion) b) Value earnings (attractively priced growth) and c) Destination earnings (Europe-exposed stocks), as described in detail below. a) Margin expansion  Identifying cyclical margin recovery and structural margin expansion stocks: We believe the magnitude of margin improvement next year will remain mild, but that it will be much stronger in 2015. Despite this, we see a few sectors with potential for early margin recovery on improving demand/supply dynamics. Together with names that have structural margin expansion stories, we highlight a list of 12 stocks in the region (Exhibit 20).  Entry points matter: Within our list, some China names have rallied sharply along with the overall market on reform enthusiasm. While we are confident on their improving margin outlook, we suggest investors wait for better entry levels.  Appealing growth/valuation profile: Our analysts forecast these stocks overall will see 2014 earnings growth accelerating to 18% (from 1% in 2013), and they are trading at 10.8X 2014E P/E on median. Their growth/valuation profile thus looks favorable compared to the overall market. Exhibit 20: Stocks whose earnings may benefit from expanding margins B* indicates the stock is on Conviction Buy list. Source: Goldman Sachs Global Investment Research. Ticker Name Country Sector Listed Mkt Cap (US$ mn) 6M ADVT (US$ mn) Price (Quote) GS Rating 12m Potential +/(-)% 2013 EPSg (%) 2014 EPSg (%) 2013 NM (%) 2014 NM (%) 2015 NM (%) 2014 P/E (X) 2014 P/B (X) 2014 D/Y (%) 005380 KP Hyundai Motor Korea Autos 51,576 96 249000 B 18% 1% 14% 10% 10% 11% 5.6 0.9 0.8% TTMT IS Tata Motor India Autos 16,437 53 386 B* 18% 34% 18% 7% 7% 7% 6.8 1.8 0.2% 914 HK Anhui Conch Cement China Materials 4,567 39 27.25 B* 19% 32% 18% 16% 17% 18% 11.5 1.8 1.7% 3323 HK China National Building Material China Materials 2,822 36 7.60 B 30% 9% 31% 5% 6% 7% 4.0 0.8 3.7% SMM SP Sembcorp Marine Singapore Industrials 7,394 10 4.41 B 20% -1% 53% 10% 11% 11% 12.1 2.9 4.1% 2039 HK China Itnl' Marine Containers China Industrials 2,601 2 14.10 B 16% -36% 90% 2% 3% 5% 12.5 1.3 2.4% 012630 KP Hyundai Dev. Korea Industrials 1,701 7 24000 B* 13% NM NM -3% 5% 5% 8.2 0.8 4.2% 386 HK Sinopec China Oil and gas 21,388 67 6.50 B 12% 17% 14% 3% 3% 3% 6.8 1.0 5.8% 023530 KP Lotte Shopping Korea Retailing 11,164 13 377000 B 17% -9% 11% 3% 4% 4% 10.1 0.6 0.4% 2331 HK Li Ning Co. Ltd. China Retailing 1,169 5 6.62 B 30% -85% -115% -6% 1% 5% 125.5 2.5 0.0% 2439 TT Merry Elec. Taiwan Retailing 640 8 108 B* 35% 102% 60% 9% 12% 13% 12.2 2.8 3.5% 347 HK Angang Steel China Steel 682 9 4.87 B* 31% -130% 90% 2% 3% 5% 11.8 0.6 4.5% Median 18% 1% 18% 4% 5% 6% 10.8 1.2 3.0%
  • 15. November 21, 2013 Asia Pacific Goldman Sachs Global Investment Research 15 b) Growth at value We classify the bottom 25 percentile of stocks based on Forward PE as Value stocks and top 25 percentile of stocks based on sales growth in each market as Growth stocks and make the following observations:  Growth has outperformed value 9 years in a row (Exhibit 21).  Growth looks quite expensive relative to value (51% PE and 44% PB premium), but growth remains scarce, and value stocks could be a trap given low ROEs.  We prefer select growth stocks with reasonable valuations. We screen the bottom 25th percentile of stocks among Growth stocks based on their P/E. The combined Growth+Value strategy has performed better than either Growth or Value individually. We highlight Sembcorp Marine, Largan Precision, Tata Motors and Geely as stocks that screen well within our list (Exhibit 25). Exhibit 21: Growth has outperformed value 9 years in a row Exhibit 22: Value stocks are valued at high discounts to growth stocks Source: DataStream, FactSet, Goldman Sachs Global Investment Research Source: DataStream, FactSet, Goldman Sachs Global Investment Research Exhibit 23: The combined growth+value strategy has performed even better Exhibit 24: Value has low ROE but growth seems expensively priced Source: DataStream, FactSet, Goldman Sachs Global Investment Research Source: DataStream, FactSet, Goldman Sachs Global Investment Research -60% -30% 0% 30% 60% 90% 120% 2000 2001 2002 2003 2004 2005 2006 2007 2008 2009 2010 2011 2012 2013YTD Annual Return (%) Value Growth MXAPJ -15% 0% 15% 30% 45% 60% 2001 2002 2003 2004 2005 2006 2007 2008 2009 2010 2011 2012 2013(Curr.) Growth vs. Value Rel Fwd PE Prem/ Disc Growth stocks more expensive 80 100 120 140 160 180 200 Jan-10 Mar-10 May-10 Jul-10 Sep-10 Nov-10 Jan-11 Mar-11 May-11 Jul-11 Sep-11 Nov-11 Jan-12 Mar-12 May-12 Jul-12 Sep-12 Nov-12 Jan-13 Mar-13 May-13 Jul-13 Sep-13 Rebased Index Value Growth Growth (Value) MXAPJ Value vs Growth Value Growth MXAPJ Growth (+Low fPE) 2014 EPSg 9.9% 20.1% 12.1% 20.2% 2015 EPSg 9.3% 16.5% 10.2% 13.0% 2014 SPSg 6.8% 18.7% 7.0% 20.5% 2015 SPSg 6.4% 15.3% 6.0% 11.1% Fwd PE 9.8 14.9 12.6 9.2 10yr z-score (0.58) 0.76 (0.28) (0.36) Trailing PB 1.4 2.0 1.7 1.2 10yr z-score (1.21) (0.33) (0.87) (0.86) Return (Ytd) 1.0% 10.4% 3.1% 5.1% Volatility (10Y, Ann.) 25% 26% 27% 30% Sharpe Ratio (10Y, Ann.) 0.66 1.06 0.32 1.23 FundementalValuationPrice
  • 16. November 21, 2013 Asia Pacific Goldman Sachs Global Investment Research 16 Exhibit 25: Growth stocks at modest valuations B* indicates the stock is on Conviction Buy list. Source: FactSet, MSCI, I/B/E/S, Goldman Sachs Global Investment Research c) Europe-exposed stocks While our Global Cyclicals thematic slice is largely concentrated in the Info Tech sector, we also look at specific stocks that have high revenue exposures to DM (US and Europe) and should therefore benefit from a meaningful recovery in external demand. We note that US- exposed stocks (with at least 35% revenue exposure to the US) have risen 16% on an average from June lows (vs. 12% for MXAPJ) and outperformed MXAPJ by 12% year-to- date. On the other hand, the Europe-exposed stocks have lagged underperforming MXAPJ by 11% year-to-date. Our economists forecast expansion in Euro area GDP of 1.1% in 2014 and 1.5% in 2015 coming after two years of contraction in output, which should bode well for our EU-exposed stocks, in our view. We highlight a list of 18 stocks with at least 30% revenue exposure to Europe and that are currently trading at less than 20x P/E on 2014 expected earnings (Exhibit 26). The portfolio has an average revenue exposure of 43% to Europe, compared to 8% for the overall region. With 20.5% EPS growth and 13.1x P/E for next year (PEG ratio of 0.64), our Europe-exposed portfolio offers a better growth/valuation profile than the overall region on average (15.9x avg. P/E, 16.7% avg. EPS growth and PEG ratio of 0.95). The growth/valuation profile of our Europe-exposed portfolio is also higher than the US-exposed basket with an average revenue exposure of 51% to US and PEG ratio of 0.9 (16.5x avg. P/E and 19% EPS growth). >75th Percentile <15X Ticker Name Country Sector Listed Mkt Cap (US$ mn) 6M ADVT (US$ mn) Price (Quote) GS Rating 12m Potential +/(-)% 2014E EPSg (%) 2015E EPSg (%) 2014E SPSg (%) Fwd PE (X) 2014E P/E (X) 2014E P/B (X) 2014E D/Y (%) 2014E ROE (%) 2015E ROE (%) 037620 KP Mirae Asset Korea Insur. & other fin. 1,272 4 32300 NC - 66% 10% 69% 8.1 7.8 0.6 2.5% 8% 8% SMM SP Sembcorp Marine Singapore Industrials 7,394 10 4.41 B 20% 26% 8% 28% 14.2 14.0 3.0 3.9% 22% 21% PGAS IJ PT Perusahaan Gas Indonesia Utilities 10,118 13 4850 N 3% 31% 8% 25% 10.7 10.5 3.3 5.0% 32% 29% 813 HK Shimao Property China Property 8,509 17 19.00 B 3% 25% 15% 23% 6.6 6.5 1.1 4.7% 17% 17% 3008 TT LARGAN Precision Taiwan Computer H/W 4,510 45 994 B 36% 15% 12% 20% 13.0 12.9 3.7 3.0% 29% 27% HCLT IS HCL Technologies India I.T. services 11,988 22 1086 B 22% 24% 12% 20% 12.8 12.7 3.5 1.4% 28% 25% 1 HK Cheung Kong Hong Kong Property 36,175 58 121 B* 19% 8% 6% 18% 9.4 9.3 0.7 2.8% 8% 8% TTMT IS Tata Motors India Autos 16,437 53 386 B* 18% 22% 12% 15% 8.2 8.0 2.0 0.6% 24% 22% 3968 HK China Merc. Bank China Banks 9,071 42 15.32 B* 28% 6% 13% 15% 5.6 5.6 1.0 4.9% 18% 17% 175 HK Geely Automobile China Autos 4,518 33 3.98 B* 31% 14% 13% 15% 8.8 8.7 1.5 1.6% 17% 16% Avg 24% 11% 25% 9.7 9.6 2.0 3.0% 20% 19% APJ Avg. 17% 16% 11% 15.9 15.4 2.4 2.9% 15% 15%
  • 17. November 21, 2013 Asia Pacific Goldman Sachs Global Investment Research 17 Exhibit 26: We expect Europe-exposed Asian stocks to benefit as external demand recovers Criteria: EU sales exposure > 30%, 2014 P/E < 20x Note: B= Buy, N= Neutral, NC=Not Covered; * denotes stock is on our Regional Conviction List Source: FactSet, MSCI, I/B/E/S, Goldman Sachs Global Investment Research. Exhibit 27: While US-exposed stocks have outperformed, Europe-exposed stocks have lagged in the recent rally Note: Europe-exposed stocks comprises of Asian stocks with more than 30% sales exposure to Europe; US-exposed stocks comprises of Asian stocks with more than 35% sales exposure to US Source: FactSet, MSCI, I/B/E/S, Goldman Sachs Global Investment Research Ric Name EU Sales Exposure Market Sector Curncy Price (Quote) Listed market cap (US$ mn) 3M ADVT (US$ mn) GS Rating 2014 P/E 2014 EPS Growth HGG.AX Henderson Group 90% Australia Financials AUD 3.79 3,948 10.4 B 14.8 11.9 VARD.SI Vard Holdings 80% Singapore Industrials SGD 0.83 776 3.1 N 8.1 40.2 028050.KS Samsung Engineering 63% Korea Industrials KRW 64,800 2,460 30.0 N 14.1 - AMC.AX Amcor 55% Australia Materials AUD 11.12 12,608 38.5 N 15.6 15.5 TEML.NS Tech Mahindra 51% India Software and services INR 1,734 6,144 34.4 B* 12.7 14.0 0013.HK Hutchison Whampoa 46% Hong Kong Industrials HKD 95.9 52,071 66.7 B 12.1 12.2 SCMN.SI Sembcorp Marine 46% Singapore Industrials SGD 4.41 7,394 9.4 B 14.0 26.0 006360.KS GS Engg & Construction 42% Korea Industrials KRW 32,200 1,525 17.0 N 14.3 - BIOS.SI Biosensors International 40% Singapore Health Care SGD 0.89 1,205 2.6 N 14.2 4.4 000210.KS Daelim Industrial 38% Korea Industrials KRW 96,000 3,177 18.5 N 7.9 19.0 TISC.NS Tata Steel 38% India Steel, aluminium INR 386.1 5,762 48.0 NC 10.0 50.7 BXB.AX Brambles 35% Australia Industrials AUD 9.30 13,631 40.5 B 17.7 14.0 ITMG.JK PT Indo Tambangraya 34% Indonesia Oil and gas IDR 31,200 3,151 2.8 N 11.0 30.4 2439.TW Merry Electronics Co. 34% Taiwan Consumer Discretionary TWD 115 640 9.9 B* 12.8 55.3 IOIB.KL IOI Corp. Bhd. 33% Malaysia Consumer Staples MYR 5.46 10,937 7.2 N 17.9 1.7 0005.HK HSBC Holdings 32% Hong Kong Banks HKD 86.3 206,973 128.1 B 10.9 7.2 REDY.NS Dr. Reddy's Laboratories 30% India Health Care INR 2,464 6,610 12.5 CS 18.8 14.5 2018.HK AAC Technologies 30% China Offshore Comp. hardware/assemblers HKD 31.5 4,846 22.9 B 11.4 2.6 43% 13.1 20.5 8% 15.9 16.7 Europe-exposed stocks (Average) MXAPJ (Equal-weight, Avg.) 80 90 100 110 120 130 140 150 Jan‐12 Mar‐12 May‐12 Jul‐12 Sep‐12 Nov‐12 Jan‐13 Mar‐13 May‐13 Jul‐13 Sep‐13 Nov‐13 MXAPJ Europe- exposed stocks US-exposed stocks STOXX 600 85 90 95 100 105 110 115 120 125 130 75 80 85 90 95 100 105 110 115 Jan‐12 Mar‐12 May‐12 Jul‐12 Sep‐12 Nov‐12 Jan‐13 Mar‐13 May‐13 Jul‐13 Sep‐13 Nov‐13 MXAPJ (rhs) Europe-exposed stocks vs. MXAPJ (Equal-weighted)
  • 18. November 21, 2013 Asia Pacific Goldman Sachs Global Investment Research 18 2) Global Cyclicals vs. Asset Sensitive Financials We recommended Global Cyclicals vs. Asset Sensitive Financials as one of our preferred trades for the fourth quarter. So far, the trade has gained 5% while the MXAPJ has posted flat returns. We continue to like this trade for 2014 as we believe Asian equities will benefit next year from a moderate improvement in growth (largely helped by the recovery in the US and EU) while liquidity will marginally tighten (Fed tapering and domestic policy normalization). The net impact should be positive for areas with export orientation and high revenue exposures to external demand while negative for asset price inflation. Along these lines, the Global Cyclicals and Asset Sensitive Financials (which largely includes property stocks) remain at opposite ends. The entry point of the long/short trade still looks attractive with almost 13% upside to 2011 highs. In addition to this, growth/valuations profile for Global Cyclicals is also better than that of Asset Sensitive Financials. Global Cyclicals trade at 9.8x forward P/E, which is a 20% discount to Asset Sensitive Financials (at 12.5x forward P/E). With 2014 EPS growth of 16%, Global Cyclicals offers higher growth at a lower price (PEG ratio of 0.6) than both Asset Sensitive Financials (PEG ratio of 1.0) and the overall region (PEG ratio of 1.1). Exhibit 28: Global Cyclicals vs. Asset Sensitive Financials theme could continue to generate alpha as external demand recovers and monetary policy normalizes Source: Bloomberg, FactSet, Goldman Sachs Global Investment Research Exhibit 29: Global Cyclicals offer better growth at lower price than both Asset Sensitive Financials and broader region Source: Bloomberg, FactSet, Goldman Sachs Global Investment Research 90 95 100 105 110 115 120 125 130 Dec-09 Mar-10 Jun-10 Sep-10 Dec-10 Mar-11 Jun-11 Sep-11 Dec-11 Mar-12 Jun-12 Sep-12 Dec-12 Mar-13 Jun-13 Sep-13 Dec-13 Global Cyclicals vs. Asset Sensitive Financials (Relative performance, indexed) GSSZMSGC / GSSZMSFA 0.5 1.0 1.5 2.0 2.5 3.0 3.5 (1.00) (0.50) 0.00 0.5 1.0 1.5 2.0 2.5 3.0 USGrowthSensitivity US Rates Sensitivity Global Cyclicals Rate-Sensitive Financials Asset-Sensitive Financials Commodity Cyclicals Defensives Domestic Cyclicals Size of bubble indicates sensitivity to China Growth 6X 8X 10X 12X 14X 16X 18X 20X 22X 24X 26X Dec-03 Dec-04 Dec-05 Dec-06 Dec-07 Dec-08 Dec-09 Dec-10 Dec-11 Dec-12 Dec-13 NTMPE Global Cyclicals Asset-Sensitive Financials Global Cyclicals are trading at 20% discount to Asset Sensitive Financials Global Cyclicals Asset- Sensitive Financials MXAPJ Valuation P/E (NTM) 9.8 12.5 12.1 10yr Z-score P/E (NTM) (1.1) (0.9) (0.3) Consensus Earnings Growth 2013E (%) 19.2 4.9 7.0 2014E (%) 16.0 12.7 11.1 P/E to EPS growth ratio 2014E (X) 0.6 1.0 1.1
  • 19. November 21, 2013 Asia Pacific Goldman Sachs Global Investment Research 19 3) Preferred downside hedge: Buy ASX 200 Mar-end 95% puts Given the potential event risk in the early part of the year regarding timing and magnitude of Fed tapering (our expectation is for tapering to begin in March), we highlight our preferred hedge for investors looking to limit downside risk. We recommend buying March-expiry outright puts on ASX 200 given our cautious stance on Australian equities on weak domestic fundamentals coupled with inexpensive option pricing and attractive risk-reward to recent lows. We summarize our key arguments below:  Implied vol is low globally and currently trading in the bottom decile of its 7- yr history across most markets. Short-dated implied vols have declined significantly over the last few months with 3-month ATM implied vol on most markets currently trading in the bottom decile of its 7-year history.  We prefer outright puts to put-spreads given low vol and moderate skew. Short-dated put -skew is still low, trading below average in most markets. Consequently cost savings on put-spreads is currently less significant. Outright puts thus offer better risk-reward for hedging, in our view.  ASX 200 is more sensitive to a taper surprise given significantly higher weighting in the high-yield defensives. The high-yield defensive parts of the market may potentially come under pressure from Fed tapering. ASX 200 has around 60% weighting in the high-yield defensives (dividend yield > 4%, beta <1) significantly higher than other major markets globally and thus is more sensitive to taper surprise in our view (Exhibit 32).  ASX 200 puts are currently the most inexpensive across major markets globally. Indicatively March-end expiry 95% puts on ASX 200 currently cost 1.55%, the least expensive across markets globally.  ASX 200 puts offer best payouts if markets revert to their recent lows. Given event risk of potential Fed tapering, we look at the payouts (return on premium paid) on various March-end expiry 5% OTM put options if indices were to revert to their recent lows in late June / early July. Based on this metric, ASX 200 puts would provide a return of 465% on premium paid, the highest across major markets we track globally. Risks: ASX 200 95% put buyers risk loss of upfront premium if index falls less than 5% by March-end expiry. Exhibit 30: ASX 200 puts are the most inexpensive across major markets globally Exhibit 31: ASX 200 puts offer best returns if markets revert to their respective lows in June/July this year Source: Goldman Sachs Global Investment Research Source: Goldman Sachs Global Investment Research 0.5 1.0 1.5 2.0 2.5 3.0 3.5 4.0 4.5 EWZ Nikkei 225 RDXUSD EEM FXI EWY HSCEI EWJ EuroStoxx50 Bovespa HSI NIFTY S&P 500 FTSE 100 KOSPI 200 TWSE ASX 200 Indicative cost of Mar-end 95% puts (as % of spot) ‐50% 50% 150% 250% 350% 450% 550% ASX 200 EuroStoxx50 EWY Bovespa KOSPI 200 HSI S&P 500 HSCEI FXI Nikkei 225 EWJ RDXUSD FTSE 100 EEM EWZ NIFTY TWSEReturn on premium paid at expiry (if markets revert to their respective June/July lows)
  • 20. November 21, 2013 Asia Pacific Goldman Sachs Global Investment Research 20 Exhibit 32: ASX 200 has significantly higher weighting in the high-yield defensives vs. rest of the world Exhibit 33: Implied vol is low across markets and currently trading in the bottom decile of its 7-yr history Source: FactSet, local exchanges, MSCI, Goldman Sachs Global Investment Research Source: Goldman Sachs Global Investment Research 57 36 28 13 7 0 10 20 30 40 50 60 Australia UK Canada Europe US Country wgt. in defensive high yield Country-weight in high-yield defensives (Div. yield > 4%, beta < 1) 10 20 30 40 50 60 70 80 Jan‐07 Jun‐07 Nov‐07 Apr‐08 Sep‐08 Feb‐09 Jul‐09 Dec‐09 May‐10 Oct‐10 Mar‐11 Aug‐11 Jan‐12 Jun‐12 Nov‐12 Apr‐13 Sep‐13 AEJ 3-month ATM implied vol (%) (Avg. of KOSPI 200, HSI, HSCEI, NIFTY, TWSE and ASX 200) %tile since  2007: 5%
  • 21. November 21, 2013 Asia Pacific Goldman Sachs Global Investment Research 21 Key questions for 2014 Will Asia recover its underperformance vs. DM in 2014?  We believe Asia’s relative performance may improve if it can deliver the earnings growth that we expect it to in 2014 and 2015, given: o A low starting point: Asia (MXAPJ) has trailed the world index since mid-2010. In 2013 (ytd), Asia has lagged the global benchmark by 17pp, the 20th percentile over the past 25 years. This underperformance has been driven by compression in relative valuation, which has retreated to 2005 levels in term of forward P/E. o A better fundamental configuration: Our forecasts imply a more balanced return profile among major equity markets globally, suggesting Asia is better positioned fundamentally relative to DM in 2014 than in the past few years. o Earnings recovery in Asia: Asia has struggled to grow earnings in the past 3 years. While its DM peers have as well, investors seem to have traded weak margins more than solid topline growth in Asia, leading to valuation de-rating. We forecast Asia’s EPS to grow 10% and 14% in 2014/2015, with margins modestly expanding in 2014 and further in 2015. o Narrowing policy gaps: We expect the US to start normalizing its policy in 2014, whereas Asia is already at a more mature tightening cycle. The closing gaps may help support Asia’s relative returns, especially if the risks of tapering are better reflected in asset prices than in summer 2013, as we argue in the macro section. Exhibit 34: Asia has lagged the world index since 2010 Exhibit 35: Asia’s P/E discounts are back to 2005 levels now Exhibit 36: Margins will likely further recover in Asia Exhibit 37: Policy gaps between DM and Asia may narrow Source: DataStream, FactSet, Goldman Sachs Global Investment Research 50 75 100 125 150 175 200 225 Jan-00 Apr-01 Jul-02 Oct-03 Jan-05 Apr-06 Jul-07 Oct-08 Jan-10 Apr-11 Jul-12 Oct-13 Relative Performance Index (MXAPJ vs. MXWO) -26pp 2013ytd rel. return: -17pp (20th percentile in annal rel. return) 144 14.4 10yr z-score: 0.51 12.1 10yr z-score: -0.27 8.0 9.0 10.0 11.0 12.0 13.0 14.0 15.0 16.0 17.0 18.0 -40% -30% -20% -10% 0% 10% 20% Nov-03 Nov-04 Nov-05 Nov-06 Nov-07 Nov-08 Nov-09 Nov-10 Nov-11 Nov-12 Nov-13 Fwd PE Prem/ Disc (MXAPJ v.s MXWO) MXAPJ vs. MXWO The World index MXAPJ Forward PE (X) -16% 10yr z-score: -0.90 -10% 0% 10% 20% 30% 40% 50% 60% -10% 0% 10% 20% 30% 40% 50% 60% 2010 2011 2012 2013E 2014E 2015E 2010 2011 2012 2013E 2014E 2015E Consensus EPSg Consensus NM Consensus SPSg MXWO MXAPJ Less Margin Compression 4.4 4.3 4.3 1.7 2.1 2.3 -4.0 -3.0 -2.0 -1.0 0.0 1.0 2.0 3.0 4.0 0.0 0.5 1.0 1.5 2.0 2.5 3.0 3.5 4.0 4.5 5.0 Feb-09 Jul-09 Dec-09 May-10 Oct-10 Mar-11 Aug-11 Jan-12 Jun-12 Nov-12 Apr-13 Sep-13 Feb-14 Jul-14 Dec-14 5Y govt yield (%) Yield Gap (RHS) Asia (GDP-weighted) US Yield Gap (%)
  • 22. November 21, 2013 Asia Pacific Goldman Sachs Global Investment Research 22 Will ASEAN regain momentum in 2014?  We believe it may continue to lag the region in 2014 after having outperformed from 2006 to 2012. 2H14 could be a better time to revisit.  We believe the classic EM growth story remains intact for the ASEAN region: Favorable base effect, ample room for productivity enhancement, strong demographics, and much stronger balance sheet than in the previous crisis period (e.g. AFC).  However, a few factors could pressure equity returns cyclically: o Indonesia and Thailand need to slow excess credit growth, which has been running hot in recent years. Also, they have to trim their current account deficits further, mainly through suppressing domestic demand (i.e. higher policy rates, demand-side tightening). o These macro adjustments mean growth estimates may need to be revised down further, leading to lower EPS growth. Our earnings forecasts for ASEAN markets are generally below consensus in 2014; and o ASEAN markets’ relative valuations to the region remain at the expensive side of their historical ranges.  We look to re-engage in 2H14 when political visibility emerges and cyclical adjustments become mature. Exhibit 38: The classic EM story remains intact for ASEAN Exhibit 39: While the base is low, cyclical adjustments are needed in Indonesia, and to a lesser extent, Thailand Note: Excess credit growth is calculate by subtracting the GDP growth (209- 2012) from the nominal credit growth (2009-2012) Source: DataStream, FactSet, Goldman Sachs Global Investment Research Source: DataStream, FactSet, Goldman Sachs Global Investment Research Exhibit 40: More downward revisions may take place Exhibit 41: Valuations do not look attractive yet Source: DataStream, FactSet, Goldman Sachs Global Investment Research Source: DataStream, FactSet, Goldman Sachs Global Investment Research ASEAN4 AeJ G7 *Capita stock per worker (US$) 18,432 49,276 225,191 *GDP per Capita (US$) 5,532 5,956 45,798 Population below 40 71% 62% 53% Avg worker wages (Mth, US$) 372 1061 3494 * The numbers are weighted by GDP. 273% 253% 238% 172% 152% 145% 130% 96% 85% 56% 48% 52% 46% 31% -7% 14% 25% 11% 8% 42% -10% 0% 10% 20% 30% 40% 50% 60% -50% 0% 50% 100% 150% 200% 250% 300% HongKong Singapore China Malaysia Korea Taiwan Thailand India Philippines Indonesia Total debt to GDP (%) Total Debt to GDP (2012) Excess Credit Growth (09-12, RHS) Excess Credit Growth (%) -1% 0% 1% 2% 3% 4% 5% 6% 7% 8% Jan-03 Jul-03 Jan-04 Jul-04 Jan-05 Jul-05 Jan-06 Jul-06 Jan-07 Jul-07 Jan-08 Jul-08 Jan-09 Jul-09 Jan-10 Jul-10 Jan-11 Jul-11 Jan-12 Jul-12 Jan-13 Jul-13 ASEAN Consensus Estimates GDP (yoy) 2004 GDP 2005 GDP 2006 GDP 2007 GDP 2008 GDP 2009 GDP 2010 GDP 2011 GDP 2012 GDP 2013 GDP 2014 GDP 19% 5yr z-score: 0.84 21% 5yr z-score: 0.67 -20% -10% 0% 10% 20% 30% 40% Jul-06 Nov-06 Mar-07 Jul-07 Nov-07 Mar-08 Jul-08 Nov-08 Mar-09 Jul-09 Nov-09 Mar-10 Jul-10 Nov-10 Mar-11 Jul-11 Nov-11 Mar-12 Jul-12 Nov-12 Mar-13 Jul-13 Nov-13 Valuation Prem/ Disc (ASEAN vs. MXAPJ) Fwd PE Prem/ Disc Trailing PB Prem/ Disc
  • 23. November 21, 2013 Asia Pacific Goldman Sachs Global Investment Research 23 What will re-rate Chinese banks?  We believe specific policies will be the key re-rating catalysts for Chinese banks in 2014. We see upside risks to the sector as reform momentum gathers pace.  Chinese banks are the fourth largest country-sector in MXAPJ, and are trading at very low absolute valuations (5.1X 2014E P/E, 0.9X P/B), meaning decisions in this area will have outsized impact on relative performance.  Chinese banks’ valuations have significantly de-rated relative to their global and regional peers, and are now implying a 6.1% NPL ratio, versus the 1% reported in 3Q. These suggest a great deal of banks specific risk is already priced in.  However, we do not think cyclical growth on its own or liquidity improvement would be enough to re-rate Chinese banks (or prompt outperformance) because they have become less sensitive to macro factors.  In that vein, we think bank-specific policies including a timetable of interest rate liberalization (remove overhang), more clarity on preferred share issuance scheme (improve capital structure), more transparency on accounting and classifying liability and NPLs (estimate potential loss), and potential measures regarding bad debt management (NPL carve out, loss absorption, etc.) will be important share price drivers. Exhibit 42: China banks are the 4th largest country sector in AeJ, and are trading at very low absolute valuations Exhibit 43: Current market prices are implying 6.1% NPL for Chinese banks Source: DataStream, FactSet, Goldman Sachs Global Investment Research Source: DataStream, FactSet, Goldman Sachs Global Investment Research Exhibit 44: Chinese banks have de-rated relative to global peers Exhibit 45: Chinese banks have become less sensitive to macro factors Source: DataStream, FactSet, Goldman Sachs Global Investment Research Source: DataStream, FactSet, Goldman Sachs Global Investment Research 9% 6% 5% 4% 4% 3% 3% 2% 2% 1% 13.8 14.0 7.3 5.1 12.0 12.6 8.9 10.9 18.4 14.0 4.0 6.0 8.0 10.0 12.0 14.0 16.0 18.0 20.0 0% 1% 2% 3% 4% 5% 6% 7% 8% 9% 10% AUBanks TWTech KRTech AUMetal HKProperty CNEnergy CNTelcos HKInsurance INBanks MXAPJ Weighting (%) 2014E PE (X) ChinaBanks 6.3 5.7 6.4 8.4 6.0 5.8 5.5 6.7 8.2 6.6 5.8 6.7 8.8 6.16.1 5.2 6.0 5.6 5.85.8 4.8 6.2 5.35.4 0 1 2 3 4 5 6 7 8 9 ICBC(H) BOC(H) CCB(H) ABC(H) BoCom(H) CMB(H) CNCB(H) Minsheng(H) CQRCB ICBC(A) BOC(A) CCB(A) ABC(A) BoCom(A) CMB(A) CNCB(A) Minsheng(A) SPDB Industrial HuaXia BONB BOBJ BONJ CEB Formation covered by general provision Implied new formation Buy-rated stocks 2013 NPL ratio Average = 6.1 -29% 5yr z-score: -1.34 -9% 5yr z-score: -1.68 -19% 5yr z-score: -1.00 -80% -60% -40% -20% 0% 20% 40% 60% 80% 100% 120% 140% 160% Jul-05 Dec-05 May-06 Oct-06 Mar-07 Aug-07 Jan-08 Jun-08 Nov-08 Apr-09 Sep-09 Feb-10 Jul-10 Dec-10 May-11 Oct-11 Mar-12 Aug-12 Jan-13 Jun-13 Nov-13 Trailing PB Prem/ Disc (%) CN Banks vs. MXAPJ Banks CN Banks vs. World Banks CN Banks vs. EM Banks -6 -4 -2 0 2 4 6 Sep-08 Dec-08 Mar-09 Jun-09 Sep-09 Dec-09 Mar-10 Jun-10 Sep-10 Dec-10 Mar-11 Jun-11 Sep-11 Dec-11 Mar-12 Jun-12 Sep-12 Dec-12 Mar-13 Jun-13 Sep-13 Rolling 3Y t-Stat of CN CAI, FCI on MXCN banks return CN FCI CN CAI Insignificant zone (Critical value = +/- 1.96)
  • 24. November 21, 2013 Asia Pacific Goldman Sachs Global Investment Research 24 China internet and Macau gaming: Buy, hold, or sell?  We recommend buying on any major corrections, China internet in particular.  Macau gaming and China internet (HK- and US-listed) have been the favorite ‘consensus buy’ sectors in the HK/China universe. They boast strong fundamental investment case; they are liquid; and have performed well enough that many investors can’t afford to go underweight.  Top-down, we think these two sectors are not yet at the levels where investors should be too concerned about risks of overshooting, because: o Their past 3Y returns don’t look stretched relative to historical boom-bust episodes; o Their performance has been supported by fundamental earnings growth (and upgrades), which appears healthier than past cases where valuation was a key return driver.  Bottom-up, while our analysts (and consensus) continue to forecast strong but declining EPS growth for these two sectors, the growth is mostly contributed by top-line as opposed to margin expansion (China internet in particular), suggesting that their optimistic EPS growth forecasts are not aided by stretching their profitability assumptions. Exhibit 46: Macau gaming and China internet have been the two best performing sectors in the past few years Exhibit 47: Their performance does not look stretched relative to some historical episodes Source: DataStream, FactSet, Goldman Sachs Global Investment Research Source: DataStream, FactSet, Goldman Sachs Global Investment Research Exhibit 48: The rally has been backed by fundamentals Exhibit 49: EPS growth is not driven by stretching margins Source: DataStream, FactSet, Goldman Sachs Global Investment Research Source: DataStream, FactSet, Goldman Sachs Global Investment Research 66% 64% 66% 43% 67% 60% 21% 56% 59% 45% 52% 55% 62% 51% 61% 51% 40% 20% 30% 40% 50% 60% 70% -100% 0% 100% 200% 300% 400% 500% 600% 700% Macau(626%) CNInternet(244%) HKTelcos(82%) HKDisc.(56%) HKIndustrials(51%) CNUtilities(47%) HKUtilities(33%) HKFin.(19%) CNTelcos(10%) CNStap.(-1%) CNEnergy(-4%) CNHealthcare(-16%) CNFin.(-18%) CNDisc.(-21%) CNIndustrials(-26%) CNMaterials(-43%) HKI.T.(-47%) Return since 2010 (%) Return since 2010 % of buy rating (RHS) I/B/E/S Consensus Rating (%) 0 100 200 300 400 500 600 700 800 900 T=0 T=7 T=14 T=21 T=28 T=35 T=42 T=49 T=56 T=63 T=70 T=77 T=84 T=91 T=98 T=105 T=112 T=119 T=126 T=133 T=140 T=147 T=154 Rebased Performance Index KR Telcos (TMT) KR ID (China 03-07) CN Property (China 03-07) CN Materials (China 03-07) Macau Gaming TW I.T. (TMT) JP Property (1980s) CH Software (# of Weeks) 3 years before the peak 63% 472% 603% 475% 630% 244% 182% -19% 294% 84% 185% 136% -18% -13% 82% 178% 519% 290% 494% 262% 195% -100% 0% 100% 200% 300% 400% 500% 600% 700% -100% 0% 100% 200% 300% 400% 500% 600% 700% JapanProperty KRTelcos+TWI.T. ChinaRealEstate ChinaMaterials KoreaIndustrials MacauGaming ChinaSoftware % Chg in country sectors rally (since 3 years before the peak) Price Chg Earnings Chg Valuation Chg -30% -20% -10% 0% 10% 20% 30% 40% 50% 60% 70% 80% 2011 2012 2013E 2014E 2015E EPSg NM SPSg Macau Gaming 2011 2012 2013E 2014E 2015E China Internet
  • 25. November 21, 2013 Asia Pacific Goldman Sachs Global Investment Research 25 How should investors position in the tech sector?  While we think internet and software (a.k.a new technology) will continue to do well in 2014, we expect ‘Old tech’ to perform better than in 2013.  Tech is the 2nd largest sector in MXAPJ, accounting for 14.5% of the regional index weighting of which 54% comes from Samsung and TSMC combined.  Regional tech has performed reasonably well so far in 2013 but with noticeable divergence: ‘New tech’ has significantly outperformed ‘Old tech’, which primarily focuses on semi and hardware design and manufacturing.  As noted in several sections in this report, we expect ‘New tech’ to continue to perform well, backed by secular growth drivers. However, we think ‘Old tech’ will likely have a better year in absolute return terms, because: o Valuation has now reached arguably attractive levels in both absolute and relative terms; o Our analysts remain fundamentally bullish on Samsung (Buy) and TSMC (Buy, on Conviction List), the largest and 5th largest stocks in MXAPJ; o Thematically, ‘Old tech’ appears more favorably skewed towards a DM recovery story given their revenue exposures there. Exhibit 50: ‘New tech’ has generated significant alpha for investors in 2013... Exhibit 51: ...but ‘Old tech’ still remains important for absolute returns given its heavy index weighting Source: DataStream, FactSet, Goldman Sachs Global Investment Research Source: DataStream, FactSet, Goldman Sachs Global Investment Research Exhibit 52: The valuation gaps between ‘New’ and ‘Old’ are quite substantial Exhibit 53: ‘Old tech’ seems better positioned for a DM recovery theme Source: DataStream, FactSet, Goldman Sachs Global Investment Research Source: DataStream, FactSet, Goldman Sachs Global Investment Research 78% 68% 65% 31% 8% 7% 1% -11% -12% -40% -20% 0% 20% 40% 60% 80% KRSoftware CNSoftware CNSemi INSoftware MXAPJTech TWSemi KRSemi TWComp.H/W KRComp.H/W Ytd Return (%, USD) KR Semi 33% KR Software 4% KR Comp. H/W 3% TW Semi 23% TW Comp. H/W 16% CN Software 10% CN Comp. H/W 2% CN Semi 0% IN Software 8% Korea 39% Taiwan 39% China 12% India 8% Weighting in MXAPJTech (%) 22.5 10yr z-score: 0.81 12.1 10yr z-score: -0.19 8.4 10yr z-score: -1.05 5.0 7.0 9.0 11.0 13.0 15.0 17.0 19.0 21.0 23.0 25.0 Jan-10 Mar-10 May-10 Jul-10 Sep-10 Nov-10 Jan-11 Mar-11 May-11 Jul-11 Sep-11 Nov-11 Jan-12 Mar-12 May-12 Jul-12 Sep-12 Nov-12 Jan-13 Mar-13 May-13 Jul-13 Sep-13 Nov-13 Fwd PE (X) MXAPJ Software & Services MXAPJ Technology H/W MXAPJ Semi 99% 97% 75% 61% 51% 49% 42% 16% 8% 13% 22% 38% 21% 53% 9% 17% 17% 9% 20% 24% 9% 9% 10% 4% 17% 8% 0% 10% 20% 30% 40% 50% 60% 70% 80% 90% 100% CN Software KR Software KR Comp. H/W CN Comp. H/W TW Comp. H/W TW Semi KR Semi IN Software Sales exposure as % of total Others EU US Asia
  • 26. November 21, 2013 Asia Pacific Goldman Sachs Global Investment Research 26 Performance context: Intra-regional differentiation at play Year-to-date, the MXAPJ index essentially posted flat returns, but beneath the headline, the region had a tough summer followed by a sharp rebound. With excessive volatility coupled with frequent market rotations, the risk-reward on AEJ equities this year has been less attractive compared to DM equities or Asian currencies. We highlight various themes that were in play in 2013 which inform our views and implementation ideas for next year:  A difficult “flat” year with less attractive risk-reward. MXAPJ has essentially posted flat returns ytd, but beneath the surface the region has witnessed a roller- coaster ride with four rallies and four pullbacks. Looking over the past 26 years of history, the ytd returns for MXAPJ are well below historical averages (at 36th percentile in absolute terms and at 20th percentile relative to DM equities). To capture the excessive volatility, we compare AEJ with DM equities and currencies on a risk-adjusted return basis (as measured by returns / realized vol) and note that DM equities and Asian FX have had much better risk-adjusted returns than AEJ equities.  Frequent market rotations: country macro in focus. Market leadership continued to rotate frequently in 2013, continuing the pattern in 2012. Korea fell almost 15% during 1H13, underperforming MXAPJ, but bounced back 15% in 3Q posting the best returns in the region. Similarly ASEAN retained its leadership in 1H13 but underperformed in 2H13 on concerns over Fed tapering. Sector leadership saw relatively less intense rotations. Looking at the dispersion of returns (as measured by standard deviation) also shows that country dispersion was higher in 2013.  Currency weakness impacting total equity returns. Most Asian currencies weakened in 2013 impacting the total returns in dollar terms (particularly for South Asian markets). For example, currency depreciation subtracted 13% and 17% from India and Indonesia, respectively, in US dollar total return terms and 5% return from the overall region. We have previously noted that FX changes make up on average 25% of short and longer-term total returns and expect currency to play an important role next year as well.  Better stock picking opportunities. Average stock correlations, which had risen during the May-June sell-off, have reduced meaningfully suggesting more opportunities for bottom-up stock picking.  Several intra-regional themes at play. The excessive volatility coupled with frequent market rotations made navigating the investment environment tougher this year. But several intra-regional trends were still at play, as summarized below: o North Asia outperformed ASEAN. We argued at the beginning of the year that ASEAN would underperform the region in 2013 after 7 years of consistent outperformance. Although ASEAN continued to do well early in the year, it came under intense pressure during the summer. The North Asian markets also rallied strongly post summer and outperformed South Asia (India, ASEAN) by 23% from their July low. o Thematic alpha opportunities. Notwithstanding frequent rotation, several macro themes, as embodied in our “macro slice” framework, priced consistently in 2013. Global Cyclicals consistently outperformed given tailwinds of improving DM growth and weaker Asian currencies. Asset Sensitive Financials and Commodity Cyclicals remained under pressure given headwinds of Fed tapering and slowing China growth.
  • 27. November 21, 2013 Asia Pacific Goldman Sachs Global Investment Research 27 Exhibit 54: DM equities have had much better risk-adjusted returns than MXAPJ in 2013 Source: Bloomberg, FactSet, MSCI, Goldman Sachs Global Investment Research Exhibit 55: Most Asian currencies have also had better risk-adjusted returns than AEJ equities Source: Bloomberg, FactSet, MSCI, Goldman Sachs Global Investment Research Exhibit 56: Stock correlations have reduced, suggesting “alpha” opportunities Exhibit 57: Correlation of market returns is still quite negative, indicating frequent rotation Source: FactSet, MSCI, Goldman Sachs Global Investment Research Source: FactSet, MSCI, Goldman Sachs Global Investment Research Price returns Realized vol 2013 Ytd %tile vs. Vol-adj returns %tile vs. returns 26-yr history (Returns / vol) 26-yr history S&P 500 ($) SPX 26.1% 76% 10.0 2.61 96% Topix (¥) TPX 44.4% 96% 23.3 1.91 84% Stoxx Europe 600 (£) SXXP 15.5% 60% 11.5 1.35 64% MSCI Asia-Pac ex-Japan ($) MXAPJ 2.5% 36% 12.6 0.20 36% MSCI Emerging Market ($) MXEF -3.0% 40% 13.1 -0.23 40% MXAPJ vs. MSCI Dev. World ($) MXAPJ / MXWO -15.6% 20% 11.0 -1.42 4% Risk-adjusted returns Equities Ticker 2013 Ytd rlzd vol (%) 0.00 0.20 0.40 0.60 0.80 1.00 1.20 1.40 1.60 IDR Australia INR JPY AUD PHP Malaysia MYR TWD THB SGD Philippines Taiwan Hong Kong India Singapore China EUR Thailand KRW MXAPJ HKD Korea Indonesia Equities FX 3.6 Absolute Risk-adjusted returns (Returns / realized vol, YTD) 20% 30% 40% 50% 60% 70% 80% Nov-08 May-09 Nov-09 May-10 Nov-10 May-11 Nov-11 May-12 Nov-12 May-13 Nov-13 Avg Stock Correlation (3-mo correlation with MXAPJ) "Macro" Trading "Micro" Trading -0.50 -0.25 0.00 0.25 0.50 May-96 Mar-97 Jan-98 Nov-98 Sep-99 Jul-00 May-01 Mar-02 Jan-03 Nov-03 Sep-04 Jul-05 May-06 Mar-07 Jan-08 Nov-08 Sep-09 Jul-10 May-11 Mar-12 Jan-13 Nov-13 Correlation This month's return vs. last month's return (across Asian markets, 12-mo avg) Relative to the past 17 years, 2012 and 2013 are years of extreme rotation
  • 28. November 21, 2013 Asia Pacific Goldman Sachs Global Investment Research 28 Exhibit 58: Market rotation has been more intense than sector rotation Source: FactSet, MSCI, Goldman Sachs Global Investment Research Exhibit 59: Markets have varied more than sectors, indicating country macro was more in focus Exhibit 60: Currency weakness has had a significant impact on MXAPJ market returns in USD terms Source: FactSet, MSCI, Goldman Sachs Global Investment Research Source: FactSet, MSCI, Goldman Sachs Global Investment Research Exhibit 61: North Asian markets have outperformed South Asia Exhibit 62: Global Cyclicals have outperformed Asset sensitive financials Source: FactSet, MSCI Source: Bloomberg, Goldman Sachs Global Investment Research Quarterly Market Rotation (US$ Returns) 1Q13 2Q13 3Q13 4Qtd Australia 8% Taiwan 2% Korea 15% India 7% ASEAN 6% ASEAN -5% China 11% China 6% HK 3% HK -6% Australia 10% Korea 4% Taiwan 0% India -6% HK 8% Australia 4% India -3% China -9% Taiwan 1% ASEAN 3% Korea -4% Korea -10% India -6% HK 3% China -5% Australia -15% ASEAN -6% Taiwan 1% Outperform In-Line Underperform Quarterly Sector Rotation (US$ returns) 1Q13 2Q13 3Q13 4Qtd Healthcare 7% Telcos. 1% Materials 13% Cons. Disc. 6% Utilities 6% Info. Tech. -4% Cons. Disc. 10% Info. Tech. 5% Financials 6% Cons. Disc. -4% Industrials 9% Healthcare 5% Cons. Stap. 4% Healthcare -6% Info. Tech. 7% Materials 5% Info. Tech. 1% Cons. Stap. -7% Energy 7% Financials 5% Cons. Disc. 0% Utilities -8% Financials 5% Energy 4% Industrials -1% Industrials -9% Healthcare 3% Cons. Stap. 3% Telcos. -2% Financials -10% Cons. Stap. 2% Industrials 2% Energy -4% Energy -14% Telcos. 1% Utilities 1% Materials -9% Materials -15% Utilities 1% Telcos. -1% Outperform In-Line Underperform (6.0) (4.0) (2.0) 0.0 2.0 4.0 6.0 8.0 Mar-06 Jul-06 Nov-06 Mar-07 Jul-07 Nov-07 Mar-08 Jul-08 Nov-08 Mar-09 Jul-09 Nov-09 Mar-10 Jul-10 Nov-10 Mar-11 Jul-11 Nov-11 Mar-12 Jul-12 Nov-12 Mar-13 Jul-13 Nov-13 in Local currency in USD Higher COUNTRY dispersion Higher SECTOR dispersion Country LESS Sector Dispersion (Rolling 3-mo return basis) % YTD returns (Local) YTD returns (US$) Australia 17% Hong Kong 8% Philippines 11% Australia 5% Malaysia 8% Philippines 4% Hong Kong 8% Korea 3% MXAPJ 7% Malaysia 3% India 5% Taiwan 3% Taiwan 4% China 3% Singapore 3% MXAPJ 2% China 3% Singapore 1% Korea 2% Thailand -4% Thailand -1% India -8% Indonesia -2% Indonesia -19% 85 90 95 100 105 110 Jan-13 Feb-13 Mar-13 Apr-13 May-13 Jun-13 Jul-13 Aug-13 Sep-13 Oct-13 Nov-13 MXAPJ (local, +7% ytd) MXAPJ (US$, +2% ytd) 85 90 95 100 105 110 115 Jan‐13 Feb‐13 Mar‐13 Apr‐13 May‐13 Jun‐13 Jul‐13 Aug‐13 Sep‐13 Oct‐13 Nov‐13 North Asia vs.South Asia (Relative performance, indexed) North Asia = China, Korea and Taiwan ; South Asia = India and ASEAN +23% -9% 90 92 94 96 98 100 102 104 106 108 110 Dec-12 Jan-13 Feb-13 Mar-13 Apr-13 May-13 Jun-13 Jul-13 Aug-13 Sep-13 Oct-13 Nov-13 Global Cyclicals vs. Asset Sensitive Financials (Relative performance, indexed) GSSZMSGC / GSSZMSFA
  • 29. November 21, 2013 Asia Pacific Goldman Sachs Global Investment Research 29 Macro: Return expectations, views, and path Bottom-line: Roughly 10% fundamental-driven returns, event- dependent path and trading strategies  Our 2014 macro forecasts for Asia: Growth to improve moderately (6.1% to 6.4%), inflation to stay in check (3.4% to 3.9%), policy to tighten marginally (+40bps on average across AeJ), and Asian FX to weaken vs. the USD (-3% weighted by GDP). The key growth delta is the macro recovery in DM, and its reinforcing impact on domestic demand in Asia.  Top-down returns expectation: Close to 10% fundamental upside for MXAPJ (slightly different from our official forecast); likely range between 470 and 580, +/- 10% from our end-14 MXAPJ target of 525.  An eventful policy and political year: QE tapering in the US (March 2014), growth rebalancing and reform in China, potential further easing in Japan (April 2014), and important elections in Europe and South Asia in mid-2014.  An event-dependent path and intra-year allocation, specifically: 1. Start the year with a positive tilt to China on a favorable yoy growth trend and liquidity combo and potential carry-through of positive reform momentum from 4Q13, and stay conservative on ASEAN due mainly to the looming tapering concerns; 2. Look to accumulate Korea, especially on weakness, around the BoJ meeting in April to trade a better external demand picture in 2H14 and 2015; 3. Watch for buying opportunities for Indonesia, and possibly India around summer when political visibility emerges and cyclical adjustments mature there; 4. Turn aggressive on broad market beta in 2H14, notably our three earnings- related ideas, for a potential acceleration in earnings growth in 2015. Baseline views for 2014: Growth to improve moderately, inflation to stay in check, and policy to tighten marginally  Our economists expect the overall growth picture for AEJ to improve next year, from 6.1% in 2013 to 6.4%, in line with current consensus;  The driver of growth would be a meaningful recovery in external demand, and the resulting positive spillover to domestic private consumption growth. The external demand recovery will be led by the US (2.9% in 2014), which may operate close to trend growth, and the Euro area, which may return to expansion (+1.1%) after staying in recession for two consecutive years (-0.6% for 2012 and -0.4% for 2013);  Inflation is likely to edge higher to 3.9% for 2014, from 3.4% in 2013 as output gaps close;  Liquidity normalization may continue given our expected QE tapering in the US, and forecasted policy rate hikes across Asian economies;  Except for SGD and PHP, our economists see Asian FX generally trading weaker against the USD as the US begins to normalize its policy in 2014. Details of our economists’ forecast on growth, inflation, rates, and FX are shown in Appendix 1.
  • 30. November 21, 2013 Asia Pacific Goldman Sachs Global Investment Research 30 Exhibit 63: The growth and inflation configuration for AEJ is likely to be similar to 2013 Exhibit 64: Our economists expect a moderate pickup in growth, in line with consensus expectation Source: DataStream, FactSet, Goldman Sachs Global Investment Research Source: DataStream, FactSet, Goldman Sachs Global Investment Research Exhibit 65: Growth contribution will likely come from net exports and the ripple effects on local consumption Exhibit 66: Liquidity conditions may normalize in Asia, partly driven by QE tapering in the US Note: The forecasted paths are calculated based on our interest rate forecasts Source: DataStream, FactSet, Goldman Sachs Global Investment Research Source: DataStream, FactSet, Goldman Sachs Global Investment Research Translating our macro expectations into equity returns  Approach 1: Top-down regression model points to 8% upside for the region.  While we fully acknowledge the drawbacks of basing our views on regression models, it helps distill the macro-to-market transmission mechanisms and locate a reasonable range of where fair value may lie relative to macro fundamentals, in our view.  Specifically, we employ two models—level and yoy return for MXAPJ—to estimate fundamental upside for the region. Our models, which incorporate GDP growth, inflation, financial conditions (US and Asia), and nominal earnings in Asia, show 8% potential upside for the MXAPJ index in 2014 (USD), based on our end-14 forecasts on these variables. 2003 2004 2005 2006 2007 2008 2009 2010 2011 2012 2013E 2014E 5 6 7 8 9 10 11 0 1 2 3 4 5 6 7 AnnualrealGDP(yoy) Annual CPI (yoy) Year GS Consensus GS Consensus Dec-03 6.4% 7.3% 6.5% 90 bp 10 bp Dec-04 8.2% 6.8% 6.8% -140 bp -140 bp Dec-05 7.7% 7.6% 7.1% -10 bp -60 bp Dec-06 8.7% 8.2% 7.6% -50 bp -110 bp Dec-07 9.5% 8.5% 8.8% -100 bp -70 bp Dec-08 7.0% 5.5% 6.3% -150 bp -70 bp Dec-09 5.7% 8.7% 7.6% 300 bp 190 bp Dec-10 9.1% 8.4% 7.8% -70 bp -130 bp Dec-11 7.4% 7.1% 7.2% -30 bp -20 bp Dec-12 6.2% 6.9% 6.6% 70 bp 40 bp Dec-13 6.1% 6.4% 6.4% 30 bp 30 bp Change in GDP growth expectationsGS Current year expected GDP (yoy) Next year GDP growth (yoy) Asia ex-Japan 2.5 2.6 2.8 2.9 2.6 2.7 1.0 1.7 0.8 0.9 1.0 1.2 0.6 0.4 0.4 0.4 2.6 2.5 3.9 3.4 1.4 1.4 0.4 1.0 0.3 0.4 0.0 0.2 0.2 0.7 1.0 0.7 -1.0 0.0 1.0 2.0 3.0 4.0 5.0 6.0 7.0 8.0 2013E 2014E 2013E 2014E 2013E 2014E 2013E 2014E AeJ China South Asia North Asia Real GDP (yoy) Net Exports Total Fixed Investment Public consumption Private Consumption 99 (1% yoy) 102 (0.7% yoy) 96 98 100 102 Jan-09 Jun-09 Nov-09 Apr-10 Sep-10 Feb-11 Jul-11 Dec-11 May- 12 Oct-12 Mar-13 Aug-13 Jan-14 Jun-14 Nov-14 FCI Ex-Equity (Yr 1999 = 100) US FCI AeJ FCI Financial tightening Financial loosening
  • 31. November 21, 2013 Asia Pacific Goldman Sachs Global Investment Research 31  Approach 2: Earnings growth/valuation sensitivity suggests the fair value of MXAPJ may range from 470 to 580.  We complement our top-down return forecasts with bottom-up earnings and valuation analysis.  A combination of our 14/15 EPS growth forecast of 10%/14% and a target forward P/E multiple of 12.0X in Dec 2014 suggests MXAPJ should trade at 525 by end-14, 10% upside from current levels.  To account for forecasting errors (EPS growth) and potential valuation over-/under- shoots (+/- 0.5 standard deviation), we believe the reasonable fair-value range for MXAPJ should be bounded between 470 and 580, about 10% downside/upside from our base-case return. This is admittedly a wide range but not an implausible one given the volatility that we have seen so far this year. Exhibit 67: Our top-down model for MXAPJ suggests around 8% for the regional market Source: FactSet, MSCI, Bloomberg Exhibit 68: A combination of our EPS growth forecast and target P/E multiple suggests a reasonable range of 470 to 580 Source: FactSet, MSCI, Bloomberg 514 0 100 200 300 400 500 600 Dec-95 Dec-96 Dec-97 Dec-98 Dec-99 Dec-00 Dec-01 Dec-02 Dec-03 Dec-04 Dec-05 Dec-06 Dec-07 Dec-08 Dec-09 Dec-10 Dec-11 Dec-12 Dec-13 Dec-14 MXAPJ Index Level MXAPJ Fitted line Dependent Variable = MXAPJ price level Format Variables Coefficients t-Stat Assumption Level Intercept -59 -4.8 - yoy Regional GDP 1866 12.5 6.4% yoy Regional CPI 837 4.2 3.9% yoy Regional FCI -3293 -8.1 0.7% level nominal tEPS 11 29.5 10.0% R^2 89% 2014 expected annual return 8% Format Variables Coefficients t-Stat Assumptions Level Intercept -0.6 -12.9 - yoy Regional GDP 10.2 16.5 6.4% yoy Regional CPI 0.9 1.2 3.9% yoypp UST10Y 11.7 7.6 0.5% yoy Regional FCI -8.6 -5.9 0.7% R^2 75% 2014 expected annual return 7% 7% -80% -60% -40% -20% 0% 20% 40% 60% 80% 100% Dec-95 Dec-96 Dec-97 Dec-98 Dec-99 Dec-00 Dec-01 Dec-02 Dec-03 Dec-04 Dec-05 Dec-06 Dec-07 Dec-08 Dec-09 Dec-10 Dec-11 Dec-12 Dec-13 Dec-14 MXAPJ (USD, yoy) MXAPJ Fitted line Dependent Variable = MXAPJ yoy return Avg. 2014 expected annual return = 8% Estimate - 5% Estimate + 5% -2.5% 0.0% 2.5% 5.0% 7.5% 10.0% 12.5% 15.0% 17.5% 20.0% 22.5% 10.8 417 427 438 449 459 470 481 491 502 513 523 11.0 426 437 448 459 470 481 492 503 514 525 536 Target - 0.5SD 11.3 436 447 458 470 481 492 503 514 525 537 548 11.5 446 457 469 480 491 503 514 526 537 549 560 11.8 455 467 479 490 502 514 525 537 549 560 572 12.0 465 477 489 501 513 525 537 549 560 572 584 12.3 475 487 499 511 523 536 548 560 572 584 596 12.5 484 497 509 522 534 547 559 571 584 596 609 Target + 0.5SD 12.8 494 507 519 532 545 557 570 583 596 608 621 13.0 504 517 530 543 556 568 581 594 607 620 633 13.3 514 527 540 553 566 579 593 606 619 632 645 2014 EPS Growth (%) TargetForwardPEMultiple(X) GS 2014E EPS Growth 2014 year-end target Fwd PE multiple
  • 32. November 21, 2013 Asia Pacific Goldman Sachs Global Investment Research 32 Framing views and path around macro and political events We anticipate an eventful year in terms of macro, political, and policy developments globally: QE tapering in the world’s largest economy, growth rebalancing and reform in the 2nd largest (China), a potential increase of QE in the 3rd largest (Japan), and important elections in select parts of Europe and Asia where the results may have significant implications to the rest of their regions, and even to the global markets. In this vein, while our macro forecasts, which drive our equity return forecast for Asia, reflect our best estimate of how fundamentals may evolve over the course of 2014, these event uncertainties imply the variance around our base case would likely be high. Additionally, the rapid advancement and adoption of technology, globalization, and high equity valuations (average) will likely further complicate the reaction functions in the equity market than would normally be implied by simple historical analysis. Below, we overlay our fundamental return expectations with our view on the aforementioned macro and political events, aiming to form a guide as to how and when the market may trade these events, and calibrate our intra-year market allocations and strategies accordingly. Exhibit 69: Our hypothetical path of return: A slow start, followed by a strong finish Source: Goldman Sachs Global Investment Research. 1) QE tapering in March 2014: A less dramatic response than in summer 2013  Our expectations: The Fed to begin tapering in March 2014 (from US$85bn/month to US$75bn), and exit QE by the end of 2014. However, its strong commitment to forward guidance should keep financial conditions at very accommodative levels, especially at the front-end of the yield curve. Our economists expect the 10Y UST to rise to 3.25% by end-14.  Non-linear and specific impact to Asian equities: Equities that are favorably exposed to improving global demand but less affected by rising rates (interest cost, valuation, FX, and property), and vice versa. By markets and sectors, they include Korea, autos, and select financials on the long side, and Australia, Philippines, HK, utilities, telecoms, and property on the short side (Exhibit 70). 470 480 490 500 510 520 530 Dec-13 Jan-14 Feb-14 Mar-14 Apr-14 May-14 Jun-14 Jul-14 Aug-14 Sep-14 Oct-14 Nov-14 Dec-14 MXAPJ Index Mar 2014 1)US QE Tapering 2)China policy momentum carries over 1Q Apr 2014 BOJ Monetary Policy Meeting (Potential stimulus announcement) 2H2014 2015E EPS growth accelerates 2014E MXAPJ return +10% May-July 2014 Indonesia, India, UK, Spain, Portugal, Greece Election 1Q14 2Q14 3Q14
  • 33. November 21, 2013 Asia Pacific Goldman Sachs Global Investment Research 33  How will the market react when the Fed tapers in March? We believe the reaction will be less dramatic than in summer 2013 when MXAPJ plunged 16% from peak to trough, given: a) the meaningful macro and asset market adjustments that have been made in several CA deficit economies; b) US rates are less undervalued from a term-premium standpoint and relative to our Sudoku model, and; c) market participants are arguably better prepared, mentally and in terms of positioning. That said, we still believe the expectation of QE tapering will keep Asia, notably South Asia, under pressure until this overhang is removed. Exhibit 70: QE tapering framework: We think the impact on Asian equities would be non-linear and specific Source: Goldman Sachs Global Investment Research Exhibit 71: We expect current accounts in South Asia to improve in 2014 Exhibit 72: US rates are currently more in line with fundamentals Source: DataStream, FactSet, Goldman Sachs Global Investment Research Source: DataStream, FactSet, Goldman Sachs Global Investment Research Exhibit 73: Asian financial assets appear less vulnerable to the QE/liquidity shocks than they were in May Source: Goldman Sachs Global Investment Research Improving growth and rising interest rate Higher Interest rate AU/TH; Utilities/ Transport. Utilities/ Telecoms Philippines Multinational banks and regional insurers Property Foreign Exchange Growth recovery (Better demand outlook) Korea, Taiwan Autos/ Industrials Cost of funding Yield compression Valuation compression Yield curve shift/ steepening Exporters Cyclicals Potentially stronger USD Real asset valuation Hong Kong/ Regional property Asian exporters to the US Companies reporting in USD/ CA deficit Potential Beneficiaries Potential Losers 16.5 1.0 1.5 1.7 3.0 8.3 -5.1 -3.1 -1.4 0.8 2.0 -4.4 -4.0 -3.9 -2.9-2.2 -4.9 -3.1 -3.8 -2.9 3.84 2.49 2.61 2.75 3.25 2.0 2.2 2.4 2.6 2.8 3.0 3.2 3.4 3.6 3.8 4.0 -6 -3 0 3 6 9 12 15 18 2009 2013-2Q 2013E-3Q 2013E-4Q 2014E Current Account Deficit (As % of GDP) Malaysia Thailand Indonesia India UST10Y (RHS) UST10Y Yield 1.0 1.5 2.0 2.5 3.0 3.5 4.0 4.5 2009 2010 2011 2012 2013 2014 2015 2016 (%) +/- 1 std dev. US 10-yr yield Sudoku 'Fair' Value Current Market Pricing Old GS forecast 5% -1%-1% -4%-5%-5% -7% -13% -16%-17% -28% -4% 10% -35% -30% -25% -20% -15% -10% -5% 0% 5% 10% 15% Korea China HongKong Taiwan Australia Malaysia Singapore India Thailand Philippines Indonesia MXAPJ SPX Chg in equities since May peak (USD, %) 3% 1% 0% 0% -2% -6% -6% -6% -8% -13% -15% -4% -16% -12% -8% -4% 0% 4% KRW CNY HKD TWD SGD PHP THB MYR AUD INR IDR DXY Chg in FX since May peak (%) 239 121 75 71 50 46 43 41 39 34 -56 58 -100 -50 0 50 100 150 200 250 300 Indonesia India Australia China Thailand Korea HongKong Singapore Taiwan Malaysia Philippines US Chg in bond yield Since May Peak (bps)
  • 34. November 21, 2013 Asia Pacific Goldman Sachs Global Investment Research 34 2) China: 1H is likely a better trading environment A reasonably favorable growth + liquidity combo in 1H14; reform momentum may continue. Besides improving reform momentum, which is the key argument for our upgrade on China, we suggest starting the year with a positive tilt to China because:  Growth: Our economists project yoy GDP growth momentum to be strong in 1H14, mainly on a favorable base effect, but the sequential trend could be weak due to inventory destocking. Overall, this seems to provide a conducive environment for equity returns in 1H as we note that the market tends to trade yoy growth rather than sequential growth (Exhibit 75).  Liquidity: Liquidity conditions tend to be more accommodative early in the year. As last June’s interbank rate spike and ensuing market sell-off demonstrated, China’s asset markets are sensitive to liquidity conditions, especially given the increase in corporate leverage in recent years. Exhibit 74: China’s yoy and sequential growth momentum is likely to diverge in 1H14 Exhibit 75: Equity markets tend to trade yoy growth more than sequential growth momentum Period of analysis: Since 2007, monthly frequency. The calculation is done with a 1-month lag to take into account the reporting lag of China econ data. Source: DataStream, FactSet, Goldman Sachs Global Investment Research Source: DataStream, FactSet, Goldman Sachs Global Investment Research Exhibit 76: Liquidity conditions have tended to be more favorable in the early part of the year in China Exhibit 77: Reform may bode well for the economy, but the fundamental impact on the equity market is likely to be mixed Source: DataStream, FactSet, Goldman Sachs Global Investment Research Source: DataStream, FactSet, Goldman Sachs Global Investment Research 7.3 7.4 7.5 7.6 7.7 7.8 7.9 8 8.1 8.2 5.0 5.5 6.0 6.5 7.0 7.5 8.0 8.5 9.0 9.5 10.0 2012-1Q 2012-2Q 2012-3Q 2012-4Q 2013-1Q 2013-2Q 2013-3Q 2013E-4Q 2014E-1Q 2014E-2Q 2014E-3Q 2014E-4Q China GDP (qoq. Ann.) GDP (qoq. Ann.) GDP (yoy, RHS) China GDP (%) -10.0 -5.0 0.0 5.0 10.0 15.0 20.0 APJ China HK India Indonesia Korea Malaysia Philippines Singapore Taiwan Thailand Australia yoy +, seq + yoy +, seq - yoy -, seq + yoy -, seq - 308.8 -129.0 403.1 98.6 -2.5 117.4 -269.7 -60.5 12.9 -307.1 -162.3 -36.5 -400 -300 -200 -100 0 100 200 300 400 500 Jan Feb Mar Apr May Jun Jul Aug Sep Oct Nov Dec Average difference in NSA.TSF and SA.TSF since 2002 (RMBbn) Better liquidity conditions in 1Q 17% 17% 13% 9% 16% 16% 25% 40% 28% 18% 0% 10% 20% 30% 40% 50% 60% 70% 80% 90% 100% Market cap weighted 2013E earnings weighted Impact of Policy Reforms on MXCN Sectors (%) Others Negative (Banks) Negative Neutral Positive
  • 35. November 21, 2013 Asia Pacific Goldman Sachs Global Investment Research 35 3) Abenomics: Limited impact on AEJ’s fundamentals, more manageable headwinds to Korea this time around  Abe’s first arrow set to be loosed again. Our economists expect the BoJ to step up its monetary easing effort to offset the negative impacts of the consumption tax hike in April and to boost inflation which is far short of its 2% target. They believe the monetary policy easing is likely to be the most important driver for USD/JPY (JPY to weaken), and continue to expect USDJPY to rise to 107 in 12 months.  Muted fundamental impact on AEJ so far. At the macro level, the relationships between Japan’s FCI and AEJ’s have been weak, suggesting limited financial/liquidity spillover to the region from Abenomics so far (Exhibit 79). In terms of real activity, Korean exports (nominal and relative to Japan’s exports), which have been widely regarded as the major loser when JPY depreciates, have posted record numbers in the latest October print, supporting our strong and long- held view that Korean exports’ FX sensitivity is much lower than investors have generally perceived.  Potential headwinds to Korea in March/April, but more manageable than in 1H13. However, investors’ perception/concern remains entrenched: Korea underperformed MXAPJ by 8pp in 1H13 when USDJPY and TPX rallied 16% and 28%. Looking ahead to the April BoJ meeting, we believe Korea will be less impacted, mainly because: a) the extent to which the JPY may depreciate should be much smaller than when Abenomics was first announced; and, b) investors should be less concerned about Korea’s deteriorating FX competitiveness by then given the resilient export performance since September 2012. We would take any JPY-created market weakness as a buying opportunity to position for global growth acceleration in the next two years. Exhibit 78: Our economists expect the BoJ to announce further easing measures in April Source: FactSet, Goldman Sachs Global Investment Research. Jan 1 NISA initiation Mid Jan. Ordinary Diet Session begins (FY2014 budget, FY2013 supplementary budget bills deliberation) Late Jan. - Feb. Earnings results for 3Q13/14 Jan. 21-22 Jan. 21-22 BOJ Monetary Policy Meeting (Interim assessment on the BOJ outlook report) Feb. 22-23 G20 Finance minister & central bank governors meeting (Sydney) Feb-Mar Annual spring wage negotiation End Mar FY2014 budget established Apr 1 Consumption tax rate hike from 5% to 8% Apr 30 BOJ Monetary Policy Meeting (Outlook Report) - Our Econ team expected that BOJ will remain under pressure to provide additional easing to mitigate the impact of the tax hike. If economic conditions deteriorate versus BOJ’s current scenario, our econ team believes BOJ will make additional easing moves by purchasing ETFs and other risking assets. May 20-21 BOJ Monetary Policy Meeting Jun 4-5 G8 Summit Meeting (Russia) Jun 12-13 BOJ Monetary Policy Meeting During Jun Public works from the October 2013 economic package starts to kick in Mid Nov 2014 Q3 GDP (Important for final devision of 2nd consumption tax rate hike, from Oct 2015) Key Events in 2014
  • 36. November 21, 2013 Asia Pacific Goldman Sachs Global Investment Research 36 Exhibit 79: Japan’s financial conditions do not seem to have significant spillover impact on AEJ Exhibit 80: Korea’s exports do not seem severely impacted by a weakening JPY Source: DataStream, FactSet, Goldman Sachs Global Investment Research Source: DataStream, FactSet, Goldman Sachs Global Investment Research Exhibit 81: Korea has traded more negatively than what history would suggest when JPY depreciates Exhibit 82: We expect JPY to weaken further, but the magnitude should be moderate Source: DataStream, FactSet, Goldman Sachs Global Investment Research Source: DataStream, FactSet, Goldman Sachs Global Investment Research 4) Elections in South Asia and Europe While we do not take a view on the outcome of these elections, we believe they may be market-moving events with fundamental implications in some cases, and investors should monitor developments for better risk management and more effective tactical trading. In this vein, we have compiled a detailed timetable of policies and events that may have significant implications for Asia in the Appendix. We believe these events include the parliamentary and presidential elections in India and Indonesia, and a number of parliamentary elections in the peripheral European economies which may have spillover effects to specific areas (e.g. Europe-exposed stocks) and even to the global markets. 89 91 93 95 97 99 101 103 105 107 Jan-05 Jun-05 Nov-05 Apr-06 Sep-06 Feb-07 Jul-07 Dec-07 May-08 Oct-08 Mar-09 Aug-09 Jan-10 Jun-10 Nov-10 Apr-11 Sep-11 Feb-12 Jul-12 Dec-12 May-13 Oct-13 Financial Condition Index (Yr 2005 = 100) Japan Korea Regional FCI Financial tightening Financial loosening 148 11.3 11.0 11.5 12.0 12.5 13.0 13.5 14.0 14.5 15.0 15.590 100 110 120 130 140 150 May-09 Aug-09 Nov-09 Feb-10 May-10 Aug-10 Nov-10 Feb-11 May-11 Aug-11 Nov-11 Feb-12 May-12 Aug-12 Nov-12 Feb-13 May-13 Aug-13 Rebased Index Relative export Index (KR vs JP) KRW/JPY (RHS) JPY/KRW (Reverse) 18% 17% 17% 16% 15% 15% 14% 14% 13% 9% 4% 17% 21% 12% 17% -15% 7% -7% 23% -16% 4% 6% 9% 1% -20% -15% -10% -5% 0% 5% 10% 15% 20% 25% China India HongKong Korea Malaysia Singapore Philippines Australia Indonesia Taiwan Thailand MXAPJ Market Return Correlation with USDJPY 10 Year Since Sep 2012 65 70 75 80 85 90 95 100 105 Jan-12 Jun-12 Nov-12 Apr-13 Sep-13 Feb-14 Jul-14 Dec-14 Rebased Currency Index JPYUSD JPYKRW