SlideShare una empresa de Scribd logo
1 de 13
Descargar para leer sin conexión
UNSATURATED PARTICULATE MATERIALS —PARTICLE-LEVEL STUDIES
                         By Gye Chun Cho1 and J. Carlos Santamarina,2 Member, ASCE

              ABSTRACT: Analyses and experiments are performed to gain further insight into the behavior of unsaturated
              particulate materials, with emphasis on the pendular stage. First, interparticle forces are computed based on
              Laplace’s equation; soil particles are ideally considered spherical or flat to facilitate the identification of the
              most relevant factors that affect unsaturated soil behavior. Second, the small strain stiffness is continuously
              measured on specimens subjected to drying, and changes in stiffness are related to changes in interparticle
              forces; data show important differences with previously published trends based on remolded specimens. Third,
              microscale experiments are performed to assess the strain at menisci failure in multiple deformation modes;
              results indicate that the lower the water content, the lower the strain required to eliminate the effects of capillarity,
              therefore, while capillary forces affect small strain stiffness, they may not contribute to large strain stiffness or
              strength. Finally, the rate of menisci regeneration is studied after a perturbation; stiffness recovery decreases
              with decreasing water content, and full recovery may not be reached when the degree of saturation is low.
              Several phenomena associated with the evolution of capillary forces during drying are identified.


INTRODUCTION                                                                 on heat supply, surrounding vapor pressure, and water avail-
                                                                             ability/supply (Fisher 1923; Gilliland 1938; Oliver and Newitt
   Soils are particulate materials, thus, their properties are gov-          1949; Hillel 1980). In addition, soluble salts in the pore water
erned by interparticle forces. In unsaturated soils, the negative            cause a decrease in the rate of drying because the vapor pres-
pore-water pressure in menisci at particle contacts increases                sure difference between the liquid and the air decreases (Kay-
the interparticle forces, changes the small-strain stiffness, and            yal 1995). The presence of salts adds an osmotic component
alters the soil strength. Furthermore, all forms of conduction               to suction as well.
and diffusion processes depend on the size and connectivity                     As water evaporates from saturated soils during drying, the
of menisci. Such effects are not readily considered within the               air-water interface starts to curve due to pressure difference
framework of classical soil mechanics.                                       between the air and the water phase. The vapor pressure is
   The fundamental phenomena that are related to the behavior                affected by the curvature of the air-water interface as ex-
and effects of water in unsaturated particulate materials are                pressed in Kelvin’s equation (Defay and Prigogine 1966)

                                                                                                                      ͩ         ͪ
reviewed first. Then, analyses and experiments are performed
to gain further insight into the behavior of unsaturated partic-                                         P     M       1    1
                                                                                                 RT ln      = Ϫ Ts        ϩ                (1)
ulate materials with emphasis on particle-level studies. These                                           P0    ␳       r1   r2
studies include microscale analysis of interparticle forces, as-
sessment of small strain stiffness in relation to interparticle              where r1 and r2 = two principal radii at the curved interface
forces, and menisci failure during straining and subsequent                  (Fig. 1); P0 = normal vapor pressure at the free liquid; P =
recovery.                                                                    vapor pressure observed at the curved interface; T = absolute
                                                                             temperature; R = universal (molar) gas constant (i.e, 8.31 N и
                                                                             m/mol и K); M = molecular weight of the liquid; ␳ = liquid
WATER IN UNSATURATED SOILS—EFFECTIVE
                                                                             density; and Ts = surface tension (i.e., 0.0727 N/m at 20ЊC).
STRESS
                                                                                The pressure difference ⌬u between the air pressure ua and
Fundamental Concepts and Relations                                           the water pressure uw also depends on the curvature of the
                                                                             interface characterized by radii r1 and r2 and the surface ten-
   The behavior of water in unsaturated particulate materials                sion Ts (Fig. 1). According to Laplace’s equation

                                                                                                                       ͩ         ͪ
is related to phenomena such as vapor pressure, evaporation,
suction, and cavitation. Molecules at the gas-liquid interface                                                            1    1
                                                                                                ⌬u = (ua Ϫ uw) = Ts          ϩ             (2)
tend to leave the liquid due to thermal agitation. The number                                                             r1   r2
of molecules in the vapor phase increases, until the number of               The pressure difference ⌬u = (ua Ϫ uw) is often referred to as
molecules returning to and leaving the liquid is balanced. At                matric suction. Since the pore air pressure, in general, is
this point, the vapor is said to be saturated, and its pressure is           greater than the pore-water pressure, the matric suction has a
called the saturated vapor pressure (Giancoli 1998). Clearly,                positive value. If the air pressure ua is considered as a refer-
the saturated vapor pressure depends on temperature. That is,                ence (e.g., the atmospheric pressure), the pore-water pressure
the higher the temperature, the higher the kinetic energy that               is negative and its absolute value is the same as the right-hand
molecules have to break away from the liquid into the vapor                  side in (2). In the presence of soluble salts, the total suction
phase. Hence, the pressure at which equilibrium is reached                   (or soil suction) consists of matric suction and osmotic suction.
increases with temperature (the vapor pressure at temperature                   The rupture of the liquid or cavitation may take place when
100ЊC is 100 kPa).                                                           suction increases. The cavitation pressure depends on the ten-
   Water evaporation (or the rate of drying) depends mainly                  sile strength of the liquid. In large volumes (i.e., saturated
   1
    Grad. Student, Civ. and Envir. Engrg., Georgia Inst. of Technol., At-
                                                                             condition), water at 20ЊC cavitates when the water pressure
lanta, GA 30332.                                                             reaches uw Ϸ Ϫ100 kPa. However, water can sustain high
   2
    Prof., Civ. and Envir. Engrg., Georgia Inst. of Technol., Atlanta, GA.   tension under appropriate conditions. This fact has long been
E-mail: carlos@ce.gatech.edu                                                 recognized in soil mechanics (Terzaghi 1925; Hilf 1956;
   Note. Discussion open until June 1, 2001. To extend the closing date      Skempton 1961; Bishop et al. 1975; Fredlund 1991). The the-
one month, a written request must be filed with the ASCE Manager of           oretical tensile strength of water is in the order of thousands
Journals. The manuscript for this paper was submitted for review and
possible publication on February 17, 1999. This paper is part of the Jour-
                                                                             of atmospheres (Fisher 1948; Guan and Fredlund 1997). Water
nal of Geotechnical and Geoenvironmental Engineering, Vol. 127, No.          under tension is in a metastable condition until nucleation oc-
1, January, 2001. ᭧ASCE, ISSN 1090-0241/01/0001-0084–0096/$8.00              curs, i.e., the formation of vapor cavities within the liquid
ϩ $.50 per page. Paper No. 20207.                                            itself or at their boundaries (Trevena 1987). Therefore, cavi-
84 / JOURNAL OF GEOTECHNICAL AND GEOENVIRONMENTAL ENGINEERING / JANUARY 2001
FIG. 1.   Microscale Models—Schematic Representation: (a) Spherical Particles; (b) Forces Involved; (c) Disk Particles

tation is hindered in the absence of cavitation nuclei and ex-      the axis-translation technique, as discussed in Fredlund and
perimental values as low as Ϫ17 MPa (Ϫ170 atm) have been            Rahardjo 1993). Additionally, from Kelvin’s equation, total
obtained (Marinho and Chandler 1995).                               suction can be inferred from the vapor pressure, or measured
                                                                    with psychrometers, for example, in the pendular stage. How-
Stages of Saturation                                                ever, as discussed above, salts affect the vapor pressure, thus
                                                                    psychrometers sense both the pore-water pressure (air pressure
   Different stages of saturation can be identified. As water        is presumed atmospheric) and the osmotic suction. Values of
begins evaporating or draining from a saturated soil, the out-      matric suction can vary from as low as 10Ϫ1 kPa in clean sands
side menisci at boundaries are pulled inward and the suction        to more than 103 kPa in clays.
pressure increases [as predicted by (2)]. While the change in
water content is very small, the change in pore-water pressure      Effective Stress—Macroscale
has an important global effect on the soil mass which remains
saturated away from the boundary.                                      Equilibrium analysis in saturated media leads to Terzaghi’s
   The pressure when the air phase breaks through into the          effective stress
pore structure is called the air-entry value (also known as bub-
                                                                                              ␴Ј = ␴ Ϫ uw                          (3)
bling pressure or threshold pressure) (Bear 1979; Kohgo et al.
1993; Aubertin et al. 1998). The air-entry value depends on         Likewise, the negative pore-water pressure that develops in an
the pore size, thus, the finer the particles the smaller the pore    unsaturated medium affects the effective interparticle forces.
throats and the higher the air-entry value. Air entry generally     However, the equilibrium analysis must take into consideration
occurs between saturation S = 0.9 and S = 1.0.                      the reduced area occupied by the water in the pores. Bishop
   Once air breaks in, the soil mass becomes unsaturated, yet,      (1959, 1961) proposed a modified expression for the effective
the water still forms a continuous phase. This is the funicular     stress in an unsaturated soil
stage (Newitt and Conway-Jones 1958; Pietsch 1991; Lever-
son and Lohnes 1995). As drying proceeds, the suction pres-                           ␴Ј = (␴ Ϫ ua) ϩ ␹(ua Ϫ uw)                   (4)
sure increases gradually, following a quasi-linear trend with       where ␹ = parameter to be experimentally determined. To a
decreasing saturation. Any local change in water pressure is        first approximation, the parameter ␹ varies with the degree of
rapidly homogenized throughout the mass by pressure diffu-          saturation, from ␹ Ϸ 1 for saturated soils, to ␹ = 0 for dry
sion within the continuous water phase. The drying rate is          soils (Aitchison and Donald 1956; Aitchison 1960; Blight
rather constant in this region.                                     1967). However, ␹ also depends on wetting history, loading
   The pendular stage begins when water becomes discon-             path, soil type, internal structure of the soil, and specimen size
nected. Water rings form around particle contacts, and only an      near percolation (as mentioned above). Still, the inadequacy
adsorbed film may be present on particle surfaces (Leverson          in Bishop’s equation goes beyond the difficulty in predicting
and Lohnes 1995). The radii of menisci are small, thus the          the value of ␹, and it can fail to explain phenomena such as
suction pressure increases significantly. Because this is only a     the collapse of some soils upon wetting (uw decrease ␴Ј de-
contact-level effect, a change in suction within a meniscus is      creases, yet massive volume change takes place).
felt at other menisci through the corresponding change in va-          The limitations in Bishop’s equation can be discussed from
por pressure [(1)]. This is a slow homogenization process. The      different perspectives. On the one hand, it involves a soil pa-
drying rate in this stage is increasingly lower.                    rameter ␹ as in a constitutive equation rather than being a
   Since an unsaturated soil implies a mixed fluid phase, two        description of the state of stress. On the other hand, it mixes
percolation thresholds can be identified according to the con-       global and local conditions. In Terzaghi’s effective stress equa-
tinuity of each phase. One threshold corresponds to the             tion for saturated media, both pore pressure and total stress
formation of a continuous gas phase path. This threshold            are boundary actions; however, the pore-water pressure in un-
separates regimes with very different coefficients of air per-       saturated soils causes a local action at the particle level (this
meability. The other percolation threshold Sc occurs when a         is more readily seen in the pendular regime but it is the case
continuous water film forms across the particulate medium,           in the funicular regime as well).
i.e., the boundary between the pendular and the funicular re-          Today’s macroscale interpretation of unsaturated materials
gimes. Electrical conduction and chemical diffusion in unsat-       is based on separate state variables, such as (ua Ϫ uw) and (␴
urated media rapidly increase when the degree of saturation         Ϫ ua) to avoid such limitations (Bishop and Blight 1963; Fred-
exceeds Sc. Both percolation thresholds are different during        lund et al. 1978).
drying or wetting processes. Furthermore, given the fractal na-
ture of the connectivity structure of a phase near percolation,     MICROSCALE ANALYSIS
measured parameters depend on specimen size (Sahimi 1994).
   The matric suction can be measured with general tensiom-           The equivalent effective stress ␴Ј , due to capillarity is
                                                                                                         eq
eters up to 1 atm, or through high air entry ceramics above 1       herein defined as the effective boundary stress that should be
atm (cavitation within the measurement system is avoided by         applied to a dry or saturated soil specimen to cause similar
                                          JOURNAL OF GEOTECHNICAL AND GEOENVIRONMENTAL ENGINEERING / JANUARY 2001 / 85
interparticle contact forces. The following study starts with        Meanwhile, considering the geometry of the meniscus between
Laplace’s relation [i.e., (2)] and leads to the prediction of the    two particles, the volume of the meniscus can be calculated in
equivalent effective stress as a function of water content, and      terms of particle diameter and the meniscus’s radii. Further-
particle size or specific surface. The purpose of the microscale      more, the volume calculated can be related to the water content
analyses is not to predict field parameters, but to highlight the     w. For the SC packing, the water content becomes

                                                                                 ͩ ͪͫ                              ͩ              ͪͬ
interplay between the variables involved. Soil particles are ide-
alized as either spheres or flat disks.                                         9    ␣4            ␣(2 Ϫ ␣)           2(1 Ϫ ␣)
                                                                     SC w =                  1Ϫ            arcsin
                                                                              8Gs 1 Ϫ ␣2          2(1 Ϫ ␣)        ␣2 ϩ 2(1 Ϫ ␣)
Spherical Particles                                                                                                                (9)

   Consider two spherical particles of radius R in contact [Fig.     where Gs = specific gravity [the complete derivation of equa-
1(a)]. The water meniscus between them is bound by the two           tions presented in this paper and associated parametric studies
particles and by an imaginary torus. The small radius of this        can be found in Cho and Santamarina (1999)]. For small val-
doughnut shaped torus is r1, and the distance from the center        ues of ␣, the first order Taylor expansion of (9) becomes
to the inside wall of the torus is r2 (this is the inner radius of
                                                                                                        9␣4
the torus; it is a negative value in the case of a torus). From                                SC w =                            (10)
geometric considerations                                                                                8Gs

                  (R ϩ r1)2 = R 2 ϩ (r1 ϩ r2)2               (5a)      Finally, the equivalent effective stress due to capillarity can
                                                                     be expressed in terms of the water content. Using the approx-
Hence                                                                imation for w, (8) becomes

                                                                                                     ͫ ͩ ͪͬ
                                                                                                                   1/4
                                    r2                                                         ␲Ts         8
                                                                                     SC ␴Ј =         2Ϫ
                                     2
                         r1 =                                (5b)                        eq                  Gsw                 (11)
                                (2R Ϫ 2r2)                                                     4R          9
   The selection of the torus geometry implies several as-           The geometric restrictions for the torus geometry and the pen-
sumptions. First, the contact angle between the water and the        dular regime correspond to a water content w Յ 0.063 for the
surface of the particles is assumed to be zero and the particles     SC packing regardless of the grain size R.
are assumed to be perfectly smooth. Second, the effect of grav-         A similar analysis can be applied to a tetrahedral (TH) pack-
ity on the geometry of the meniscus is ignored (i.e., the pore-      ing (coordination number 12, void ratio 0.34). For the same
water pressure gradient is negligible relative to the average        size of the menisci ␣ = r2 /R the water content in a tetrahedral
pressure). Finally, the torus is only a convenient approximation     packing is twice the water content in a simple cubic packing
to the true geometry of the meniscus, amenable to analytical
computations. Indeed, constant pressure in the water implies                             TH [w(␣)]TH = 2[w(␣)]SC                 (12)
constant mean curvature according to Laplace’s relation, yet         The equivalent effective stress in this case is
the radius of curvature r2 varies along the surface of the torus
while the r1 curvature is constant [Fig. 1(a)]. In fact, the cor-                        TH [␴Ј ]TH = 2͙2[␴Ј ]SC
                                                                                              eq           eq                    (13)
rect geometry approaches a catenoid. Nevertheless, parameters
computed using the torus geometry are similar to numerical           The geometric restrictions for the torus geometry and the pen-
results obtained with catenoids. Fisher (1926) showed the error      dular regime correspond to a water content w Յ 0.032 for the
to be small at low water contents, increasing up to 2% at the        tetrahedral packing. It is important to note that the soil struc-
limit of the pendular regime (Gili 1988).                            ture for uniformly graded sands at the microscale can be con-
   Eq. 2 can be rewritten in terms of ␣, the ratio of r2 to R,       strained between the simple cubic packing and the tetrahedral
by substituting (5) into (2)                                         packing.


                                          ͩ ͪ
                                                                        The distribution of water is not necessarily homogeneous in
                                     Ts      2                       an unsaturated soil. The normalized vapor pressure P/P0 , com-
                ⌬u = (ua Ϫ uw) =               Ϫ3              (6)   puted with Kelvin’s equation is plotted in Fig. 2 versus the
                                     R␣      ␣
                                                                     water content w for different particle sizes R, i.e., SC packing
The force that the meniscus produces on the particle must            is assumed; radii are expressed in terms of water content as
include not only the pressure of the water acting on the cross-      per (10). It can be seen that at the same vapor pressure (as-
sectional area of the meniscus (i.e., matric suction) but the        sumed homogeneous in the soil mass), the water content in-
surface tension acting along the perimeter [Fig. 1(b)]. So the
force F between two particles becomes
                    F = ⌬u(␲r 2) ϩ Ts(2␲r2)
                              2                                (7)
The force contributed by the surface tension along the perim-
eter has been disregarded by several authors, even though this
omission was highlighted as early as 1926 by Fisher. Its im-
portance increases with water content (within the geometric
limits of meniscus-based analysis) e.g., for w = 0.02 the error
is 250%, and for w = 0.04 the error is 400%.
   The equivalent effective stress ␴Јq due to capillarity can be
                                    e
estimated for a given particle packing. In the case of a simple
cubic (SC) packing (coordination number 6, void ratio 0.91),
the force F is spread over the effective area occupied by a
particle 4R 2. Combining results from (6) and (7), the equiva-
lent effective stress becomes
                             F    ␲Ts
                  SC ␴Ј =
                      eq        =     (2 Ϫ ␣)                  (8)   FIG. 2. Relationship between Normalized Vapor Pressure, Wa-
                            4R 2 4R                                  ter Content, and Particle Size

86 / JOURNAL OF GEOTECHNICAL AND GEOENVIRONMENTAL ENGINEERING / JANUARY 2001
creases with decreasing particle size. Therefore, the spatial        tion [(2)]. The suction pressure then becomes a function of the
variation in local water content (pendular regime) will reflect       radius r1. On the other hand, the separation distance between
the spatial variation in local grain size distribution.              two particles t is twice the radius r1. Hence, the water content
                                                                     w in equally spaced parallel plates is

                                                                                                       ͩ ͪ
Modification for Hertzian Contact Area
                                                                                   Ww A(2r1)␥w         2A           ␥w        ␥w
   The previous solution presumes that the area of the contact                w=      =        =               r1      = Ssr1      (15)
                                                                                   Ws   Ws             Ws /g        g         g
itself is nil. However, the capillary force and externally applied
stresses cause the particles to deform. What is the magnitude        where Ww and Ws = weights of water and solid, respectively;
of this effect? Let us consider two spheres of equal radius.         A = surface area of one plate; ␥w = unit weight of water; Ss =
Upon the application of a normal contact force F the contact         specific surface; and g = acceleration due to gravity. Solving
point becomes a flat circular area of contact radius a. The size      (15) for r1 and replacing in Laplace’s equation, the suction
of this contact area depends on the shear modulus G and Pois-        pressure ⌬u becomes

                                                                                                  ͩͪ ͩ ͪ
son’s ratio ␯ of the material of the particle, and on the radius
R of the sphere, as predicted by Hertz theory                                                     1            Ss␥w
                                                                                        ⌬u = Ts        = Ts                        (16)

                            ͱ
                                                                                                  r1            wg
                            3   3(1 Ϫ ␯)
                       a=                FR                  (14)    For this disk geometry, the equivalent effective stress contrib-
                                   8G
                                                                     uted by capillarity is ␲/4 of the suction pressure (the force
   In an unsaturated soil, the area affected by the meniscus         component due to the surface tension also vanishes when r2
becomes altered by the area of the contact, as does the cur-         > r1). Particle size is not present in this equation. Instead,
                                                                      >
vature r1 for a given volume of water in the meniscus. There         specific surface appears as a more meaningful parameter in the
is no exact solution for this problem, and an iterative proce-       context of small platy particles. The effect of small, high-spe-
dure is required: (1) The stress is computed taking into con-        cific surface particles on capillarity has been recognized in the
sideration capillary forces; (2) the area of the Hertzian contact    development of empirical equations in terms of D10 [e.g., Ter-
is computed with (14); (3) the capillary force is recalculated       zaghi and Peck (1948)].
taking into consideration the reduction in the cross section of         As water dries, either the particles move closer together
the meniscus; and (4) a new value of stress is obtained. The         (i.e., smaller r1) or the meniscus recedes between the particles
procedure is repeated until the computed stress converges. In        at constant r1. The parallel particle model applies to dispersed-
Fig. 3, the equivalent combined stress (i.e., sum of the equiv-      aggregated systems (e.g., face-to-face contact). The analysis of
alent effective stress due to capillarity and the applied stress     flocculated fabrics with edge-to-face contacts leads to a lesser
due to external confinement) in the unsaturated soil is plotted       effect of capillarity on interparticle forces. While the previous
versus the applied stress. The particle size (R = 1 ␮m), the         analysis considers only the force contributed by capillarity on
particle stiffness (G = 3.7 GPa), and the degree of saturation       perfectly smooth disks, the analysis of equilibrium must also
(S = 3 и 10Ϫ6) for simple cubic packing were selected to high-       include the localized reaction at asperities and interparticle
light the effect. The lower dotted line is the 1:1 relation for a    electrical forces (Nagaraj and Srinivasa Murthy 1985; Fam and
dry soil, i.e., with no capillary forces. The upper dashed line      Santamarina 1996).
includes the effect of external confinement and the effect of
capillarity uncorrected for contact area. The continuous line is     RESULTS AND DISCUSSION
the corrected solution obtained with the iterative procedure to
correct for contact area. Results show the increased effect of          Fig. 4 shows the variation in equivalent effective stress due
capillarity at low confinement, and the vanishing effect of cap-      to capillarity versus the water content for both spherical and
illarity at high confining stress.                                    disk-shaped particles (Gs = 2.65) [(11), (13), and (16)]. The
                                                                     equivalent effective stress increases with decreasing water con-
Flat Particles                                                       tent, decreasing particle size, increasing specific surface, and
                                                                     increasing coordination.
  If plate particles are analyzed as disks with radius r2 > r1
                                                           >            Note the relatively limited sensitivity of the equivalent ef-
[Fig. 1(c)], the term 1/r2 can be neglected in Laplace’s equa-       fective stress to water content in spherical particles as com-
                                                                     pared to flat particles. Indeed, as the water content decreases,
                                                                     the negative pressure in the meniscus increases drastically, but
                                                                     the effective area of the meniscus between spherical particles
                                                                     decreases as well. On the other hand, the effective area in flat
                                                                     particles remains constant, assuming that particles move closer
                                                                     together.
                                                                        Several restrictions of the models are identified in the figure.
                                                                     The geometric limits (x and xЈ) are derived from the torus
                                                                     geometry. The limit for cavitation (y) is also shown; the lo-
                                                                     cation of this boundary depends on the assumed cavitation
                                                                     pressure for the fluid (for illustration, a cavitation pressure of
                                                                     1 MPa is selected). The equivalent effective stress contributed
                                                                     by capillarity will disappear when the negative pressure ex-
                                                                     ceeds the cavitation pressure. The upper limit (Ž) shown for
                                                                     flat particles corresponds to an interparticle distance (2 и r1)
                                                                     equal to ten times the molecular diameter in (16).
                                                                        There are other factors in real soils that increase strength
                                                                     and stiffness at low saturation. As water dries, fines migrate
                                                                     to contacts, and form buttresses between larger particles. These
                                                                     buttresses increase the stiffness of the granular skeleton
FIG. 3. Combined Stress Taking into Consideration Applied            formed by the coarser grains. At the same time, the ionic con-
Effective Stress and the Contact-Level Capillary Force               centration in the pendular water increases and eventually
                                              JOURNAL OF GEOTECHNICAL AND GEOENVIRONMENTAL ENGINEERING / JANUARY 2001 / 87
FIG. 4.   Equivalent Effective Stress versus Gravimetric Water Content

reaches saturation causing the precipitation of salt crystals be-    tion to predict the optimum degree of saturation (Sopt) corre-
tween the two contacting particles. Salt precipitation also in-      sponding to the peak of the shear-wave velocity Vs
creases the stiffness of the particulate skeleton. This phenom-
                                                                                    Sopt = [Ϫ6.5 log(D10) ϩ 1.5]/100            (18)
enon is readily seen with optical microscopy by observing the
desiccation of a saltwater meniscus between two glass bead           where D10 = 10% effective grain size (mm). However, it is
particles. Finally, two particles can become ionically bonded        clearly observed under optical microscopy that two surface-
at low water content (e.g., a calcium ion Caϩϩ can bond two          wet particles do not form a meniscus when brought into con-
negative charges on the surfaces of contacting particles). It is     tact unless the water film is fairly thick. Therefore, the spec-
expected that these phenomena produce effects similar to ce-         imen preparation method followed by Wu et al. (1984) and
mentation; this is the case of loess (Rinaldi et al. 1998).          Qian et al. (1991, 1993) is adequate to study freshly remolded
                                                                     unsaturated soils, but it does not apply to soils that have been
SMALL STRAIN STIFFNESS                                               subjected to gradual drying. Thus, the applicability of (18)
                                                                     should be restricted to freshly remolded soils.
  The shear wave velocity Vs in a homogeneous, isotropic
continuum can be expressed in terms of shear modulus G and           Experimental Device and Procedure
mass density ␳                                                          In order to explore the implications of capillarity on stiff-

                           Vs =   ͱG
                                   ␳
                                                            (17)
                                                                     ness at low water contents without remolding the specimen,
                                                                     drying tests were performed while monitoring the specimen
                                                                     with shear waves. The oedometric cell described in Fam and
The shear modulus in particulate materials depends on the ef-        Santamarina (1995) was modified for this purpose [Fig. 5(a)].
fective interparticle contact forces and the ensuing contact         The cell diameter and height were selected as a compromise
stiffness. As shown above, the presence of water in unsaturated      between accuracy in travel time measurements, side friction,
particulate materials increases the contact forces, but it also      and duration of drying. The Plexiglas shell, the Plexiglas base,
increases the density of the medium.                                 and the brass upper plate (weight 11.8 N; applied vertical ef-
                                                                     fective stress = 1.5 kPa) were all machined within 0.05 mm
Previous Studies                                                     tolerance. The Plexiglas shell was perforated, and a cotton
                                                                     threadlike wick was installed in each hole to facilitate evap-
   The effect of capillarity on the shear-wave velocity in soils     oration and to favor a homogeneous water distribution. Pie-
was studied by Wu et al. (1984) and Qian et al. (1991, 1993).        zocrystal bender elements (Morgan Matroc Inc., Bedford,
In those studies, sands were mixed with distilled water to a         Ohio) were mounted on the top and bottom platens to send
preselected degree of saturation. The mixture was placed in an       and to receive shear waves. Crystals were insulated with a
airtight container and stored for at least 24 h to ensure uniform    double coating of polyurethane, and encapsulated inside resin
water distribution. Specimens were then prepared by com-             to fix them to the platens.
pacting the wet soil to the required void ratio, and tested in a        The experimental setup is shown in Fig. 5(b). A Krohn-Hite
resonant column. Wu et al. (1984) obtained an empirical equa-        Signal Generator Model 1400A was used to feed a square
88 / JOURNAL OF GEOTECHNICAL AND GEOENVIRONMENTAL ENGINEERING / JANUARY 2001
FIG. 5.      (a) Schematic Cell Design (All Dimensions in Millimeters); (b) Experimental Setup

               TABLE 1.        Tested Materials—Properties                    (14)]. The mixture of glass beads and kaolinite was used to
                                Glass                  Granite   Sandboil     increase the specific surface; the resulting specimen has a pro-
          Material              bead       Kaolinite   powder     sand        nounced gap-graded distribution. Granite powder is a byprod-
            (1)                  (2)         (3)         (4)       (5)        uct of rock crushing during the production of aggregates for
                                                                              concrete, and it is a well-graded material composed of angular
D10 (␮m)                        260           1         17        170
D50 (␮m)                        320           5         89        360         grains (Cc = 1.1; Cu = 6.2). The sandboil sand is a natural soil
Specific gravity                   2.46        2.70       2.75       2.62      from a paleoliquefaction site in mid-America.
Specific surface (m2/g)           10Ϫ2 a      13b         1.5b       1.1b         The materials were mixed with distilled water at saturated
  a
      Data estimated from particle size.                                      conditions, and gradually poured into the cell. Kneading fa-
  b
      Calibrated absorption methods.                                          cilitated the densification of materials and the removal of air
                                                                              bubbles. Glass beads were extensively washed in deionized
                                                                              water to avoid salt precipitation at low water contents.
TABLE 2. Composition, Void Ratio, and Test Type for Each                         Tests were run in an incubator at 50ЊC to speed drying.
Specimen                                                                      Temperature was kept constant to avoid changes in surface
                    Composition of Materials                                  tension (surface tension decreases with increasing tempera-
                                                                              ture), and changes in confinement due to the expansion and
            Glass                Granite Sandboil
Speci-      bead       Kaolinite powder   sand           Void
                                                                              shrinkage of the cell. The specimen was suspended with a wire
 men         (%)         (%)       (%)     (%)           ratio   Test type
                                                                              inside the incubator. The wire acted on an external scale that
 (1)          (2)         (3)       (4)     (5)           (6)       (7)       allowed the weight of the specimen to be monitored, in order
                                                                              to compute the water content or the degree of saturation.
   I          100         —           —         —       0.601    Drying
   II          80         20          —         —       0.564    Drying
                                                                                 The measured shear-wave velocity is plotted versus the cor-
   III         —          —          100        —       0.692    Drying       responding degree of saturation in Fig. 7. When the degree of
   IV          —          —           —        100      0.507    Drying       saturation decreases from the saturated condition (S = 1.0) to
   V          100         —           —         —       0.553    Recovery     the dry condition (S = 0), the shear-wave velocity increases in
                                                                              all specimens. A detailed discussion follows for each material.
pulse to the lower bender element. Signals detected with the                  Results for Clean Glass Beads
upper crystal were amplified with a Krohn-Hite Multi Channel
Filter-Amplifer Model 3364, and digitized with a Rapid Sys-                      The shear-wave velocity in the glass bead specimen reaches
tems digital storage oscilloscope Model R1016. The average                    a peak and decreases abruptly as drying continues [Fig. 7(a)].
of 256 stacked signals was stored in a personal computer.                     In the ideal case of spherical particles and constant fabric, the
   The tested specimens included glass beads (spherical par-                  shear-wave velocity is proportional to the effective stress as
ticles), a mixture of glass beads and kaolinite (flat particles;               Vs ϰ ␴Ј1/6 (Hertzian contact). Therefore, the trend Vs Ϫ S is
clay), granite powder (angular particles; silt), and sand ob-                 smoother than the suction-saturation trend. Pore size governs
tained from a liquefied site in Blytheville, Arkansas (sandboil                the magnitude of the effective stress increase in the region of
sand). Tables 1 and 2 summarize relevant information for these                funicular water. The gentle slope between points A and B sug-
materials used and the tested specimens. Particle size distri-                gests monosized pores. Indeed, it is unlikely that a uniform
butions are shown in Fig. 6; these plots have been purposely                  coarse-grained soil will form a dual porosity medium.
rotated 90Њ to facilitate comparison with other results. Glass                   The negative pore-water pressure in the pendular region (to
beads were used to approximate the theoretical model [(5)–                    the left of point B) causes a strong increase in shear-wave
                                                     JOURNAL OF GEOTECHNICAL AND GEOENVIRONMENTAL ENGINEERING / JANUARY 2001 / 89
FIG. 6. Particle Size Distributions for Different Materials: (a) Glass Beads; (b) Mixture of Kaolinite and Glass Beads; (c) Granite Pow-
der; (d) Sandboil Sand

velocity. The degree of saturation at peak shear-wave velocity         tacts, bonding due to ion sharing, and salt precipitation are
is S = 0.007. For comparison, for freshly remolded specimens           expected as drying proceeds beyond point C to the peak ve-
(18) predicts the peak in stiffness at Sopt = 0.053. The drop in       locity at S = 0.
stiffness between the peak and the perfectly dry state may
reflect several internal mechanisms. For example, menisci may           Results for Granite Powder
form between particles that remain separated by a short dis-
                                                                          The shear-wave velocity in the granite powder specimen
tance; as water evaporates, menisci between noncontacting
                                                                       increases continuously and shows no drop even at the perfectly
particles fail earlier than menisci between particles in contact
                                                                       dry condition S = 0 [Fig. 7(c)]. The shear-wave velocity for
(a similar analysis could be extended to the effect of surface
                                                                       the dry specimen is approximately eight times larger than for
roughness). Therefore, the loss in equivalent effective stress
                                                                       the saturated specimen. It is expected that stiffening mecha-
contributed by capillarity is a gradual process that starts before
                                                                       nisms at low saturation may explain the jump in shear-wave
the specimen is completely dry, even if particles are of uniform
                                                                       velocity near S = 0 in this specimen as well, i.e., fines migra-
size. Finally, the difference between the velocities at S = 0 and
                                                                       tion to contacts, salt precipitation, and bonding. When the
at S = 1.0 cannot be fully accounted for by changes in mass
                                                                       specimen is resaturated by flooding, the shear wave velocity
density. An increase in internal coordination during drying and
                                                                       drops to its initial value [square points in Fig. 7(c)]. This result
residual compressive stress are expected.
                                                                       suggests that the light cementation that develops during drying
                                                                       disappears upon wetting.
Results for Kaolinite-Glass Beads                                         The optimum degree of saturation calculated with the em-
                                                                       pirical relation for remolded specimens [(18)] predicts the peak
   The shear wave velocity in the kaolin-glass beads specimen
                                                                       in stiffness for the granite powder specimen at Sopt = 0.11.
increases in three distinct steps and shows no drop even at the
                                                                       However, the measured peak shear-wave velocity in the un-
dry condition [Fig. 7(b)]. In fact, the shear-wave velocity at S
                                                                       disturbed specimen is 1.7 times greater than that at Sopt = 0.11.
= 0 is 18 times larger than the velocity at S = 1.0. The em-
pirical equation for remolded specimens [(18)] predicts a peak
                                                                       Results for Sandboil Sand
in stiffness at an optimal saturation of Sopt = 0.21. The mea-
sured shear-wave velocity almost doubles between Sopt = 0.21              The shear-wave velocity for the sandboil sand specimen in-
and S = 0 in this undisturbed specimen. The specimen did not           creases continuously and shows no drop even at the perfectly
develop any crack and the observed shrinkage was negligible.           dry condition S = 0 [Fig. 7(d)]. The shear-wave velocity for
Clearly, glass beads formed a granular skeleton that prevented         the dry sand is nearly two times greater than for the saturated
shrinkage and cracking of the specimen. When the specimen              sand. The optimum degree of saturation calculated with (18)
was sectioned after the test, quasi-spherical cavities, like bub-      is Sopt = 0.065. The measured peak shear-wave velocity in the
bles, could be seen throughout, and clay particles had moved           undisturbed specimen is 1.6 times greater than the shear-wave
toward glass bead contacts. Clay-based strengthening of con-           velocity at Sopt.
90 / JOURNAL OF GEOTECHNICAL AND GEOENVIRONMENTAL ENGINEERING / JANUARY 2001
FIG. 7. Shear-Wave Velocity versus Degree of Saturation for Different Materials: (a) Clean Glass Beads (Deionized Water); (b) Mixture
of Kaolinite and Glass Beads; (c) Granite Powder; (d) Sandboil Sand

Comparison between Microscale-Based Predictions                             by knowing the parameter ␤ and estimating ␴Јq using either
                                                                                                                              e
and Experimental Results                                                    the spherical or the flat particle models.
                                                                               The shear-wave velocities predicted with (20) for the four
   Empirical expressions for shear-wave velocity Vs have been               specimens at three levels of saturation (i.e., S = 0.05, 0.1, and
proposed for particulate materials in terms of the state of ef-             0.15) are compared against the measured values in Fig. 8. The
fective stress (Stokoe et al. 1991; Santamarina and Cascante                coefficient of lateral earth pressure was assumed to be K0 =
1996)                                                                       1 Ϫ sin ␾ in this analysis. Measured values for the glass beads

                                     ͩ       ͪ                              and the sandboil sand specimens are well predicted using the
                                                  ␤
                                      ␴Ј ϩ ␴Ј
                            Vs = ␪
                                       v     h
                                                                    (19)    spherical particle model, and ␤ = 1/6 for the glass beads and
                                         2pa                                ␤ = 0.22 for the sandboil sand. However, since the finer frac-
where ␪ and ␤ = empirical parameters; ␴Ј and ␴Ј = vertical                  tion has an important role in the global stiffness, measured
                                             v      h
and horizontal effective stress, respectively; and pa = atmo-
spheric pressure used for dimensionality. Suggested values for
␤ are (Santamarina and Aloufi 1999): ␤ = 1/6 for Hertzian
contact, ␤ = 1/4 for plastic spherical contact and for cone-to-
phase contact (angular or rough particles), ␤ Х 0.2 to 0.25 for
sands (the looser the sand the higher ␤), and ␤ Х 0.27 to 0.30
for kaolin.
   Eq. (19) is used to compute the shear-wave velocity at a
given saturation S, [Vs]S , in terms of the shear-wave velocity
at saturation S = 1.0, [Vs]S=1 , taking into consideration the
changes in mass density [for saturated conditions in an oed-
ometer ␴Ј ϩ ␴Ј = (1 ϩ K0)␴Ј, while ␴Ј due to capillarity is
          v    h                v         eq
considered isotropic]

                            ͫ                    ͬͱ
                                                      ␤
                                        2␴Ј                e ϩ Gs
                              1ϩ
                                          eq
         [Vs]S = [Vs]S =1                                           (20)
                                     (1 ϩ K0)␴Ј
                                              v           eS ϩ Gs
where ␴Јq = equivalent effective stress due to capillarity at a
         e
given degree of saturation S; e = void ratio; Gs = specific
gravity; and K0 = coefficient of lateral earth pressure at rest.
Hence, the shear-wave velocity at a given saturation S can be               FIG. 8. Comparison between Measured and Predicted Shear-
predicted from the shear-wave velocity at saturation S = 1.0                Wave Velocities

                                                      JOURNAL OF GEOTECHNICAL AND GEOENVIRONMENTAL ENGINEERING / JANUARY 2001 / 91
FIG. 9. Drying Rate versus Degree of Saturation in Incubator at 50؇C for Different Materials: (a) Clean Glass Beads (Deionized Water);
(b) Mixture of Kaolinite and Glass Beads; (c) Granite Powder; (d) Sandboil Sand


velocities for the kaolinite-glass beads and the granite powder       EXPERIMENTAL STUDY OF MENISCI FAILURE AND
specimens cannot be explained by the spherical particle model.        RECOVERY
Predictions shown in Fig. 8 correspond to the flat particle
                                                                         Shear deformation involves particle displacement and par-
model, and ␤ = 0.27 for kaolinite-glass beads and ␤ = 0.24            ticle rotation. When an unsaturated soil is subjected to shear,
for granite powder.                                                   menisci are strained and may eventually break causing a re-
   The maximum shear wave velocity [Vs]max that is reached            duction in the capillary effect. When the strain in a soil ex-
by these specimens (at S = 0) can be estimated as                     ceeds the strain that menisci can sustain, both soil strength and
                                                                      stiffness are affected. The purpose of this study is to determine
    [Vs]max = 2,200/͙D10   (for 5 ␮m Յ D10 Յ 300 ␮m)       (21)       the strain at menisci failure and its dependency on water con-
                                                                      tent, by performing microscale tests and analyses. Then, an
where [Vs]max is in meters per second; and D10 is in microm-          assessment of menisci regeneration is attempted.
eters.
   The parallelism between the grain-size distribution plots          Menisci Failure
(Fig. 6) and the shear-wave velocity plots (Fig. 7) is noticea-
ble, highlighting the importance of grain-size distribution on           Microscale tests were conducted with two glass beads (di-
capillarity. A similar observation has been made in the context       ameter D = 1.6 mm) under optical microscopy (ϫ150). The
                                  ¨
of water retention curves [e.g., Oberg (1997)].                       glass beads were cleaned with distilled water before testing.
                                                                      Measurements included the initial radii of the meniscus, i.e.,
                                                                      r1 and r2 in Fig. 1(a), and the relative position of the particles
Drying Rates

   For completeness, Fig. 9 presents the change in drying rate
(ѨS/Ѩt) versus the degree of saturation for the three specimens.
Three general regions are observed. At the beginning, near
saturation S = 1.0, the drying rate increases reflecting the in-
crease in temperature within the specimen as it warms up to-
ward the incubator temperature. After air entry, evaporation
occurs at an almost constant rate for uniform pore-size spec-
imens. Finally, the evaporation of water within small menisci
and loosely bound water near saturation S = 0 takes place at
a decreasing rate (Santamarina and Wakim 1992; Kayyal 1995;           FIG. 10. Sketch of Microscale Tests for Menisci Failure: (a)
Knight et al. 1996).                                                  Pulling Test; (b) Horizontal Shear Test; (c) Rotating Test

92 / JOURNAL OF GEOTECHNICAL AND GEOENVIRONMENTAL ENGINEERING / JANUARY 2001
FIG. 11. Microscale Test for Menisci Failure Showing Experimental and Analytical Results: (a) Pulling Test; (b) Horizontal Shear Test;
(c) Rotating Test


at menisci failure. The measured radii were used to compute
the water content by using (9) or (10) (SC packing, coordi-
nation number 6), and the particle positions at menisci failure
were used to compute the equivalent strain.
   Microscale tests for menisci failure are sketched in Fig. 10.
Three tests were run: (1) Pulling along the normal-contact di-
rection; (2) shearing parallel to the contact plane; and (3) ro-
tation of one particle relative to the other while maintaining
interparticle contact. Results for the three cases are shown in
Fig. 11. Each circle represents a separate test. The trends show
that the strain when menisci fail decreases with the decrease
in water content in the three cases.
   An analytical microscale solution was developed to predict
the strain at meniscus failure for the cases of normal and shear
tensile deformations (Cho and Santamarina 1999). The anal-
ysis is based on estimating the zero-suction condition that de-
velops when a meniscus is strained and its radii r1 and r2
change correspondingly. For a given strain, the volume of wa-
ter can be expressed in terms of radii r1 and r2, and the particle
radius R. The water content can be related to the volume of
water for SC packing. The first-order Taylor approximation for
the normal strain (i.e., pulling test) is
                      ␦
              εa =      Ϸ 0.53(Se)1/3 = 0.53(Gsw)1/3         (22)
                     2R
where εa = normal strain (i.e., axial strain); ␦ = distance be-
tween two particles when meniscus fails; R = particle radius;
S = degree of saturation; e = void ratio; Gs = specific gravity
of particle; and w = water content. The first-order Taylor ap-
proximation for the shear strain in the horizontal shear test can
be expressed in terms of the normal strain
                          εs = ͙ε 2 ϩ 2εa
                                  a                          (23)
where εs = shear strain.
   Analytical predictions are superimposed on Figs. 11(a and          FIG. 12. Perturbation-Recovery Test; Note Shear-Wave Veloc-
b). In general, there is good agreement between experimental          ity Is Normalized with Respect to Shear-Wave Velocity Immedi-
data and analytical predictions. The gap at relatively high wa-       ately before Impact: (a) S = 0.40 Degree of Saturation; (b) S =
ter content reflects the nontoroidal shape of the stretched me-        0.01 Degree of Saturation

                                            JOURNAL OF GEOTECHNICAL AND GEOENVIRONMENTAL ENGINEERING / JANUARY 2001 / 93
niscus. On the other hand, deviations at small water content        plore this suspicion, a specimen was laterally impacted with a
may reflect experimental difficulties related with measuring          pendulum to deliver a fixed impulse (Specimen V in Table 2).
and preserving very small menisci.                                  The shear-wave velocity was measured before and after im-
   The observed strains for menisci failure (ε = 0.01 to 1) are     pact. The study was repeated at different degrees of saturation
higher than the threshold strain for sands determined from the      while the degree of saturation remained approximately con-
shear modulus degradation curves. Therefore, capillary effects      stant during each study. Data are plotted in Fig. 12 for the
will contribute to low strain stiffness, as shown earlier. Yet,     degree of saturation S = 0.4, i.e., funicular stage—pressure
small menisci (low water content) may fail before soils reach       diffusion-based homogenization, and for S = 0.01, i.e., pen-
the strain at peak strength and will not contribute to soil         dular stage—vapor pressure-based homogenization. Results
strength [w Ϸ 0.01 or lower, from (22) or (23)]. For higher         show fast and complete recovery in the funicular stage. On
water contents, capillary forces will contribute to increase both   the other hand, the rate of recovery is low in the pendular
the low strain stiffness of soils and the strength of the soil.     stage, and full recovery may not be reached. These results
   It is important to note that the negative pressure gradually     show a potential mechanism to explain thixotropic recovery in
decreases as the meniscus is deformed, due to the changes in        unsaturated materials (Dıaz Rodrıguez and Santamarina 1999).
                                                                                             ´       ´
curvature that it experiences (Laplace’s equation). In other
words, the contribution of a meniscus to the internal forces        SUMMARY AND CONCLUSIONS
does not vanish suddenly, but gradually with the strain level.
Early experimental results by Donald (1956) and Escario and            Experiments and analyses were performed to gain further
Juca (1989) support these observations. Limiting values of wa-
    ´                                                               insight into the microscale behavior of unsaturated particulate
ter content w must be taken into consideration when applying        materials. Emphasis was placed on the pendular stage and on
models for the shear strength of unsaturated soils; Rahardjo        the effect of capillary forces on small strain stiffness. Other
and Han (1995) show ␾ varying with S.                               factors, besides capillarity, coexist and increase the stiffness at
                                                                    low saturation levels. Fig. 13 summarizes particle-level phe-
Suction Homogenization and Menisci Recovery                         nomena identified in this study. The main conclusions from
                                                                    this study follow:
  Perturbations may alter the internal equilibrium at the ma-
croscale, even if menisci failure does not take place. To ex-         • The contribution of capillarity to interparticle forces in-


                                FIG. 13.   Stages of Unsaturated Conditions and Related Phenomena

94 / JOURNAL OF GEOTECHNICAL AND GEOENVIRONMENTAL ENGINEERING / JANUARY 2001
volves not only matric suction (i.e., negative pore-water               Cho, G. C., and Santamarina, J. C. (1999). ‘‘Unsaturated particulate
       pressure) but the surface tension force along the edge of                  materials—Analytical study.’’ ͗http://www.ce.gatech.edu/ϳcarlos/
                                                                                  Laboratory/public/electonic.html͘.
       menisci, as well.                                                       Defay, R., and Prigogine, I. (1966). Surface tension and adsorption, D.
   •   The ‘‘equivalent effective stress’’ due to capillary forces                H. Everett, translator, Longman’s, London.
       increases with decreasing water content, decreasing par-                Dıaz-Rodrıguez, J. A., and Santamarina, J. C. (1999). ‘‘Thixotropy: The
                                                                                 ´         ´
       ticle size, and increasing coordination. Specific surface is                case of Mexico City soils.’’ XI Panamerican Conf. on Soil Mech. and
       a meaningful parameter in the characterization of unsat-                   Geotech. Engrg., 1, 441–448.
                                                                               Donald, I. B. (1956). ‘‘Shear strength measurements in unsaturated non-
       urated soils.                                                              cohesive soils with negative pore pressures.’’ 2nd Proc. of Australia-
   •   Shear waves permit studying the evolution of effective                     New Zealand Conf. on Soil Mech. and Found. Engrg., University of
       interparticle forces. This is particularly valuable in the                 Melbourne, Australia, 200–204.
       pendular regime where direct measurement of the nega-                   Escario, V., and Juca, J. F. T. (1989). ‘‘Strength and deformation of partly
                                                                                                     ´
       tive pore-water pressure is not feasible. Remolding is not                 saturated soils.’’ Proc., Int. Conf. on Soil Mech. and Found. Engrg.,
                                                                                  Balkema, Rotterdam, The Netherlands, 1, 43–46.
       an appropriate specimen-preparation procedure to study                  Fam, M., and Santamarina, J. C. (1995). ‘‘Study of geoprocesses with
       the behavior of low water-content soils.                                   complementary wave measurements in an oedometer.’’ Geotech. Test-
   •   The shear-wave velocity at low saturation can be esti-                     ing J., ASTM, 18(3), 307–314.
       mated to a first approximation form the shear-wave ve-                   Fam, M., and Santamarina, J. C. (1996). ‘‘Coupled diffusion-fabric-flow
                                                                                  phenomena: An effective stress analysis.’’ Can. Geotech. J., Ottawa,
       locity of the saturated specimen by taking into consider-                  33, 515–522,
       ation particle size, shape, and water content.                          Fisher, E. A. (1923). ‘‘Some factors affecting the evaporation of water
   •   Grain size distribution plays a crucial role in the evolution              from soil.’’ J. Agric. Sci., London, 13, 121–143.
       of stiffness with saturation.                                           Fisher, J. C. (1948). ‘‘The fracture of liquids.’’ J. Appl. Phys., 19, 1062–
   •   An unsaturated soil shows a sudden drop in low strain                      1067.
                                                                               Fisher, R. A. (1926). ‘‘On the capillary forces in an ideal soil; Correction
       stiffness when perturbed, followed by a time-dependent                     of formulae given by W. B. Haines.’’ J. Agric. Sci., London, 16, 492–
       regain. The rate of regain is faster when menisci are in-                  505.
       terconnected (funicular stage). In the pendular stage, pore-            Fredlund, D. G. (1991). ‘‘How negative can pore-water pressures get?’’
       water pressure homogenization takes place through the                      Geotech. News, Vancouver, (Sept.), 44–46.
       vapor pressure; this is a slow process and stiffness regain             Fredlund, D. G., Morgenstern, N. R., and Widger, R. A. (1978). ‘‘The
                                                                                  shear strength of unsaturated soils.’’ Can Geotech. J., Ottawa, 15(3),
       may not be complete.                                                       313–321.
   •   The strain at menisci failure decreases with the decrease               Fredlund, D. G., and Rahardjo, H. (1993). Soil mechanics for saturated
       in water content. Unless the water content is extremely                    soils, Wiley, New York.
       small, menisci will fail at strains greater than the threshold          Giancoli, D. C. (1998). Physics—Principles with application, 5th Ed.,
       strain of the soil; therefore, partial saturation is a stabiliz-           Prentice-Hall, Englewood Cliffs, N.J.
                                                                               Gili, J. A. (1988). ‘‘Modelo Microstructural para Medios Granulares No
       ing force for the soil skeleton. On the other hand, small                  Saturados.’’ PhD thesis, Universidad Politechnica de Catalunya, Spain.
       menisci may fail before the strain at peak strength of soils            Gilliland, E. R. (1938). ‘‘Fundamental of drying and air conditioning.’’
       (depending on the degree of saturation). Thus, capillary                   J. Industrial and Engrg. Chem., Washington, D.C., 30, 506–514.
       forces at low water contents cause an increase in the low               Guan, Y., and Fredlund, D. G. (1997). ‘‘Use of the tensile strength of
       strain stiffness of soils, but may not contribute to the peak              water for the direct measurement of high soil suction.’’ Can. Geotech.
                                                                                  J., Ottawa, 34(4), 604–614.
       strength.                                                               Hilf, J. W. (1956). ‘‘An investigation of pore-water pressure in compacted
                                                                                  cohesive soils.’’ PhD thesis, U.S. Bureau of Reclamation, TC 654, Uni-
ACKNOWLEDGMENTS                                                                   versity of Colorado, Boulder, Colo.
                                                                               Hillel, D. (1980). Applications of soil physics, Academic, San Diego.
    This study is supported by the Mid-America Earthquake Center,              Kayyal, M. K. (1995). ‘‘Effect of the moisture evaporative stages on the
Urbana, Ill., under National Science Foundation Grant EEC-970185.                 development of shrinkage cracks in soils.’’ Proc., 1st Int. Conf. on
E. Macari, L. Hoyos, and D. Muir Wood provided valuable information               Unsaturated Soils, E. E. Alonso and P. Delage, eds., Balkema, Paris,
and comments. The authors are very thankful to reviewers for their de-            373–379.
tailed reviews. Specific surface data were gathered by K. A. Klein and          Knight, R., Tercier, P., and Goertz, D. (1996). ‘‘A laboratory procedure
Y.-H. Wang. Derivation and further analyses associated with this paper            for estimating irreducible water saturation from cuttings.’’ The Log An-
can be found on the authors’ website, http://www.ce.gatech.edu/ϳcarlos/           alyst, (Jul.–Aug.), 18–24.
Laboratory/public/electronic.html.                                             Kohgo, Y., Nakano, M., and Miyazaki, T. (1993). ‘‘Theoretical aspects
                                                                                  of constitutive modelling for unsaturated soils.’’ Soils and Found.,
APPENDIX.          REFERENCES                                                     Tokyo, 33(4), 49–63.
                                                                               Leverson, S. M., and Lohnes, R. A. (1995). ‘‘Moisture tension relations
Aitchison, G. D. (1960). ‘‘Relationships of moisture stress and effective         in sand.’’ Proc., 1st Int. Conf. on Unsaturated Soils, E. E. Alonso and
  stress functions in unsaturated soils.’’ Conf. British Nat. Soc. of Int.        P. Delage, eds., Balkema, Paris, 387–392.
  Soil Mech. and Found. Engrg., Butterworth’s, London, 47–52.                  Marinho, F. A. M., and Chandler, R. J. (1995). ‘‘Cavitation and the direct
Aitchison, G. D., and Donald, I. B. (1956). ‘‘Effective stresses in unsat-        measurement of soil suction.’’ Proc., 1st Int. Conf. on Unsaturated
  urated soils.’’ 2nd Proc. of Australia-New Zealand Conf. on Soil Mech.          Soils, E. E. Alonso and P. Delage, eds., Balkema, Paris, 623–630.
  and Found. Engrg., University of Melbourne, Australia, 192–199.              Nagaraj, T. S., and Srinivasa Murthy, B. R. (1985). ‘‘Compressibility of
Aubertin, M., Ricard, J.-F., and Chapuis, R. P. (1998). ‘‘A predictive            partly saturated soils.’’ J. Geotech. Engrg., ASCE, 111(7), 937–942.
  model for the water retention curve: Application to tailings from hard-      Newitt, D. M., and Conway-Jones, J. M. (1958). ‘‘A contribution to the
  rock mines.’’ Can. Geotech. J., Ottawa, 35, 55–69.                              theory and practice of granulation.’’ Trans. Inst. Chem. Engrg., Chem.
Bear, J. (1979). Hydraulics of groundwater, McGraw-Hill, New York.                Engrg. Res. and Des., Pergamon, U.K., 36, 422–442.
                                                                               ¨
                                                                               Oberg, A.-L. (1997). Matrix suction in silt and sand slopes—Significance
Bishop, A. W. (1959). ‘‘The principle of effective stress.’’ Teknisk Ukeblad
                                                                                  and practical use in stability analysis.’’ PhD thesis, Chalmers University
  I Samarbeide Med Teknikk, Oslo, Norway, 106(39), 859–863.
                                                                                  of Technology, Goteborg, Sweden.
                                                                                                     ¨
Bishop, A. W. (1961). ‘‘The measurement of pore pressure in the triaxial
                                                                               Oliver, T. R., and Newitt, D. M. (1949). ‘‘The measurement of suction
  test.’’ Conf. British Nat. Soc. of Int. Soil Mech. and Found. Engrg.,           potentials and moisture distribution in drying granular soils.’’ Trans.
  Butterworth’s, London, 38–46.                                                   Inst. Chem. Engrg.: Chem. Engrg. Res. and Des., Pergamon, U.K., 27,
Bishop, A. W., and Blight, G. E. (1963). ‘‘Some aspects of effective stress       9–18.
  in saturated and partly saturated soils.’’ Geotechnique, London, 13(3),
                                              ´                                Pietsch, W. (1991). Size enlargement by agglomeration, Wiley, New York.
  177–196.                                                                     Qian, X., Gray, D. H., and Woods, R. D. (1991), ‘‘Resonant column tests
Bishop, A. W., Kumapley, N. K., and El-Ruwayih, A. (1975). ‘‘The in-              on partially saturated sands.’’ Geotech. Testing J., 14(3), 266–275.
  fluence of pore-water tension on the strength of clay.’’ Philosophical        Qian, X., Gray, D. H., and Woods, R. D. (1993). ‘‘Voids and granulo-
  Trans. Royal Soc., London, 278(A.1286), 511–554.                                metry: Effects on shear modulus of unsaturated sands.’’ J. Geotech.
Blight, G. E. (1967). ‘‘Effective stress evaluation for unsaturated soils.’’      Engrg., ASCE, 119(2), 295–314.
  J. Soil Mech. and Found. Div., ASCE, 93(2), 125–148.                         Rahardjo, H., and Han, K. K. (1995). ‘‘Shear strength of unsaturated soils

                                                  JOURNAL OF GEOTECHNICAL AND GEOENVIRONMENTAL ENGINEERING / JANUARY 2001 / 95
as it applies to slope stability analysis.’’ Symp. on Unsaturated Soil      ification with electromagnetic waves: Applications to environmental
  Behavior and Applications, Nairobi, Kenya, 1–31.                            geotechnology.’’ Grout., Soil Impr. and Geosyn., ASCE-SP, (Feb.),
Rinaldi, V. A., Santamarina, J. C., and Redolfi, E. R. (1998). ‘‘Charac-       1380–1392.
  terization of collapsible soils with combined geophysical and penetra-    Skempton, A. W. (1961). ‘‘Horizontal stresses in an over-consolidated
  tion testing.’’ Proc., 1st Int. Conf. on Site Characterization, ISC’98,     Eocene clay.’’ Proc., 5th Int. Conf. for Soil Mech. and Found. Engrg.,
  P. K. Robertson and P. W. Mayne, eds., Balkema, Brookfield, 581–             Dunod, Paris, 351–357.
  588.                                                                      Stokoe, K. H., II, Lee, J. N.-K., and Lee, S. H.-H. (1991). ‘‘Characteri-
Sahimi, M. (1994). Applications of percolation theory, Taylor and Fran-       zation of soil in calibration chambers with seismic waves.’’ Proc., 1st
  cis, London.                                                                Int. Symp. on Calibration Chamber Testing, 363–376.
Santamarina, J. C., and Aloufi, M. (1999). ‘‘Small strain stiffness: A mi-   Terzaghi, K. V. (1925). ‘‘Principles of soil mechanics: I—Phenomena of
  cromechanical experimental study.’’ Proc. of Pre-failure Defor. Char.       cohesion of clay.’’ Engrg. News Record, 95(19), 742–746.
  of Geomaterials, IST99, M. Jamiolkowski, R. Lancellotta, and D. Lo        Terzaghi, K. V., and Peck, R. B. (1948). Soil mechanics and engineering
  Presti, eds., Balkema, The Netherlands, 451–458.                            practice, Wiley, New York.
Santamarina, J. C., and Cascante, G. (1996). ‘‘Stress anisotropy and wave   Trevena, D. H. (1987). Cavitation and tension in liquids, Hilger, London.
  propagation—A micromechanical view.’’ Can. Geotech. J., Ottawa, 33,       Wu, S., Gray, D. H., and Richart, F. E., Jr. (1984). ‘‘Capillary effects on
  770–782.                                                                    dynamic modulus of sands and silts.’’ J. Geotech. Engrg., ASCE,
Santamarina, J. C., and Wakim, Y. N. (1992). ‘‘Principles of ground mod-      110(9), 1188–1203.


96 / JOURNAL OF GEOTECHNICAL AND GEOENVIRONMENTAL ENGINEERING / JANUARY 2001

Más contenido relacionado

La actualidad más candente

Viscosity & stokes’ law
Viscosity & stokes’ lawViscosity & stokes’ law
Viscosity & stokes’ lawMidoOoz
 
Handout2 fluida statik
Handout2 fluida statikHandout2 fluida statik
Handout2 fluida statikmahzunputra
 
Solution of MHD Effect on Transient Free Convection Flow past a Vertical Plat...
Solution of MHD Effect on Transient Free Convection Flow past a Vertical Plat...Solution of MHD Effect on Transient Free Convection Flow past a Vertical Plat...
Solution of MHD Effect on Transient Free Convection Flow past a Vertical Plat...iosrjce
 
2 a.f.g.f. surface tension
2 a.f.g.f. surface tension2 a.f.g.f. surface tension
2 a.f.g.f. surface tensionTesfaye Kebede
 
ppt of consolidation and settlement of soil
ppt of consolidation and settlement of soilppt of consolidation and settlement of soil
ppt of consolidation and settlement of soilSAMRAT CHODHURY
 
International Journal of Computational Engineering Research(IJCER)
 International Journal of Computational Engineering Research(IJCER)  International Journal of Computational Engineering Research(IJCER)
International Journal of Computational Engineering Research(IJCER) ijceronline
 
Numerical study of non darcian natural convection heat transfer in a rectangu...
Numerical study of non darcian natural convection heat transfer in a rectangu...Numerical study of non darcian natural convection heat transfer in a rectangu...
Numerical study of non darcian natural convection heat transfer in a rectangu...Ahmed Al-Sammarraie
 
Surface tension of liquids using capilary tube
Surface tension of liquids using capilary tubeSurface tension of liquids using capilary tube
Surface tension of liquids using capilary tubeMidoOoz
 
Introduction to fluid properties
Introduction to fluid propertiesIntroduction to fluid properties
Introduction to fluid propertiesprasadbojage
 
Magneto-Thermosolutal Convection in Maxwellian Dusty Viscoelastic Fluid throu...
Magneto-Thermosolutal Convection in Maxwellian Dusty Viscoelastic Fluid throu...Magneto-Thermosolutal Convection in Maxwellian Dusty Viscoelastic Fluid throu...
Magneto-Thermosolutal Convection in Maxwellian Dusty Viscoelastic Fluid throu...IJERA Editor
 
Measurement of surface tension
Measurement of surface tensionMeasurement of surface tension
Measurement of surface tensionpankaj sharma
 
Q923+rfl+l04
Q923+rfl+l04Q923+rfl+l04
Q923+rfl+l04AFATous
 
Effects of Variable Fluid Properties and MHD on Mixed Convection Heat Transfe...
Effects of Variable Fluid Properties and MHD on Mixed Convection Heat Transfe...Effects of Variable Fluid Properties and MHD on Mixed Convection Heat Transfe...
Effects of Variable Fluid Properties and MHD on Mixed Convection Heat Transfe...IOSR Journals
 
Iso 8859-1 -mass transfer operations
Iso 8859-1 -mass transfer operationsIso 8859-1 -mass transfer operations
Iso 8859-1 -mass transfer operationsY Yunardi
 

La actualidad más candente (18)

FLUID MECHANICS
FLUID MECHANICSFLUID MECHANICS
FLUID MECHANICS
 
Viscosity & stokes’ law
Viscosity & stokes’ lawViscosity & stokes’ law
Viscosity & stokes’ law
 
Handout2 fluida statik
Handout2 fluida statikHandout2 fluida statik
Handout2 fluida statik
 
Solution of MHD Effect on Transient Free Convection Flow past a Vertical Plat...
Solution of MHD Effect on Transient Free Convection Flow past a Vertical Plat...Solution of MHD Effect on Transient Free Convection Flow past a Vertical Plat...
Solution of MHD Effect on Transient Free Convection Flow past a Vertical Plat...
 
Lecture 1_1
Lecture 1_1Lecture 1_1
Lecture 1_1
 
2 a.f.g.f. surface tension
2 a.f.g.f. surface tension2 a.f.g.f. surface tension
2 a.f.g.f. surface tension
 
ppt of consolidation and settlement of soil
ppt of consolidation and settlement of soilppt of consolidation and settlement of soil
ppt of consolidation and settlement of soil
 
International Journal of Computational Engineering Research(IJCER)
 International Journal of Computational Engineering Research(IJCER)  International Journal of Computational Engineering Research(IJCER)
International Journal of Computational Engineering Research(IJCER)
 
Numerical study of non darcian natural convection heat transfer in a rectangu...
Numerical study of non darcian natural convection heat transfer in a rectangu...Numerical study of non darcian natural convection heat transfer in a rectangu...
Numerical study of non darcian natural convection heat transfer in a rectangu...
 
Surface tension of liquids using capilary tube
Surface tension of liquids using capilary tubeSurface tension of liquids using capilary tube
Surface tension of liquids using capilary tube
 
Fmm1 1 ppt
Fmm1 1 pptFmm1 1 ppt
Fmm1 1 ppt
 
Introduction to fluid properties
Introduction to fluid propertiesIntroduction to fluid properties
Introduction to fluid properties
 
Magneto-Thermosolutal Convection in Maxwellian Dusty Viscoelastic Fluid throu...
Magneto-Thermosolutal Convection in Maxwellian Dusty Viscoelastic Fluid throu...Magneto-Thermosolutal Convection in Maxwellian Dusty Viscoelastic Fluid throu...
Magneto-Thermosolutal Convection in Maxwellian Dusty Viscoelastic Fluid throu...
 
A04402001015
A04402001015A04402001015
A04402001015
 
Measurement of surface tension
Measurement of surface tensionMeasurement of surface tension
Measurement of surface tension
 
Q923+rfl+l04
Q923+rfl+l04Q923+rfl+l04
Q923+rfl+l04
 
Effects of Variable Fluid Properties and MHD on Mixed Convection Heat Transfe...
Effects of Variable Fluid Properties and MHD on Mixed Convection Heat Transfe...Effects of Variable Fluid Properties and MHD on Mixed Convection Heat Transfe...
Effects of Variable Fluid Properties and MHD on Mixed Convection Heat Transfe...
 
Iso 8859-1 -mass transfer operations
Iso 8859-1 -mass transfer operationsIso 8859-1 -mass transfer operations
Iso 8859-1 -mass transfer operations
 

Destacado

52 уик-энда для Волгоградской области
52 уик-энда для Волгоградской области52 уик-энда для Волгоградской области
52 уик-энда для Волгоградской областиAnna Stepnova
 
Mayur barochiya's corporate governance and the public interest
Mayur barochiya's corporate governance and the public interestMayur barochiya's corporate governance and the public interest
Mayur barochiya's corporate governance and the public interestMayur Patel
 
Saba University: The ABC's of RDI (Rapid Data Import)
Saba University: The ABC's of RDI (Rapid Data Import)Saba University: The ABC's of RDI (Rapid Data Import)
Saba University: The ABC's of RDI (Rapid Data Import)Saba Software
 
Houston hug 12.4.2014
Houston hug 12.4.2014Houston hug 12.4.2014
Houston hug 12.4.2014LyntonWeb
 
Bi paper 1 yr 3
Bi paper 1 yr 3Bi paper 1 yr 3
Bi paper 1 yr 3Syida Omar
 
Системный анализ - зачем?
Системный анализ - зачем?Системный анализ - зачем?
Системный анализ - зачем?Vladimir Kalenov
 
The Venus Papers by Lydia Towsey SAMPLE
The Venus Papers by Lydia Towsey SAMPLEThe Venus Papers by Lydia Towsey SAMPLE
The Venus Papers by Lydia Towsey SAMPLEBurning Eye
 

Destacado (9)

52 уик-энда для Волгоградской области
52 уик-энда для Волгоградской области52 уик-энда для Волгоградской области
52 уик-энда для Волгоградской области
 
Ujian ptd 2012
Ujian ptd 2012Ujian ptd 2012
Ujian ptd 2012
 
Mayur barochiya's corporate governance and the public interest
Mayur barochiya's corporate governance and the public interestMayur barochiya's corporate governance and the public interest
Mayur barochiya's corporate governance and the public interest
 
Saba University: The ABC's of RDI (Rapid Data Import)
Saba University: The ABC's of RDI (Rapid Data Import)Saba University: The ABC's of RDI (Rapid Data Import)
Saba University: The ABC's of RDI (Rapid Data Import)
 
Houston hug 12.4.2014
Houston hug 12.4.2014Houston hug 12.4.2014
Houston hug 12.4.2014
 
850 pres ingles
850 pres ingles850 pres ingles
850 pres ingles
 
Bi paper 1 yr 3
Bi paper 1 yr 3Bi paper 1 yr 3
Bi paper 1 yr 3
 
Системный анализ - зачем?
Системный анализ - зачем?Системный анализ - зачем?
Системный анализ - зачем?
 
The Venus Papers by Lydia Towsey SAMPLE
The Venus Papers by Lydia Towsey SAMPLEThe Venus Papers by Lydia Towsey SAMPLE
The Venus Papers by Lydia Towsey SAMPLE
 

Similar a Cho 2001a

Fluid mechanics Cengel and Cimbala + NPTEL
Fluid mechanics Cengel and Cimbala + NPTELFluid mechanics Cengel and Cimbala + NPTEL
Fluid mechanics Cengel and Cimbala + NPTELRavi Singh Choudhary
 
Fluid mechanics ( 2019 2020)
Fluid mechanics ( 2019 2020)Fluid mechanics ( 2019 2020)
Fluid mechanics ( 2019 2020)Yuri Melliza
 
Meg 506.2 Combined heat and mass transfer a review
Meg 506.2 Combined heat and mass transfer a reviewMeg 506.2 Combined heat and mass transfer a review
Meg 506.2 Combined heat and mass transfer a reviewTeddy Adiela
 
Akiskanlar mekanigi ders_notlari (1)
Akiskanlar mekanigi ders_notlari (1)Akiskanlar mekanigi ders_notlari (1)
Akiskanlar mekanigi ders_notlari (1)AyeglCengiz2
 
FluidMech_2014_2 fluid basics fluid concept.ppt
FluidMech_2014_2  fluid basics fluid concept.pptFluidMech_2014_2  fluid basics fluid concept.ppt
FluidMech_2014_2 fluid basics fluid concept.pptkasaxif851
 
Mekanika Fluida 1 P2. Oke.pdf, Presentasi kuliah pertemuan 2 untuk mata kulia...
Mekanika Fluida 1 P2. Oke.pdf, Presentasi kuliah pertemuan 2 untuk mata kulia...Mekanika Fluida 1 P2. Oke.pdf, Presentasi kuliah pertemuan 2 untuk mata kulia...
Mekanika Fluida 1 P2. Oke.pdf, Presentasi kuliah pertemuan 2 untuk mata kulia...ujiburrahman2
 
Module 2 jif 104 liquid
Module 2 jif 104 liquidModule 2 jif 104 liquid
Module 2 jif 104 liquidKurenai Ryu
 
FluidMechanics wren 201 Lecture 1.pptx
FluidMechanics wren 201 Lecture 1.pptxFluidMechanics wren 201 Lecture 1.pptx
FluidMechanics wren 201 Lecture 1.pptxAliyuAliyu16
 
CHAPTER 2. PROPERTIES OF FLUIDS.pdf
CHAPTER 2. PROPERTIES OF FLUIDS.pdfCHAPTER 2. PROPERTIES OF FLUIDS.pdf
CHAPTER 2. PROPERTIES OF FLUIDS.pdfSang Tuấn
 
Fluids mechanics class 1 -Module 1
Fluids mechanics class 1 -Module 1Fluids mechanics class 1 -Module 1
Fluids mechanics class 1 -Module 1Mujeeb Muji
 
Water in Soil Physics
Water in Soil PhysicsWater in Soil Physics
Water in Soil PhysicsUsman Mastoi
 
Soil water potential
Soil water potentialSoil water potential
Soil water potentialssuser3604e3
 
Fluid Mechanics Chapter 2. Fluid Statics
Fluid Mechanics Chapter 2. Fluid StaticsFluid Mechanics Chapter 2. Fluid Statics
Fluid Mechanics Chapter 2. Fluid StaticsAddisu Dagne Zegeye
 

Similar a Cho 2001a (20)

Ch 1.pdf
Ch 1.pdfCh 1.pdf
Ch 1.pdf
 
Fluid mechanics Cengel and Cimbala + NPTEL
Fluid mechanics Cengel and Cimbala + NPTELFluid mechanics Cengel and Cimbala + NPTEL
Fluid mechanics Cengel and Cimbala + NPTEL
 
FM-I all slides.pdf
FM-I all slides.pdfFM-I all slides.pdf
FM-I all slides.pdf
 
section 1.pdf
section 1.pdfsection 1.pdf
section 1.pdf
 
Fluid mechanic
Fluid mechanic Fluid mechanic
Fluid mechanic
 
Fluid mechanics ( 2019 2020)
Fluid mechanics ( 2019 2020)Fluid mechanics ( 2019 2020)
Fluid mechanics ( 2019 2020)
 
Meg 506.2 Combined heat and mass transfer a review
Meg 506.2 Combined heat and mass transfer a reviewMeg 506.2 Combined heat and mass transfer a review
Meg 506.2 Combined heat and mass transfer a review
 
Akiskanlar mekanigi ders_notlari (1)
Akiskanlar mekanigi ders_notlari (1)Akiskanlar mekanigi ders_notlari (1)
Akiskanlar mekanigi ders_notlari (1)
 
FluidMech_2014_2 fluid basics fluid concept.ppt
FluidMech_2014_2  fluid basics fluid concept.pptFluidMech_2014_2  fluid basics fluid concept.ppt
FluidMech_2014_2 fluid basics fluid concept.ppt
 
Sdeco
SdecoSdeco
Sdeco
 
Mekanika Fluida 1 P2. Oke.pdf, Presentasi kuliah pertemuan 2 untuk mata kulia...
Mekanika Fluida 1 P2. Oke.pdf, Presentasi kuliah pertemuan 2 untuk mata kulia...Mekanika Fluida 1 P2. Oke.pdf, Presentasi kuliah pertemuan 2 untuk mata kulia...
Mekanika Fluida 1 P2. Oke.pdf, Presentasi kuliah pertemuan 2 untuk mata kulia...
 
Module 2 jif 104 liquid
Module 2 jif 104 liquidModule 2 jif 104 liquid
Module 2 jif 104 liquid
 
FluidMechanics wren 201 Lecture 1.pptx
FluidMechanics wren 201 Lecture 1.pptxFluidMechanics wren 201 Lecture 1.pptx
FluidMechanics wren 201 Lecture 1.pptx
 
CHAPTER 2. PROPERTIES OF FLUIDS.pdf
CHAPTER 2. PROPERTIES OF FLUIDS.pdfCHAPTER 2. PROPERTIES OF FLUIDS.pdf
CHAPTER 2. PROPERTIES OF FLUIDS.pdf
 
Fluids mechanics class 1 -Module 1
Fluids mechanics class 1 -Module 1Fluids mechanics class 1 -Module 1
Fluids mechanics class 1 -Module 1
 
Water in Soil Physics
Water in Soil PhysicsWater in Soil Physics
Water in Soil Physics
 
hoff-lecture.pptx
hoff-lecture.pptxhoff-lecture.pptx
hoff-lecture.pptx
 
Soil water potential
Soil water potentialSoil water potential
Soil water potential
 
Fluid Mechanics Chapter 2. Fluid Statics
Fluid Mechanics Chapter 2. Fluid StaticsFluid Mechanics Chapter 2. Fluid Statics
Fluid Mechanics Chapter 2. Fluid Statics
 
Liquid state
Liquid stateLiquid state
Liquid state
 

Cho 2001a

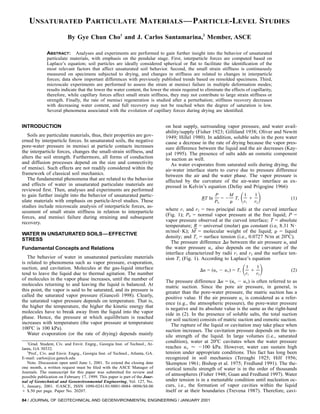
  • 1. UNSATURATED PARTICULATE MATERIALS —PARTICLE-LEVEL STUDIES By Gye Chun Cho1 and J. Carlos Santamarina,2 Member, ASCE ABSTRACT: Analyses and experiments are performed to gain further insight into the behavior of unsaturated particulate materials, with emphasis on the pendular stage. First, interparticle forces are computed based on Laplace’s equation; soil particles are ideally considered spherical or flat to facilitate the identification of the most relevant factors that affect unsaturated soil behavior. Second, the small strain stiffness is continuously measured on specimens subjected to drying, and changes in stiffness are related to changes in interparticle forces; data show important differences with previously published trends based on remolded specimens. Third, microscale experiments are performed to assess the strain at menisci failure in multiple deformation modes; results indicate that the lower the water content, the lower the strain required to eliminate the effects of capillarity, therefore, while capillary forces affect small strain stiffness, they may not contribute to large strain stiffness or strength. Finally, the rate of menisci regeneration is studied after a perturbation; stiffness recovery decreases with decreasing water content, and full recovery may not be reached when the degree of saturation is low. Several phenomena associated with the evolution of capillary forces during drying are identified. INTRODUCTION on heat supply, surrounding vapor pressure, and water avail- ability/supply (Fisher 1923; Gilliland 1938; Oliver and Newitt Soils are particulate materials, thus, their properties are gov- 1949; Hillel 1980). In addition, soluble salts in the pore water erned by interparticle forces. In unsaturated soils, the negative cause a decrease in the rate of drying because the vapor pres- pore-water pressure in menisci at particle contacts increases sure difference between the liquid and the air decreases (Kay- the interparticle forces, changes the small-strain stiffness, and yal 1995). The presence of salts adds an osmotic component alters the soil strength. Furthermore, all forms of conduction to suction as well. and diffusion processes depend on the size and connectivity As water evaporates from saturated soils during drying, the of menisci. Such effects are not readily considered within the air-water interface starts to curve due to pressure difference framework of classical soil mechanics. between the air and the water phase. The vapor pressure is The fundamental phenomena that are related to the behavior affected by the curvature of the air-water interface as ex- and effects of water in unsaturated particulate materials are pressed in Kelvin’s equation (Defay and Prigogine 1966) ͩ ͪ reviewed first. Then, analyses and experiments are performed to gain further insight into the behavior of unsaturated partic- P M 1 1 RT ln = Ϫ Ts ϩ (1) ulate materials with emphasis on particle-level studies. These P0 ␳ r1 r2 studies include microscale analysis of interparticle forces, as- sessment of small strain stiffness in relation to interparticle where r1 and r2 = two principal radii at the curved interface forces, and menisci failure during straining and subsequent (Fig. 1); P0 = normal vapor pressure at the free liquid; P = recovery. vapor pressure observed at the curved interface; T = absolute temperature; R = universal (molar) gas constant (i.e, 8.31 N и m/mol и K); M = molecular weight of the liquid; ␳ = liquid WATER IN UNSATURATED SOILS—EFFECTIVE density; and Ts = surface tension (i.e., 0.0727 N/m at 20ЊC). STRESS The pressure difference ⌬u between the air pressure ua and Fundamental Concepts and Relations the water pressure uw also depends on the curvature of the interface characterized by radii r1 and r2 and the surface ten- The behavior of water in unsaturated particulate materials sion Ts (Fig. 1). According to Laplace’s equation ͩ ͪ is related to phenomena such as vapor pressure, evaporation, suction, and cavitation. Molecules at the gas-liquid interface 1 1 ⌬u = (ua Ϫ uw) = Ts ϩ (2) tend to leave the liquid due to thermal agitation. The number r1 r2 of molecules in the vapor phase increases, until the number of The pressure difference ⌬u = (ua Ϫ uw) is often referred to as molecules returning to and leaving the liquid is balanced. At matric suction. Since the pore air pressure, in general, is this point, the vapor is said to be saturated, and its pressure is greater than the pore-water pressure, the matric suction has a called the saturated vapor pressure (Giancoli 1998). Clearly, positive value. If the air pressure ua is considered as a refer- the saturated vapor pressure depends on temperature. That is, ence (e.g., the atmospheric pressure), the pore-water pressure the higher the temperature, the higher the kinetic energy that is negative and its absolute value is the same as the right-hand molecules have to break away from the liquid into the vapor side in (2). In the presence of soluble salts, the total suction phase. Hence, the pressure at which equilibrium is reached (or soil suction) consists of matric suction and osmotic suction. increases with temperature (the vapor pressure at temperature The rupture of the liquid or cavitation may take place when 100ЊC is 100 kPa). suction increases. The cavitation pressure depends on the ten- Water evaporation (or the rate of drying) depends mainly sile strength of the liquid. In large volumes (i.e., saturated 1 Grad. Student, Civ. and Envir. Engrg., Georgia Inst. of Technol., At- condition), water at 20ЊC cavitates when the water pressure lanta, GA 30332. reaches uw Ϸ Ϫ100 kPa. However, water can sustain high 2 Prof., Civ. and Envir. Engrg., Georgia Inst. of Technol., Atlanta, GA. tension under appropriate conditions. This fact has long been E-mail: carlos@ce.gatech.edu recognized in soil mechanics (Terzaghi 1925; Hilf 1956; Note. Discussion open until June 1, 2001. To extend the closing date Skempton 1961; Bishop et al. 1975; Fredlund 1991). The the- one month, a written request must be filed with the ASCE Manager of oretical tensile strength of water is in the order of thousands Journals. The manuscript for this paper was submitted for review and possible publication on February 17, 1999. This paper is part of the Jour- of atmospheres (Fisher 1948; Guan and Fredlund 1997). Water nal of Geotechnical and Geoenvironmental Engineering, Vol. 127, No. under tension is in a metastable condition until nucleation oc- 1, January, 2001. ᭧ASCE, ISSN 1090-0241/01/0001-0084–0096/$8.00 curs, i.e., the formation of vapor cavities within the liquid ϩ $.50 per page. Paper No. 20207. itself or at their boundaries (Trevena 1987). Therefore, cavi- 84 / JOURNAL OF GEOTECHNICAL AND GEOENVIRONMENTAL ENGINEERING / JANUARY 2001
  • 2. FIG. 1. Microscale Models—Schematic Representation: (a) Spherical Particles; (b) Forces Involved; (c) Disk Particles tation is hindered in the absence of cavitation nuclei and ex- the axis-translation technique, as discussed in Fredlund and perimental values as low as Ϫ17 MPa (Ϫ170 atm) have been Rahardjo 1993). Additionally, from Kelvin’s equation, total obtained (Marinho and Chandler 1995). suction can be inferred from the vapor pressure, or measured with psychrometers, for example, in the pendular stage. How- Stages of Saturation ever, as discussed above, salts affect the vapor pressure, thus psychrometers sense both the pore-water pressure (air pressure Different stages of saturation can be identified. As water is presumed atmospheric) and the osmotic suction. Values of begins evaporating or draining from a saturated soil, the out- matric suction can vary from as low as 10Ϫ1 kPa in clean sands side menisci at boundaries are pulled inward and the suction to more than 103 kPa in clays. pressure increases [as predicted by (2)]. While the change in water content is very small, the change in pore-water pressure Effective Stress—Macroscale has an important global effect on the soil mass which remains saturated away from the boundary. Equilibrium analysis in saturated media leads to Terzaghi’s The pressure when the air phase breaks through into the effective stress pore structure is called the air-entry value (also known as bub- ␴Ј = ␴ Ϫ uw (3) bling pressure or threshold pressure) (Bear 1979; Kohgo et al. 1993; Aubertin et al. 1998). The air-entry value depends on Likewise, the negative pore-water pressure that develops in an the pore size, thus, the finer the particles the smaller the pore unsaturated medium affects the effective interparticle forces. throats and the higher the air-entry value. Air entry generally However, the equilibrium analysis must take into consideration occurs between saturation S = 0.9 and S = 1.0. the reduced area occupied by the water in the pores. Bishop Once air breaks in, the soil mass becomes unsaturated, yet, (1959, 1961) proposed a modified expression for the effective the water still forms a continuous phase. This is the funicular stress in an unsaturated soil stage (Newitt and Conway-Jones 1958; Pietsch 1991; Lever- son and Lohnes 1995). As drying proceeds, the suction pres- ␴Ј = (␴ Ϫ ua) ϩ ␹(ua Ϫ uw) (4) sure increases gradually, following a quasi-linear trend with where ␹ = parameter to be experimentally determined. To a decreasing saturation. Any local change in water pressure is first approximation, the parameter ␹ varies with the degree of rapidly homogenized throughout the mass by pressure diffu- saturation, from ␹ Ϸ 1 for saturated soils, to ␹ = 0 for dry sion within the continuous water phase. The drying rate is soils (Aitchison and Donald 1956; Aitchison 1960; Blight rather constant in this region. 1967). However, ␹ also depends on wetting history, loading The pendular stage begins when water becomes discon- path, soil type, internal structure of the soil, and specimen size nected. Water rings form around particle contacts, and only an near percolation (as mentioned above). Still, the inadequacy adsorbed film may be present on particle surfaces (Leverson in Bishop’s equation goes beyond the difficulty in predicting and Lohnes 1995). The radii of menisci are small, thus the the value of ␹, and it can fail to explain phenomena such as suction pressure increases significantly. Because this is only a the collapse of some soils upon wetting (uw decrease ␴Ј de- contact-level effect, a change in suction within a meniscus is creases, yet massive volume change takes place). felt at other menisci through the corresponding change in va- The limitations in Bishop’s equation can be discussed from por pressure [(1)]. This is a slow homogenization process. The different perspectives. On the one hand, it involves a soil pa- drying rate in this stage is increasingly lower. rameter ␹ as in a constitutive equation rather than being a Since an unsaturated soil implies a mixed fluid phase, two description of the state of stress. On the other hand, it mixes percolation thresholds can be identified according to the con- global and local conditions. In Terzaghi’s effective stress equa- tinuity of each phase. One threshold corresponds to the tion for saturated media, both pore pressure and total stress formation of a continuous gas phase path. This threshold are boundary actions; however, the pore-water pressure in un- separates regimes with very different coefficients of air per- saturated soils causes a local action at the particle level (this meability. The other percolation threshold Sc occurs when a is more readily seen in the pendular regime but it is the case continuous water film forms across the particulate medium, in the funicular regime as well). i.e., the boundary between the pendular and the funicular re- Today’s macroscale interpretation of unsaturated materials gimes. Electrical conduction and chemical diffusion in unsat- is based on separate state variables, such as (ua Ϫ uw) and (␴ urated media rapidly increase when the degree of saturation Ϫ ua) to avoid such limitations (Bishop and Blight 1963; Fred- exceeds Sc. Both percolation thresholds are different during lund et al. 1978). drying or wetting processes. Furthermore, given the fractal na- ture of the connectivity structure of a phase near percolation, MICROSCALE ANALYSIS measured parameters depend on specimen size (Sahimi 1994). The matric suction can be measured with general tensiom- The equivalent effective stress ␴Ј , due to capillarity is eq eters up to 1 atm, or through high air entry ceramics above 1 herein defined as the effective boundary stress that should be atm (cavitation within the measurement system is avoided by applied to a dry or saturated soil specimen to cause similar JOURNAL OF GEOTECHNICAL AND GEOENVIRONMENTAL ENGINEERING / JANUARY 2001 / 85
  • 3. interparticle contact forces. The following study starts with Meanwhile, considering the geometry of the meniscus between Laplace’s relation [i.e., (2)] and leads to the prediction of the two particles, the volume of the meniscus can be calculated in equivalent effective stress as a function of water content, and terms of particle diameter and the meniscus’s radii. Further- particle size or specific surface. The purpose of the microscale more, the volume calculated can be related to the water content analyses is not to predict field parameters, but to highlight the w. For the SC packing, the water content becomes ͩ ͪͫ ͩ ͪͬ interplay between the variables involved. Soil particles are ide- alized as either spheres or flat disks. 9 ␣4 ␣(2 Ϫ ␣) 2(1 Ϫ ␣) SC w = 1Ϫ arcsin 8Gs 1 Ϫ ␣2 2(1 Ϫ ␣) ␣2 ϩ 2(1 Ϫ ␣) Spherical Particles (9) Consider two spherical particles of radius R in contact [Fig. where Gs = specific gravity [the complete derivation of equa- 1(a)]. The water meniscus between them is bound by the two tions presented in this paper and associated parametric studies particles and by an imaginary torus. The small radius of this can be found in Cho and Santamarina (1999)]. For small val- doughnut shaped torus is r1, and the distance from the center ues of ␣, the first order Taylor expansion of (9) becomes to the inside wall of the torus is r2 (this is the inner radius of 9␣4 the torus; it is a negative value in the case of a torus). From SC w = (10) geometric considerations 8Gs (R ϩ r1)2 = R 2 ϩ (r1 ϩ r2)2 (5a) Finally, the equivalent effective stress due to capillarity can be expressed in terms of the water content. Using the approx- Hence imation for w, (8) becomes ͫ ͩ ͪͬ 1/4 r2 ␲Ts 8 SC ␴Ј = 2Ϫ 2 r1 = (5b) eq Gsw (11) (2R Ϫ 2r2) 4R 9 The selection of the torus geometry implies several as- The geometric restrictions for the torus geometry and the pen- sumptions. First, the contact angle between the water and the dular regime correspond to a water content w Յ 0.063 for the surface of the particles is assumed to be zero and the particles SC packing regardless of the grain size R. are assumed to be perfectly smooth. Second, the effect of grav- A similar analysis can be applied to a tetrahedral (TH) pack- ity on the geometry of the meniscus is ignored (i.e., the pore- ing (coordination number 12, void ratio 0.34). For the same water pressure gradient is negligible relative to the average size of the menisci ␣ = r2 /R the water content in a tetrahedral pressure). Finally, the torus is only a convenient approximation packing is twice the water content in a simple cubic packing to the true geometry of the meniscus, amenable to analytical computations. Indeed, constant pressure in the water implies TH [w(␣)]TH = 2[w(␣)]SC (12) constant mean curvature according to Laplace’s relation, yet The equivalent effective stress in this case is the radius of curvature r2 varies along the surface of the torus while the r1 curvature is constant [Fig. 1(a)]. In fact, the cor- TH [␴Ј ]TH = 2͙2[␴Ј ]SC eq eq (13) rect geometry approaches a catenoid. Nevertheless, parameters computed using the torus geometry are similar to numerical The geometric restrictions for the torus geometry and the pen- results obtained with catenoids. Fisher (1926) showed the error dular regime correspond to a water content w Յ 0.032 for the to be small at low water contents, increasing up to 2% at the tetrahedral packing. It is important to note that the soil struc- limit of the pendular regime (Gili 1988). ture for uniformly graded sands at the microscale can be con- Eq. 2 can be rewritten in terms of ␣, the ratio of r2 to R, strained between the simple cubic packing and the tetrahedral by substituting (5) into (2) packing. ͩ ͪ The distribution of water is not necessarily homogeneous in Ts 2 an unsaturated soil. The normalized vapor pressure P/P0 , com- ⌬u = (ua Ϫ uw) = Ϫ3 (6) puted with Kelvin’s equation is plotted in Fig. 2 versus the R␣ ␣ water content w for different particle sizes R, i.e., SC packing The force that the meniscus produces on the particle must is assumed; radii are expressed in terms of water content as include not only the pressure of the water acting on the cross- per (10). It can be seen that at the same vapor pressure (as- sectional area of the meniscus (i.e., matric suction) but the sumed homogeneous in the soil mass), the water content in- surface tension acting along the perimeter [Fig. 1(b)]. So the force F between two particles becomes F = ⌬u(␲r 2) ϩ Ts(2␲r2) 2 (7) The force contributed by the surface tension along the perim- eter has been disregarded by several authors, even though this omission was highlighted as early as 1926 by Fisher. Its im- portance increases with water content (within the geometric limits of meniscus-based analysis) e.g., for w = 0.02 the error is 250%, and for w = 0.04 the error is 400%. The equivalent effective stress ␴Јq due to capillarity can be e estimated for a given particle packing. In the case of a simple cubic (SC) packing (coordination number 6, void ratio 0.91), the force F is spread over the effective area occupied by a particle 4R 2. Combining results from (6) and (7), the equiva- lent effective stress becomes F ␲Ts SC ␴Ј = eq = (2 Ϫ ␣) (8) FIG. 2. Relationship between Normalized Vapor Pressure, Wa- 4R 2 4R ter Content, and Particle Size 86 / JOURNAL OF GEOTECHNICAL AND GEOENVIRONMENTAL ENGINEERING / JANUARY 2001
  • 4. creases with decreasing particle size. Therefore, the spatial tion [(2)]. The suction pressure then becomes a function of the variation in local water content (pendular regime) will reflect radius r1. On the other hand, the separation distance between the spatial variation in local grain size distribution. two particles t is twice the radius r1. Hence, the water content w in equally spaced parallel plates is ͩ ͪ Modification for Hertzian Contact Area Ww A(2r1)␥w 2A ␥w ␥w The previous solution presumes that the area of the contact w= = = r1 = Ssr1 (15) Ws Ws Ws /g g g itself is nil. However, the capillary force and externally applied stresses cause the particles to deform. What is the magnitude where Ww and Ws = weights of water and solid, respectively; of this effect? Let us consider two spheres of equal radius. A = surface area of one plate; ␥w = unit weight of water; Ss = Upon the application of a normal contact force F the contact specific surface; and g = acceleration due to gravity. Solving point becomes a flat circular area of contact radius a. The size (15) for r1 and replacing in Laplace’s equation, the suction of this contact area depends on the shear modulus G and Pois- pressure ⌬u becomes ͩͪ ͩ ͪ son’s ratio ␯ of the material of the particle, and on the radius R of the sphere, as predicted by Hertz theory 1 Ss␥w ⌬u = Ts = Ts (16) ͱ r1 wg 3 3(1 Ϫ ␯) a= FR (14) For this disk geometry, the equivalent effective stress contrib- 8G uted by capillarity is ␲/4 of the suction pressure (the force In an unsaturated soil, the area affected by the meniscus component due to the surface tension also vanishes when r2 becomes altered by the area of the contact, as does the cur- > r1). Particle size is not present in this equation. Instead, > vature r1 for a given volume of water in the meniscus. There specific surface appears as a more meaningful parameter in the is no exact solution for this problem, and an iterative proce- context of small platy particles. The effect of small, high-spe- dure is required: (1) The stress is computed taking into con- cific surface particles on capillarity has been recognized in the sideration capillary forces; (2) the area of the Hertzian contact development of empirical equations in terms of D10 [e.g., Ter- is computed with (14); (3) the capillary force is recalculated zaghi and Peck (1948)]. taking into consideration the reduction in the cross section of As water dries, either the particles move closer together the meniscus; and (4) a new value of stress is obtained. The (i.e., smaller r1) or the meniscus recedes between the particles procedure is repeated until the computed stress converges. In at constant r1. The parallel particle model applies to dispersed- Fig. 3, the equivalent combined stress (i.e., sum of the equiv- aggregated systems (e.g., face-to-face contact). The analysis of alent effective stress due to capillarity and the applied stress flocculated fabrics with edge-to-face contacts leads to a lesser due to external confinement) in the unsaturated soil is plotted effect of capillarity on interparticle forces. While the previous versus the applied stress. The particle size (R = 1 ␮m), the analysis considers only the force contributed by capillarity on particle stiffness (G = 3.7 GPa), and the degree of saturation perfectly smooth disks, the analysis of equilibrium must also (S = 3 и 10Ϫ6) for simple cubic packing were selected to high- include the localized reaction at asperities and interparticle light the effect. The lower dotted line is the 1:1 relation for a electrical forces (Nagaraj and Srinivasa Murthy 1985; Fam and dry soil, i.e., with no capillary forces. The upper dashed line Santamarina 1996). includes the effect of external confinement and the effect of capillarity uncorrected for contact area. The continuous line is RESULTS AND DISCUSSION the corrected solution obtained with the iterative procedure to correct for contact area. Results show the increased effect of Fig. 4 shows the variation in equivalent effective stress due capillarity at low confinement, and the vanishing effect of cap- to capillarity versus the water content for both spherical and illarity at high confining stress. disk-shaped particles (Gs = 2.65) [(11), (13), and (16)]. The equivalent effective stress increases with decreasing water con- Flat Particles tent, decreasing particle size, increasing specific surface, and increasing coordination. If plate particles are analyzed as disks with radius r2 > r1 > Note the relatively limited sensitivity of the equivalent ef- [Fig. 1(c)], the term 1/r2 can be neglected in Laplace’s equa- fective stress to water content in spherical particles as com- pared to flat particles. Indeed, as the water content decreases, the negative pressure in the meniscus increases drastically, but the effective area of the meniscus between spherical particles decreases as well. On the other hand, the effective area in flat particles remains constant, assuming that particles move closer together. Several restrictions of the models are identified in the figure. The geometric limits (x and xЈ) are derived from the torus geometry. The limit for cavitation (y) is also shown; the lo- cation of this boundary depends on the assumed cavitation pressure for the fluid (for illustration, a cavitation pressure of 1 MPa is selected). The equivalent effective stress contributed by capillarity will disappear when the negative pressure ex- ceeds the cavitation pressure. The upper limit (Ž) shown for flat particles corresponds to an interparticle distance (2 и r1) equal to ten times the molecular diameter in (16). There are other factors in real soils that increase strength and stiffness at low saturation. As water dries, fines migrate to contacts, and form buttresses between larger particles. These buttresses increase the stiffness of the granular skeleton FIG. 3. Combined Stress Taking into Consideration Applied formed by the coarser grains. At the same time, the ionic con- Effective Stress and the Contact-Level Capillary Force centration in the pendular water increases and eventually JOURNAL OF GEOTECHNICAL AND GEOENVIRONMENTAL ENGINEERING / JANUARY 2001 / 87
  • 5. FIG. 4. Equivalent Effective Stress versus Gravimetric Water Content reaches saturation causing the precipitation of salt crystals be- tion to predict the optimum degree of saturation (Sopt) corre- tween the two contacting particles. Salt precipitation also in- sponding to the peak of the shear-wave velocity Vs creases the stiffness of the particulate skeleton. This phenom- Sopt = [Ϫ6.5 log(D10) ϩ 1.5]/100 (18) enon is readily seen with optical microscopy by observing the desiccation of a saltwater meniscus between two glass bead where D10 = 10% effective grain size (mm). However, it is particles. Finally, two particles can become ionically bonded clearly observed under optical microscopy that two surface- at low water content (e.g., a calcium ion Caϩϩ can bond two wet particles do not form a meniscus when brought into con- negative charges on the surfaces of contacting particles). It is tact unless the water film is fairly thick. Therefore, the spec- expected that these phenomena produce effects similar to ce- imen preparation method followed by Wu et al. (1984) and mentation; this is the case of loess (Rinaldi et al. 1998). Qian et al. (1991, 1993) is adequate to study freshly remolded unsaturated soils, but it does not apply to soils that have been SMALL STRAIN STIFFNESS subjected to gradual drying. Thus, the applicability of (18) should be restricted to freshly remolded soils. The shear wave velocity Vs in a homogeneous, isotropic continuum can be expressed in terms of shear modulus G and Experimental Device and Procedure mass density ␳ In order to explore the implications of capillarity on stiff- Vs = ͱG ␳ (17) ness at low water contents without remolding the specimen, drying tests were performed while monitoring the specimen with shear waves. The oedometric cell described in Fam and The shear modulus in particulate materials depends on the ef- Santamarina (1995) was modified for this purpose [Fig. 5(a)]. fective interparticle contact forces and the ensuing contact The cell diameter and height were selected as a compromise stiffness. As shown above, the presence of water in unsaturated between accuracy in travel time measurements, side friction, particulate materials increases the contact forces, but it also and duration of drying. The Plexiglas shell, the Plexiglas base, increases the density of the medium. and the brass upper plate (weight 11.8 N; applied vertical ef- fective stress = 1.5 kPa) were all machined within 0.05 mm Previous Studies tolerance. The Plexiglas shell was perforated, and a cotton threadlike wick was installed in each hole to facilitate evap- The effect of capillarity on the shear-wave velocity in soils oration and to favor a homogeneous water distribution. Pie- was studied by Wu et al. (1984) and Qian et al. (1991, 1993). zocrystal bender elements (Morgan Matroc Inc., Bedford, In those studies, sands were mixed with distilled water to a Ohio) were mounted on the top and bottom platens to send preselected degree of saturation. The mixture was placed in an and to receive shear waves. Crystals were insulated with a airtight container and stored for at least 24 h to ensure uniform double coating of polyurethane, and encapsulated inside resin water distribution. Specimens were then prepared by com- to fix them to the platens. pacting the wet soil to the required void ratio, and tested in a The experimental setup is shown in Fig. 5(b). A Krohn-Hite resonant column. Wu et al. (1984) obtained an empirical equa- Signal Generator Model 1400A was used to feed a square 88 / JOURNAL OF GEOTECHNICAL AND GEOENVIRONMENTAL ENGINEERING / JANUARY 2001
  • 6. FIG. 5. (a) Schematic Cell Design (All Dimensions in Millimeters); (b) Experimental Setup TABLE 1. Tested Materials—Properties (14)]. The mixture of glass beads and kaolinite was used to Glass Granite Sandboil increase the specific surface; the resulting specimen has a pro- Material bead Kaolinite powder sand nounced gap-graded distribution. Granite powder is a byprod- (1) (2) (3) (4) (5) uct of rock crushing during the production of aggregates for concrete, and it is a well-graded material composed of angular D10 (␮m) 260 1 17 170 D50 (␮m) 320 5 89 360 grains (Cc = 1.1; Cu = 6.2). The sandboil sand is a natural soil Specific gravity 2.46 2.70 2.75 2.62 from a paleoliquefaction site in mid-America. Specific surface (m2/g) 10Ϫ2 a 13b 1.5b 1.1b The materials were mixed with distilled water at saturated a Data estimated from particle size. conditions, and gradually poured into the cell. Kneading fa- b Calibrated absorption methods. cilitated the densification of materials and the removal of air bubbles. Glass beads were extensively washed in deionized water to avoid salt precipitation at low water contents. TABLE 2. Composition, Void Ratio, and Test Type for Each Tests were run in an incubator at 50ЊC to speed drying. Specimen Temperature was kept constant to avoid changes in surface Composition of Materials tension (surface tension decreases with increasing tempera- ture), and changes in confinement due to the expansion and Glass Granite Sandboil Speci- bead Kaolinite powder sand Void shrinkage of the cell. The specimen was suspended with a wire men (%) (%) (%) (%) ratio Test type inside the incubator. The wire acted on an external scale that (1) (2) (3) (4) (5) (6) (7) allowed the weight of the specimen to be monitored, in order to compute the water content or the degree of saturation. I 100 — — — 0.601 Drying II 80 20 — — 0.564 Drying The measured shear-wave velocity is plotted versus the cor- III — — 100 — 0.692 Drying responding degree of saturation in Fig. 7. When the degree of IV — — — 100 0.507 Drying saturation decreases from the saturated condition (S = 1.0) to V 100 — — — 0.553 Recovery the dry condition (S = 0), the shear-wave velocity increases in all specimens. A detailed discussion follows for each material. pulse to the lower bender element. Signals detected with the Results for Clean Glass Beads upper crystal were amplified with a Krohn-Hite Multi Channel Filter-Amplifer Model 3364, and digitized with a Rapid Sys- The shear-wave velocity in the glass bead specimen reaches tems digital storage oscilloscope Model R1016. The average a peak and decreases abruptly as drying continues [Fig. 7(a)]. of 256 stacked signals was stored in a personal computer. In the ideal case of spherical particles and constant fabric, the The tested specimens included glass beads (spherical par- shear-wave velocity is proportional to the effective stress as ticles), a mixture of glass beads and kaolinite (flat particles; Vs ϰ ␴Ј1/6 (Hertzian contact). Therefore, the trend Vs Ϫ S is clay), granite powder (angular particles; silt), and sand ob- smoother than the suction-saturation trend. Pore size governs tained from a liquefied site in Blytheville, Arkansas (sandboil the magnitude of the effective stress increase in the region of sand). Tables 1 and 2 summarize relevant information for these funicular water. The gentle slope between points A and B sug- materials used and the tested specimens. Particle size distri- gests monosized pores. Indeed, it is unlikely that a uniform butions are shown in Fig. 6; these plots have been purposely coarse-grained soil will form a dual porosity medium. rotated 90Њ to facilitate comparison with other results. Glass The negative pore-water pressure in the pendular region (to beads were used to approximate the theoretical model [(5)– the left of point B) causes a strong increase in shear-wave JOURNAL OF GEOTECHNICAL AND GEOENVIRONMENTAL ENGINEERING / JANUARY 2001 / 89
  • 7. FIG. 6. Particle Size Distributions for Different Materials: (a) Glass Beads; (b) Mixture of Kaolinite and Glass Beads; (c) Granite Pow- der; (d) Sandboil Sand velocity. The degree of saturation at peak shear-wave velocity tacts, bonding due to ion sharing, and salt precipitation are is S = 0.007. For comparison, for freshly remolded specimens expected as drying proceeds beyond point C to the peak ve- (18) predicts the peak in stiffness at Sopt = 0.053. The drop in locity at S = 0. stiffness between the peak and the perfectly dry state may reflect several internal mechanisms. For example, menisci may Results for Granite Powder form between particles that remain separated by a short dis- The shear-wave velocity in the granite powder specimen tance; as water evaporates, menisci between noncontacting increases continuously and shows no drop even at the perfectly particles fail earlier than menisci between particles in contact dry condition S = 0 [Fig. 7(c)]. The shear-wave velocity for (a similar analysis could be extended to the effect of surface the dry specimen is approximately eight times larger than for roughness). Therefore, the loss in equivalent effective stress the saturated specimen. It is expected that stiffening mecha- contributed by capillarity is a gradual process that starts before nisms at low saturation may explain the jump in shear-wave the specimen is completely dry, even if particles are of uniform velocity near S = 0 in this specimen as well, i.e., fines migra- size. Finally, the difference between the velocities at S = 0 and tion to contacts, salt precipitation, and bonding. When the at S = 1.0 cannot be fully accounted for by changes in mass specimen is resaturated by flooding, the shear wave velocity density. An increase in internal coordination during drying and drops to its initial value [square points in Fig. 7(c)]. This result residual compressive stress are expected. suggests that the light cementation that develops during drying disappears upon wetting. Results for Kaolinite-Glass Beads The optimum degree of saturation calculated with the em- pirical relation for remolded specimens [(18)] predicts the peak The shear wave velocity in the kaolin-glass beads specimen in stiffness for the granite powder specimen at Sopt = 0.11. increases in three distinct steps and shows no drop even at the However, the measured peak shear-wave velocity in the un- dry condition [Fig. 7(b)]. In fact, the shear-wave velocity at S disturbed specimen is 1.7 times greater than that at Sopt = 0.11. = 0 is 18 times larger than the velocity at S = 1.0. The em- pirical equation for remolded specimens [(18)] predicts a peak Results for Sandboil Sand in stiffness at an optimal saturation of Sopt = 0.21. The mea- sured shear-wave velocity almost doubles between Sopt = 0.21 The shear-wave velocity for the sandboil sand specimen in- and S = 0 in this undisturbed specimen. The specimen did not creases continuously and shows no drop even at the perfectly develop any crack and the observed shrinkage was negligible. dry condition S = 0 [Fig. 7(d)]. The shear-wave velocity for Clearly, glass beads formed a granular skeleton that prevented the dry sand is nearly two times greater than for the saturated shrinkage and cracking of the specimen. When the specimen sand. The optimum degree of saturation calculated with (18) was sectioned after the test, quasi-spherical cavities, like bub- is Sopt = 0.065. The measured peak shear-wave velocity in the bles, could be seen throughout, and clay particles had moved undisturbed specimen is 1.6 times greater than the shear-wave toward glass bead contacts. Clay-based strengthening of con- velocity at Sopt. 90 / JOURNAL OF GEOTECHNICAL AND GEOENVIRONMENTAL ENGINEERING / JANUARY 2001
  • 8. FIG. 7. Shear-Wave Velocity versus Degree of Saturation for Different Materials: (a) Clean Glass Beads (Deionized Water); (b) Mixture of Kaolinite and Glass Beads; (c) Granite Powder; (d) Sandboil Sand Comparison between Microscale-Based Predictions by knowing the parameter ␤ and estimating ␴Јq using either e and Experimental Results the spherical or the flat particle models. The shear-wave velocities predicted with (20) for the four Empirical expressions for shear-wave velocity Vs have been specimens at three levels of saturation (i.e., S = 0.05, 0.1, and proposed for particulate materials in terms of the state of ef- 0.15) are compared against the measured values in Fig. 8. The fective stress (Stokoe et al. 1991; Santamarina and Cascante coefficient of lateral earth pressure was assumed to be K0 = 1996) 1 Ϫ sin ␾ in this analysis. Measured values for the glass beads ͩ ͪ and the sandboil sand specimens are well predicted using the ␤ ␴Ј ϩ ␴Ј Vs = ␪ v h (19) spherical particle model, and ␤ = 1/6 for the glass beads and 2pa ␤ = 0.22 for the sandboil sand. However, since the finer frac- where ␪ and ␤ = empirical parameters; ␴Ј and ␴Ј = vertical tion has an important role in the global stiffness, measured v h and horizontal effective stress, respectively; and pa = atmo- spheric pressure used for dimensionality. Suggested values for ␤ are (Santamarina and Aloufi 1999): ␤ = 1/6 for Hertzian contact, ␤ = 1/4 for plastic spherical contact and for cone-to- phase contact (angular or rough particles), ␤ Х 0.2 to 0.25 for sands (the looser the sand the higher ␤), and ␤ Х 0.27 to 0.30 for kaolin. Eq. (19) is used to compute the shear-wave velocity at a given saturation S, [Vs]S , in terms of the shear-wave velocity at saturation S = 1.0, [Vs]S=1 , taking into consideration the changes in mass density [for saturated conditions in an oed- ometer ␴Ј ϩ ␴Ј = (1 ϩ K0)␴Ј, while ␴Ј due to capillarity is v h v eq considered isotropic] ͫ ͬͱ ␤ 2␴Ј e ϩ Gs 1ϩ eq [Vs]S = [Vs]S =1 (20) (1 ϩ K0)␴Ј v eS ϩ Gs where ␴Јq = equivalent effective stress due to capillarity at a e given degree of saturation S; e = void ratio; Gs = specific gravity; and K0 = coefficient of lateral earth pressure at rest. Hence, the shear-wave velocity at a given saturation S can be FIG. 8. Comparison between Measured and Predicted Shear- predicted from the shear-wave velocity at saturation S = 1.0 Wave Velocities JOURNAL OF GEOTECHNICAL AND GEOENVIRONMENTAL ENGINEERING / JANUARY 2001 / 91
  • 9. FIG. 9. Drying Rate versus Degree of Saturation in Incubator at 50؇C for Different Materials: (a) Clean Glass Beads (Deionized Water); (b) Mixture of Kaolinite and Glass Beads; (c) Granite Powder; (d) Sandboil Sand velocities for the kaolinite-glass beads and the granite powder EXPERIMENTAL STUDY OF MENISCI FAILURE AND specimens cannot be explained by the spherical particle model. RECOVERY Predictions shown in Fig. 8 correspond to the flat particle Shear deformation involves particle displacement and par- model, and ␤ = 0.27 for kaolinite-glass beads and ␤ = 0.24 ticle rotation. When an unsaturated soil is subjected to shear, for granite powder. menisci are strained and may eventually break causing a re- The maximum shear wave velocity [Vs]max that is reached duction in the capillary effect. When the strain in a soil ex- by these specimens (at S = 0) can be estimated as ceeds the strain that menisci can sustain, both soil strength and stiffness are affected. The purpose of this study is to determine [Vs]max = 2,200/͙D10 (for 5 ␮m Յ D10 Յ 300 ␮m) (21) the strain at menisci failure and its dependency on water con- tent, by performing microscale tests and analyses. Then, an where [Vs]max is in meters per second; and D10 is in microm- assessment of menisci regeneration is attempted. eters. The parallelism between the grain-size distribution plots Menisci Failure (Fig. 6) and the shear-wave velocity plots (Fig. 7) is noticea- ble, highlighting the importance of grain-size distribution on Microscale tests were conducted with two glass beads (di- capillarity. A similar observation has been made in the context ameter D = 1.6 mm) under optical microscopy (ϫ150). The ¨ of water retention curves [e.g., Oberg (1997)]. glass beads were cleaned with distilled water before testing. Measurements included the initial radii of the meniscus, i.e., r1 and r2 in Fig. 1(a), and the relative position of the particles Drying Rates For completeness, Fig. 9 presents the change in drying rate (ѨS/Ѩt) versus the degree of saturation for the three specimens. Three general regions are observed. At the beginning, near saturation S = 1.0, the drying rate increases reflecting the in- crease in temperature within the specimen as it warms up to- ward the incubator temperature. After air entry, evaporation occurs at an almost constant rate for uniform pore-size spec- imens. Finally, the evaporation of water within small menisci and loosely bound water near saturation S = 0 takes place at a decreasing rate (Santamarina and Wakim 1992; Kayyal 1995; FIG. 10. Sketch of Microscale Tests for Menisci Failure: (a) Knight et al. 1996). Pulling Test; (b) Horizontal Shear Test; (c) Rotating Test 92 / JOURNAL OF GEOTECHNICAL AND GEOENVIRONMENTAL ENGINEERING / JANUARY 2001
  • 10. FIG. 11. Microscale Test for Menisci Failure Showing Experimental and Analytical Results: (a) Pulling Test; (b) Horizontal Shear Test; (c) Rotating Test at menisci failure. The measured radii were used to compute the water content by using (9) or (10) (SC packing, coordi- nation number 6), and the particle positions at menisci failure were used to compute the equivalent strain. Microscale tests for menisci failure are sketched in Fig. 10. Three tests were run: (1) Pulling along the normal-contact di- rection; (2) shearing parallel to the contact plane; and (3) ro- tation of one particle relative to the other while maintaining interparticle contact. Results for the three cases are shown in Fig. 11. Each circle represents a separate test. The trends show that the strain when menisci fail decreases with the decrease in water content in the three cases. An analytical microscale solution was developed to predict the strain at meniscus failure for the cases of normal and shear tensile deformations (Cho and Santamarina 1999). The anal- ysis is based on estimating the zero-suction condition that de- velops when a meniscus is strained and its radii r1 and r2 change correspondingly. For a given strain, the volume of wa- ter can be expressed in terms of radii r1 and r2, and the particle radius R. The water content can be related to the volume of water for SC packing. The first-order Taylor approximation for the normal strain (i.e., pulling test) is ␦ εa = Ϸ 0.53(Se)1/3 = 0.53(Gsw)1/3 (22) 2R where εa = normal strain (i.e., axial strain); ␦ = distance be- tween two particles when meniscus fails; R = particle radius; S = degree of saturation; e = void ratio; Gs = specific gravity of particle; and w = water content. The first-order Taylor ap- proximation for the shear strain in the horizontal shear test can be expressed in terms of the normal strain εs = ͙ε 2 ϩ 2εa a (23) where εs = shear strain. Analytical predictions are superimposed on Figs. 11(a and FIG. 12. Perturbation-Recovery Test; Note Shear-Wave Veloc- b). In general, there is good agreement between experimental ity Is Normalized with Respect to Shear-Wave Velocity Immedi- data and analytical predictions. The gap at relatively high wa- ately before Impact: (a) S = 0.40 Degree of Saturation; (b) S = ter content reflects the nontoroidal shape of the stretched me- 0.01 Degree of Saturation JOURNAL OF GEOTECHNICAL AND GEOENVIRONMENTAL ENGINEERING / JANUARY 2001 / 93
  • 11. niscus. On the other hand, deviations at small water content plore this suspicion, a specimen was laterally impacted with a may reflect experimental difficulties related with measuring pendulum to deliver a fixed impulse (Specimen V in Table 2). and preserving very small menisci. The shear-wave velocity was measured before and after im- The observed strains for menisci failure (ε = 0.01 to 1) are pact. The study was repeated at different degrees of saturation higher than the threshold strain for sands determined from the while the degree of saturation remained approximately con- shear modulus degradation curves. Therefore, capillary effects stant during each study. Data are plotted in Fig. 12 for the will contribute to low strain stiffness, as shown earlier. Yet, degree of saturation S = 0.4, i.e., funicular stage—pressure small menisci (low water content) may fail before soils reach diffusion-based homogenization, and for S = 0.01, i.e., pen- the strain at peak strength and will not contribute to soil dular stage—vapor pressure-based homogenization. Results strength [w Ϸ 0.01 or lower, from (22) or (23)]. For higher show fast and complete recovery in the funicular stage. On water contents, capillary forces will contribute to increase both the other hand, the rate of recovery is low in the pendular the low strain stiffness of soils and the strength of the soil. stage, and full recovery may not be reached. These results It is important to note that the negative pressure gradually show a potential mechanism to explain thixotropic recovery in decreases as the meniscus is deformed, due to the changes in unsaturated materials (Dıaz Rodrıguez and Santamarina 1999). ´ ´ curvature that it experiences (Laplace’s equation). In other words, the contribution of a meniscus to the internal forces SUMMARY AND CONCLUSIONS does not vanish suddenly, but gradually with the strain level. Early experimental results by Donald (1956) and Escario and Experiments and analyses were performed to gain further Juca (1989) support these observations. Limiting values of wa- ´ insight into the microscale behavior of unsaturated particulate ter content w must be taken into consideration when applying materials. Emphasis was placed on the pendular stage and on models for the shear strength of unsaturated soils; Rahardjo the effect of capillary forces on small strain stiffness. Other and Han (1995) show ␾ varying with S. factors, besides capillarity, coexist and increase the stiffness at low saturation levels. Fig. 13 summarizes particle-level phe- Suction Homogenization and Menisci Recovery nomena identified in this study. The main conclusions from this study follow: Perturbations may alter the internal equilibrium at the ma- croscale, even if menisci failure does not take place. To ex- • The contribution of capillarity to interparticle forces in- FIG. 13. Stages of Unsaturated Conditions and Related Phenomena 94 / JOURNAL OF GEOTECHNICAL AND GEOENVIRONMENTAL ENGINEERING / JANUARY 2001
  • 12. volves not only matric suction (i.e., negative pore-water Cho, G. C., and Santamarina, J. C. (1999). ‘‘Unsaturated particulate pressure) but the surface tension force along the edge of materials—Analytical study.’’ ͗http://www.ce.gatech.edu/ϳcarlos/ Laboratory/public/electonic.html͘. menisci, as well. Defay, R., and Prigogine, I. (1966). Surface tension and adsorption, D. • The ‘‘equivalent effective stress’’ due to capillary forces H. Everett, translator, Longman’s, London. increases with decreasing water content, decreasing par- Dıaz-Rodrıguez, J. A., and Santamarina, J. C. (1999). ‘‘Thixotropy: The ´ ´ ticle size, and increasing coordination. Specific surface is case of Mexico City soils.’’ XI Panamerican Conf. on Soil Mech. and a meaningful parameter in the characterization of unsat- Geotech. Engrg., 1, 441–448. Donald, I. B. (1956). ‘‘Shear strength measurements in unsaturated non- urated soils. cohesive soils with negative pore pressures.’’ 2nd Proc. of Australia- • Shear waves permit studying the evolution of effective New Zealand Conf. on Soil Mech. and Found. Engrg., University of interparticle forces. This is particularly valuable in the Melbourne, Australia, 200–204. pendular regime where direct measurement of the nega- Escario, V., and Juca, J. F. T. (1989). ‘‘Strength and deformation of partly ´ tive pore-water pressure is not feasible. Remolding is not saturated soils.’’ Proc., Int. Conf. on Soil Mech. and Found. Engrg., Balkema, Rotterdam, The Netherlands, 1, 43–46. an appropriate specimen-preparation procedure to study Fam, M., and Santamarina, J. C. (1995). ‘‘Study of geoprocesses with the behavior of low water-content soils. complementary wave measurements in an oedometer.’’ Geotech. Test- • The shear-wave velocity at low saturation can be esti- ing J., ASTM, 18(3), 307–314. mated to a first approximation form the shear-wave ve- Fam, M., and Santamarina, J. C. (1996). ‘‘Coupled diffusion-fabric-flow phenomena: An effective stress analysis.’’ Can. Geotech. J., Ottawa, locity of the saturated specimen by taking into consider- 33, 515–522, ation particle size, shape, and water content. Fisher, E. A. (1923). ‘‘Some factors affecting the evaporation of water • Grain size distribution plays a crucial role in the evolution from soil.’’ J. Agric. Sci., London, 13, 121–143. of stiffness with saturation. Fisher, J. C. (1948). ‘‘The fracture of liquids.’’ J. Appl. Phys., 19, 1062– • An unsaturated soil shows a sudden drop in low strain 1067. Fisher, R. A. (1926). ‘‘On the capillary forces in an ideal soil; Correction stiffness when perturbed, followed by a time-dependent of formulae given by W. B. Haines.’’ J. Agric. Sci., London, 16, 492– regain. The rate of regain is faster when menisci are in- 505. terconnected (funicular stage). In the pendular stage, pore- Fredlund, D. G. (1991). ‘‘How negative can pore-water pressures get?’’ water pressure homogenization takes place through the Geotech. News, Vancouver, (Sept.), 44–46. vapor pressure; this is a slow process and stiffness regain Fredlund, D. G., Morgenstern, N. R., and Widger, R. A. (1978). ‘‘The shear strength of unsaturated soils.’’ Can Geotech. J., Ottawa, 15(3), may not be complete. 313–321. • The strain at menisci failure decreases with the decrease Fredlund, D. G., and Rahardjo, H. (1993). Soil mechanics for saturated in water content. Unless the water content is extremely soils, Wiley, New York. small, menisci will fail at strains greater than the threshold Giancoli, D. C. (1998). Physics—Principles with application, 5th Ed., strain of the soil; therefore, partial saturation is a stabiliz- Prentice-Hall, Englewood Cliffs, N.J. Gili, J. A. (1988). ‘‘Modelo Microstructural para Medios Granulares No ing force for the soil skeleton. On the other hand, small Saturados.’’ PhD thesis, Universidad Politechnica de Catalunya, Spain. menisci may fail before the strain at peak strength of soils Gilliland, E. R. (1938). ‘‘Fundamental of drying and air conditioning.’’ (depending on the degree of saturation). Thus, capillary J. Industrial and Engrg. Chem., Washington, D.C., 30, 506–514. forces at low water contents cause an increase in the low Guan, Y., and Fredlund, D. G. (1997). ‘‘Use of the tensile strength of strain stiffness of soils, but may not contribute to the peak water for the direct measurement of high soil suction.’’ Can. Geotech. J., Ottawa, 34(4), 604–614. strength. Hilf, J. W. (1956). ‘‘An investigation of pore-water pressure in compacted cohesive soils.’’ PhD thesis, U.S. Bureau of Reclamation, TC 654, Uni- ACKNOWLEDGMENTS versity of Colorado, Boulder, Colo. Hillel, D. (1980). Applications of soil physics, Academic, San Diego. This study is supported by the Mid-America Earthquake Center, Kayyal, M. K. (1995). ‘‘Effect of the moisture evaporative stages on the Urbana, Ill., under National Science Foundation Grant EEC-970185. development of shrinkage cracks in soils.’’ Proc., 1st Int. Conf. on E. Macari, L. Hoyos, and D. Muir Wood provided valuable information Unsaturated Soils, E. E. Alonso and P. Delage, eds., Balkema, Paris, and comments. The authors are very thankful to reviewers for their de- 373–379. tailed reviews. Specific surface data were gathered by K. A. Klein and Knight, R., Tercier, P., and Goertz, D. (1996). ‘‘A laboratory procedure Y.-H. Wang. Derivation and further analyses associated with this paper for estimating irreducible water saturation from cuttings.’’ The Log An- can be found on the authors’ website, http://www.ce.gatech.edu/ϳcarlos/ alyst, (Jul.–Aug.), 18–24. Laboratory/public/electronic.html. Kohgo, Y., Nakano, M., and Miyazaki, T. (1993). ‘‘Theoretical aspects of constitutive modelling for unsaturated soils.’’ Soils and Found., APPENDIX. REFERENCES Tokyo, 33(4), 49–63. Leverson, S. M., and Lohnes, R. A. (1995). ‘‘Moisture tension relations Aitchison, G. D. (1960). ‘‘Relationships of moisture stress and effective in sand.’’ Proc., 1st Int. Conf. on Unsaturated Soils, E. E. Alonso and stress functions in unsaturated soils.’’ Conf. British Nat. Soc. of Int. P. Delage, eds., Balkema, Paris, 387–392. Soil Mech. and Found. Engrg., Butterworth’s, London, 47–52. Marinho, F. A. M., and Chandler, R. J. (1995). ‘‘Cavitation and the direct Aitchison, G. D., and Donald, I. B. (1956). ‘‘Effective stresses in unsat- measurement of soil suction.’’ Proc., 1st Int. Conf. on Unsaturated urated soils.’’ 2nd Proc. of Australia-New Zealand Conf. on Soil Mech. Soils, E. E. Alonso and P. Delage, eds., Balkema, Paris, 623–630. and Found. Engrg., University of Melbourne, Australia, 192–199. Nagaraj, T. S., and Srinivasa Murthy, B. R. (1985). ‘‘Compressibility of Aubertin, M., Ricard, J.-F., and Chapuis, R. P. (1998). ‘‘A predictive partly saturated soils.’’ J. Geotech. Engrg., ASCE, 111(7), 937–942. model for the water retention curve: Application to tailings from hard- Newitt, D. M., and Conway-Jones, J. M. (1958). ‘‘A contribution to the rock mines.’’ Can. Geotech. J., Ottawa, 35, 55–69. theory and practice of granulation.’’ Trans. Inst. Chem. Engrg., Chem. Bear, J. (1979). Hydraulics of groundwater, McGraw-Hill, New York. Engrg. Res. and Des., Pergamon, U.K., 36, 422–442. ¨ Oberg, A.-L. (1997). Matrix suction in silt and sand slopes—Significance Bishop, A. W. (1959). ‘‘The principle of effective stress.’’ Teknisk Ukeblad and practical use in stability analysis.’’ PhD thesis, Chalmers University I Samarbeide Med Teknikk, Oslo, Norway, 106(39), 859–863. of Technology, Goteborg, Sweden. ¨ Bishop, A. W. (1961). ‘‘The measurement of pore pressure in the triaxial Oliver, T. R., and Newitt, D. M. (1949). ‘‘The measurement of suction test.’’ Conf. British Nat. Soc. of Int. Soil Mech. and Found. Engrg., potentials and moisture distribution in drying granular soils.’’ Trans. Butterworth’s, London, 38–46. Inst. Chem. Engrg.: Chem. Engrg. Res. and Des., Pergamon, U.K., 27, Bishop, A. W., and Blight, G. E. (1963). ‘‘Some aspects of effective stress 9–18. in saturated and partly saturated soils.’’ Geotechnique, London, 13(3), ´ Pietsch, W. (1991). Size enlargement by agglomeration, Wiley, New York. 177–196. Qian, X., Gray, D. H., and Woods, R. D. (1991), ‘‘Resonant column tests Bishop, A. W., Kumapley, N. K., and El-Ruwayih, A. (1975). ‘‘The in- on partially saturated sands.’’ Geotech. Testing J., 14(3), 266–275. fluence of pore-water tension on the strength of clay.’’ Philosophical Qian, X., Gray, D. H., and Woods, R. D. (1993). ‘‘Voids and granulo- Trans. Royal Soc., London, 278(A.1286), 511–554. metry: Effects on shear modulus of unsaturated sands.’’ J. Geotech. Blight, G. E. (1967). ‘‘Effective stress evaluation for unsaturated soils.’’ Engrg., ASCE, 119(2), 295–314. J. Soil Mech. and Found. Div., ASCE, 93(2), 125–148. Rahardjo, H., and Han, K. K. (1995). ‘‘Shear strength of unsaturated soils JOURNAL OF GEOTECHNICAL AND GEOENVIRONMENTAL ENGINEERING / JANUARY 2001 / 95
  • 13. as it applies to slope stability analysis.’’ Symp. on Unsaturated Soil ification with electromagnetic waves: Applications to environmental Behavior and Applications, Nairobi, Kenya, 1–31. geotechnology.’’ Grout., Soil Impr. and Geosyn., ASCE-SP, (Feb.), Rinaldi, V. A., Santamarina, J. C., and Redolfi, E. R. (1998). ‘‘Charac- 1380–1392. terization of collapsible soils with combined geophysical and penetra- Skempton, A. W. (1961). ‘‘Horizontal stresses in an over-consolidated tion testing.’’ Proc., 1st Int. Conf. on Site Characterization, ISC’98, Eocene clay.’’ Proc., 5th Int. Conf. for Soil Mech. and Found. Engrg., P. K. Robertson and P. W. Mayne, eds., Balkema, Brookfield, 581– Dunod, Paris, 351–357. 588. Stokoe, K. H., II, Lee, J. N.-K., and Lee, S. H.-H. (1991). ‘‘Characteri- Sahimi, M. (1994). Applications of percolation theory, Taylor and Fran- zation of soil in calibration chambers with seismic waves.’’ Proc., 1st cis, London. Int. Symp. on Calibration Chamber Testing, 363–376. Santamarina, J. C., and Aloufi, M. (1999). ‘‘Small strain stiffness: A mi- Terzaghi, K. V. (1925). ‘‘Principles of soil mechanics: I—Phenomena of cromechanical experimental study.’’ Proc. of Pre-failure Defor. Char. cohesion of clay.’’ Engrg. News Record, 95(19), 742–746. of Geomaterials, IST99, M. Jamiolkowski, R. Lancellotta, and D. Lo Terzaghi, K. V., and Peck, R. B. (1948). Soil mechanics and engineering Presti, eds., Balkema, The Netherlands, 451–458. practice, Wiley, New York. Santamarina, J. C., and Cascante, G. (1996). ‘‘Stress anisotropy and wave Trevena, D. H. (1987). Cavitation and tension in liquids, Hilger, London. propagation—A micromechanical view.’’ Can. Geotech. J., Ottawa, 33, Wu, S., Gray, D. H., and Richart, F. E., Jr. (1984). ‘‘Capillary effects on 770–782. dynamic modulus of sands and silts.’’ J. Geotech. Engrg., ASCE, Santamarina, J. C., and Wakim, Y. N. (1992). ‘‘Principles of ground mod- 110(9), 1188–1203. 96 / JOURNAL OF GEOTECHNICAL AND GEOENVIRONMENTAL ENGINEERING / JANUARY 2001