

Recomendados
Recomendados
Más contenido relacionado
La actualidad más candente
La actualidad más candente (20)
Destacado
Destacado (14)
Similar a Financial Markets Review (October 2014)
Similar a Financial Markets Review (October 2014) (20)
Más de Snam
Más de Snam (20)
Último
Último (20)
Financial Markets Review (October 2014)
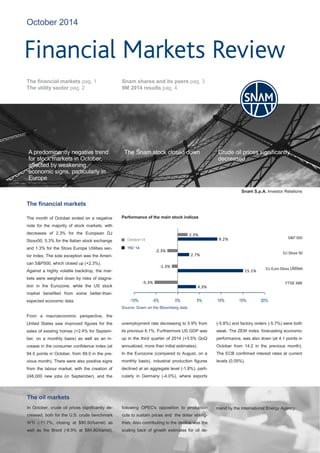
- 1. October 2014 Performance of the main stock indices Source: Snam on the Bloomberg data The financial markets pag. 1 The utility sector pag. 2 Snam shares and its peers pag. 3 9M 2014 results pag. 4 The oil markets In October, crude oil prices significantly de- creased, both for the U.S. crude benchmark WTI (-11.7%, closing at $80.50/barrel) as well as the Brent (-8.9% at $84.80/barrel), following OPEC's opposition to production cuts to sustain prices and the dollar streng- then. Also contributing to the decline was the scaling back of growth estimates for oil de- mand by the International Energy Agency. Snam S.p.A. Investor Relations The financial markets The month of October ended on a negative note for the majority of stock markets, with decreases of 2.3% for the European DJ Stoxx50, 5.3% for the Italian stock exchange and 1.3% for the Stoxx Europe Utilities sec- tor index. The sole exception was the Ameri- can S&P500, which closed up (+2.3%). Against a highly volatile backdrop, the mar- kets were weighed down by risks of stagna- tion in the Eurozone, while the US stock market benefited from some better-than- expected economic data. From a macroeconomic perspective, the United States saw improved figures for the sales of existing homes (+2.4% for Septem- ber, on a monthly basis) as well as an in- crease in the consumer confidence index (at 94.5 points in October, from 89.0 in the pre- vious month). There were also positive signs from the labour market, with the creation of 248,000 new jobs (in September), and the unemployment rate decreasing to 5.9% from its previous 6.1%. Furthermore US GDP was up in the third quarter of 2014 (+3.5% QoQ annualized, more than initial estimates). In the Eurozone (compared to August, on a monthly basis), industrial production figures declined at an aggregate level (-1.8%), parti- cularly in Germany (-4.0%), where exports (-5.8%) and factory orders (-5.7%) were both weak. The ZEW index, forecasting economic performance, was also down (at 4.1 points in October from 14.2 in the previous month). The ECB confirmed interest rates at current levels (0.05%). 4.3% 15.1% 2.7% 9.2% -5.3% -1.3% -2.3% 2.3% -10% -5% 0% 5% 10% 15% 20% DJ Stoxx 50 S&P 500 DJ Euro Stoxx Utilities FTSE MIB October‘14 YtD ‘14 The Snam stock closed downA predominantly negative trend for stock markets in October, affected by weakening economic signs, particularly in Europe Crude oil prices significantly decreased
- 2. Similar to the overall stock market, individual sectors experienced mainly negative trends; particularly the oil and gas sector, which was impacted by a sharp decline in crude oil prices to their lowest in three years, as well as that of raw materials, weighed down by concerns over a further slowdown in the Chinese economy (Chinese GDP was +7.3% in the third quarter, compared with +7.5% in the previous year). Some sectors were up, including real estate, which recovered from the underperformance of the previous month. Finally, the Utility sector closed down, im- pacted by the decline by electricity compa- nies. During the month of October, the utility sec- tor saw a decline in performance of 1.3% versus the previous month's end. The sector was negatively impacted by elec- tricity companies, particularly those in Ger- many (E.on -5.3% and RWE -8.4%) and France (EDF -9.3%). The former were af- fected by the ongoing tensions between the EU and Russia, as well as some negative macroeconomic data showing a slowdown in the German economy, while the latter suffe- red from overhang risk generated by ru- mours of a stake sale by the French govern- ment, as well as the publication of new elec- tricity tariffs that were lower than expected. The Utility sector in the Stock Market Source: Snam on the Bloomberg data Main sector performance, October 2014 Sector and subsector performance, October 2014 3.6% -3.3% -2.5% -1.3% -10% -5% 0% 5% 10% Defensive Utilities DJ Utility Energy Utilities Others Finally, the Utility sector closed down, impacted by the decline by electricity companies. The Utility sector performance Financial Markets Review October 2014 Snam S.p.A. Investor Relations -10% -5% 0% 5% 10%
- 3. 45.6% 49.8% 9.8% 14.2% 21,3% 20.0% 30.8% 15.1% 4.3% 2.7% 0.9% 4.8% 1.6% 4.3% 6.3% 5.8% -1.6% -1.3% -5.3% -2.3% -10% -5% 0% 5% 10% 15% 20% 25% 30% 35% 40% 45% 50% 55% The Snam shares and its peers in the Stock Markets The Snam stock closed the month of Octo- ber down 1.6% (€ 4.31 per share), broadly in line with the Utility sector and outperforming the Italian market. The stock, which in the early part of the month was affected by new fears around the solidity of the Italian economy, reversed this trend in the second half of October due to the success of the €500 million bond issue and expectations for positive 2014 nine month results. The stock's average daily trading volume in October totalled 14.2 million units, up from 7.9 million in September. 9M 2014 Snam results Corporate News Snam and its peers Source: Snam on the Bloomberg data YtD ‘14 October‘14 FTSE MIB Stoxx 50 DJ Utility United Utilities NG Severn Trent REE Enagas Snam Terna On October 31 the Snam Board of Directors, at meeting chaired by Lorenzo Bini Smaghi, approved the consolidated results for the first nine months and the third quarter of 2014 (unaudited). Carlo Malacarne, Snam CEO, made the follo- wing comments on the results: “Our continued focus on operating and finan- cial efficiency enabled us to once again re- cord positive results for the first nine months of this year, as shown by the rise of about 1% in EBIT and the 28% increase in net profit, despite persistently unfavourable economic conditions and lower volumes of gas injected into the network. We continue to pursue investments to streng- then Italy’s gas infrastructure and promote increased integration across European net- works.” On October 15 Snam successfully launched a fixed rate note issue, maturity 2023, for an amount of 500 million euro under its EMTN Programme (Euro Medium Term Notes) which was approved by the Board of Direc- tors on June 23rd, 2014. The transaction was more than 3 times over- subscribed with high quality and wide and geographical diversification of investors. This issue is a further step in the optimiza- tion process of Snam’s debt structure and cost of capital, in line with the Company’s targets. The bond issue has an annual coupon of 1.50%. The re-offer price is 99.285 (equivalent to a spread of 78 basis points over the reference mid-swap rate). Financial Markets Review October 2014 Snam S.p.A. Investor Relations Agenda No event by the end of 2014 On October 31, the Regulatory Authority for Electricity and Gas and Water published its resolution on the criteria for the determina- tion of tariffs for gas storage services for the 4th regulatory period, which will begin in January 2015 and last four years. The Authority indicated that a few exoge- nous parameters for all regulated gas and electricity businesses will be revised over the next year, the effects of which will commen- ce in January 2016. Fixed rate bond issue successfully launched New storage regulation published
- 4. Snam and its peers: 9M 2014 results Operating Highlights Financial Highlights On 31st October Snam presented the 9M 2014 results 1 Net of IFRIC 12 (equal to 211 million euro). The total revenue including IFRIC 12 amounted to 2859 milion euro, up 1% compared to 2835 of 9M 2013. * Debt at 12.31.2013 Terna will present the 9M 2014 results on November the 12th On 21st October Enagas presented the 9M 2014 results (million euro) 9M 2013 9M 2014 Change Total revenue 924 902 (2.5%) EBITDA 763 733 (3.9%) EBIT 511 496 (2.9%) Net profit 304 308 +1.5% Investments 450 546 +21% Net debt 3,772* 3,910 +3.6% Financial Highlights On 29th July Red Electrica presented the 9M 2014 results (million euro) 9M 2013 9M 2014 Change Total revenue 1,302 1,374 +5.5% EBITDA 961 1,017 +5.8% EBIT 660 702 +6.3% Net profit 389 415 +6.5% Investments 379 368 (3.1%) Net debt 4,541* 4,950 +9.0% Financial Highlights Snam SpA Piazza Santa Barbara 7 - 20097 S. Donato Milanese (Mi) Italia www.snam.it — investor.relations@snam.it tel: +39 02 37037272- fax: +39 02 37037803 Financial Markets Review October 2014 Snam S.p.A. Investor Relations (million euro) 9M 2013 9M 2014 Change Total revenue1 2,633 2,648 +0.6% EBITDA 2,083 2,111 +1.3% EBIT 1,516 1,528 +0.8% Net profit 674 863 +28% Investments 775 856 +10.5% Net debt 13,326* 13,734 +3.1% (billion cubic meters) 9M 2013 Change9M 2014 Gas injected into the transportation network 50.32 (6.2%)47.19 Available storage capacity 11.4 0%11.4 Number of active meters (mln) 5.915 +7.8%6.379 * Debt at 12.31.2013 * Debt at 12.31.2013