Refrigerant Properties Review: Effects on System Performance
•
0 recomendaciones•346 vistas


Recomendados
Recomendados
Más contenido relacionado
La actualidad más candente
La actualidad más candente (20)
Similar a Refrigerant Properties Review: Effects on System Performance
Similar a Refrigerant Properties Review: Effects on System Performance (20)
Refrigerant Properties Review: Effects on System Performance
- 1. Rotchana Prapainop, K O Suen / International Journal of Engineering Research and Applications (IJERA) ISSN: 2248-9622 www.ijera.com Vol. 2, Issue 4, July-August 2012, pp.486-493 Effects of refrigerant properties on refrigerant performance comparison: A review Rotchana Prapainop,1,* K O Suen2 1 Department of Mechanical Engineering, Kasetsart University, Chonburi, Thailand 2 Department of Mechanical Engineering, University College London, London, United Kingdom The effects of thermo-physical properties and changes due to compatibility issues, and “new system” derived parameters of refrigerants on system - replacement of old systems with new ones designed performance comparison are reviewed here. The specifically for the alternative refrigerant (MPROG: properties reviewed are density, viscosity, thermal BNCR35). conductivity, molar heat capacity, critical For new systems, components can be designed and temperatures, specific refrigerating effect and sized to suit individual refrigerants to achieve the molecular weight. It was noted that to obtain a high required system capacities at specified refrigerant COP, combinations of high values of latent heat, temperatures (AREP , 1994). For examples, liquid thermal conductivity and vapour density and refrigerants with relatively poorer heat transfer low values of liquid viscosities and molecular weight characteristics will require a larger heat exchanger area are required. Critical temperature and vapour (Calm and Domanski, 2004) or better designed heat specific heat are important properties when exchangers (Lee and Yoo, 2000, Domanski et al., considering trade-offs between capacity and COP. 2005) to achieve the same capacity. On the other hand, The oil existance in the system could reduce or refrigerants with a high volumetric refrigerating effect increase heat transfer or/and pressure drop (or volumetric refrigerating capacity, kJ/m3) can comparing to those ignore the presence of oil employ smaller compressors (Hwang et al., 2005). In depending on the amount of oil and solubility. such cases, the capital cost per unit capacity and the COP will probably be one of the main interests for the Introduction comparison. In both the drop-in and retrofit scenarios, Among available refrigerants, R-22 has been the same original performance and/or capacity may not widely used for many years. It possesses many be attained due to the use of the existing heat desirable physical and thermodynamic properties and exchangers and compressor, unless the two refrigerants can be employed in a wide range of applications and have very similar properties. For example, when temperatures with good system performance. It is also retrofitting a R22 system to R407C or R290, lower safe in terms of toxicity and flammability. cooling capacities were obtained (Devotta et al., 2005a, Nevertheless, in response to Montreal Protocol (UNEP, 2005b, Purkayastha and Bansal, 1998), due to their 2006), R22, as the last remaining ozone depleting lower volumetric refrigerating effects. HCFC, will face the eventual phase-out in probably This paper is to review relevant less than 5 to 10 years time (UNEP, 2006). Many properties/parameters for the refrigerant performance alternative refrigerants have been developed to replace comparison. First, properties for refrigerant only, R22 as well as many of those already phased out. The including density, viscosity, thermal conductivity, choice of alternative refrigerants is vast and it is not molar heat capacity, critical temperatures, specific always easy to make the right decision, though many of refrigerating effect and molecular weight, are the new refrigerants are expected to deliver the same or reviewed. Derived parameters such as volumetric even better energy performance than those being refrigerating capacity, heat transfer coefficient and phased out. pressure drop are reviewed in the following section. Several scenarios of refrigerant substitution Finally, the refrigerant-oil properties/parameters are can be adopted; these are “drop-in”, “retrofit”, and reviewed. “new” systems. “Drop-in” - where the old refrigerant is taken out and the system charged with the alternative Effects of key refrigerant properties on system refrigerant and occasionally with some minor performance adjustments to the control settings, “retrofit” - where Density or Specific volume the old refrigerant is replaced with an alternative Density () or specific volume ( = 1/) of a refrigerant often accompanied by oil and material refrigerant influences pressure drop throughout the 486 | P a g e
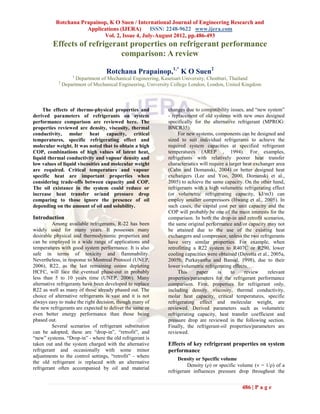
- 2. Rotchana Prapainop, K O Suen / International Journal of Engineering Research and Applications (IJERA) ISSN: 2248-9622 www.ijera.com Vol. 2, Issue 4, July-August 2012, pp.486-493 refrigerant circuit as well as the compressor capacity. Critical temperature The lower the vapour density, the larger will be the In general, as the critical temperature of a pressure drop in the evaporator and the condenser for a refrigerant increases the volumetric refrigerating given mass flux, and thus for instance, R290 has a capacity (refrigerating effect per specific volume, larger pressure drop compared to R404A, R410A and kJ/m3) decreases; this is due to the fact that lower R22 (Spatz and Motta, 2004). For a given compressor vapour densities (at a given evaporating temperature) size and speed, a lower vapour density will also result are usually associated with refrigerants with a high in a lower capacity. As shown in Hwang and critical temperature (McLinden and Didion, 1987, Radermacher (2002), the saturated vapour density of Didion, 1999). The implication is that for a given R410A is approximately 40% higher than that of R22 compressor (speed and size), the reduction of suction (and R410A’s latent heat is also 7% higher), for the density will lead to a decrease in the mass flow rate same compressor, it will provide much higher capacity and hence the cooling capacity. On the other hand, than R22. They needed to use a smaller compressor for when design a new system, a refrigerant with a high R410A to obtain similar capacity as R22. Tcrit will require a larger compressor swept volume rate to provide the same capacity. The COP, however, Viscosity increases for refrigerants with a high critical Higher values of liquid viscosity increase temperature, due to reduced flash gas losses. Therefore, pressure drop in both evaporators and condensers a trade-off between high capacity and high efficiency (Domanski and Didion, 1987). As a result, suction has to be considered (McLinden and Didion, 1987, pressure at the compressor inlet decreases, discharge Didion, 1999). pressure increases and the mass flow rate of refrigerant also decreases, followed by a reduction in system Specific refrigerating effect capacity. The compressor work (kW) also decreases, The specific refrigerating effect determines though at a slower rate than capacity. Higher liquid the mass flow rate of refrigerant required to produce a viscosities also give rise to reduced HTCs. given capacity. The larger the specific refrigerating Hydrocarbon refrigerants have lower liquid viscosities effect, the smaller the required mass flow rate. It, than R22, hence higher HTCs in the evaporator and therefore, also determines the size of the components condenser (Chang, et al., 2000). (Gosney, 1982). R290, having a higher specific refrigerating effect (or a high latent heat), thus requires Thermal conductivity a smaller size of the compressor than R12 for In general, a higher liquid thermal providing the same capacity (Kumar and Rajagopal, conductivity would give rise to a higher HTC. With an 2007). equal mass flux or an equal heat flux, evaporation HTC of R290, R600 and R600/R290 are higher when Molecular weight compared to R134a as these refrigerants have higher Large values of enthalpy of evaporation are thermal conductivities than R134a (Wen and Ho, found for substances with light molecules (Gosney, 2005). 1982), and the energy losses across a compressor’s valves are high when the molecules are heavy Molar heat capacity or Specific heat (Woollatt, 1982). Therefore a low value of molecular The magnitude of the molar heat capacity at weight is preferred for having high efficiency (Devotta, constant volume has a strong influence on the slope of 1995). the saturated liquid and vapour lines as shown on the To sum up, in general, to obtain high COP, the T-s diagram, Figure 1 (Didion, 1999). The slope of the following combination of properties is desirable, as saturated vapour line can be positive or negative. In shown in Table 1. Note that for critical temperature and general, refrigerants with more complex molecules are vapour specific heat, a trade-off between capacity and likely to have a higher molar heat capacity, and more COP should be considered. likely that their saturated vapour line will bend to give Domanski and Didion (1987) and Hogberg and a negative slope at the lower pressure/temperature and Vamling (1996) showed that each individual a positive slope at the higher pressure. When the heat refrigerant property affects the system performance capacity is too low, the compression work will be high with different sensitivities or by different extents. As with increased discharge temperature and reduced shown in Table 2, the normal boiling point, the critical thermal efficiency. On the other hand, for a high heat temperature, the liquid thermal conductivity and capacity, wet compression may be encountered viscosity, the vapour density and the evaporative HTC (McLinden and Didion, 1987). Therefore, a trade-off in appeared to have the most impact on system the value of the heat capacity is needed. performance. Evaporator pressure drop has only a slight influence whereas the vapour-phase thermal 487 | P a g e
- 3. Rotchana Prapainop, K O Suen / International Journal of Engineering Research and Applications (IJERA) ISSN: 2248-9622 www.ijera.com Vol. 2, Issue 4, July-August 2012, pp.486-493 conductivity and viscosity, together with the half of that R22, which is approximately the value one condensation HTC and condenser pressure drop, were would experience in drop-in tests. found to have the least impacts. Table 2 includes some examples of the influence of variations of HTC and pressure drop on capacity and Effects of derived parameters on system COP based on the sensitivity studies carried by performance Domanski and Didion (1987) and Hogberg and Volumetric (or volumic) refrigerating capacity Vamling (1996). (VRC = hrefrig/suc, kJ/m3) When comparing the HTC and pressure drop of In general, fluids with a higher vapour different refrigerants, one could base the evaluation on pressure would also have higher values of volumetric the same mass fluxes (Lee et al., 2006) or the same refrigerating capacity (VRC) and thus require a smaller specified heat fluxes (Choi et al., 2000); the latter compressor displacement rate (Jung et al., 2000 and usually corresponds to same capacities. However, these Granryd, 2001) to deliver the similar capacity. To two comparison approaches could lead to different replace or retrofit an existing refrigerant without possible conclusions regarding which refrigerant has a changing the compressor, VRC of alternative fluids higher HTC or a lower pressure drop. Chang et al. should be similar to that of the replaced fluid (Saleh (2000) compared pure and mixture hydrocarbon with and Wendland, 2006). However, whether the retrofit R22 experimentally in a heat pump system. At the COP will increase or decrease depends on many other same mass fluxes, HTCs of the hydrocarbons are much factors, such as the retrofit refrigerant temperatures, greater than R22 whereas when compared under the pressure ratio and compressor efficiencies. same capacities, hydrocarbons show slightly lower values of HTC than R22 due to the fact the Pressure ratio hydrocarbons have lower mass fluxes under the same In general, when pressure ratio increases, both capacity. isentropic and volumetric efficiencies of a reciprocating compressor decrease (Bansal et al., 1992, The oil effects The oil effects on thermo-physical properties, Urchueguia et al., 2004, Peterson and Thorsell, 1990), heat transfer coefficients and pressure drops, and heat influencing the COP and mass flow rate, respectively. exchanger/system performance are reviewed as follow. Heat transfer coefficient (HTC) and pressure drop The results of refrigerant performance Effect of oil on thermo-physical properties, comparison when only considering the HTC and pressure drop thermodynamics may be different from those when Lubricant oils have much higher boiling taking into account the heat transfer and pressure drop points (Tb) and molecular weights (MW) than most of in the system. Spatz and Motta (2004) showed that, the the common refrigerants and therefore the Tb and MW COPs of a system using R410A and R290, based on of refrigerant-oil mixture will be higher than the thermodynamic analysis, are slightly lower than that of refrigerants. The presence of miscible oil in a R22 when all are operating under the same capacity. refrigerant increases its critical temperature, liquid However, when including heat transfer and viscosity, surface tension, specific heat and thermal pressure drop effects of the individual refrigerants in conductivity; on the other hand, the oil presence the heat exchangers, the reverse was observed. At the reduces its critical pressure and liquid density (Thome, same mass flux, R410A has a higher HTC and a lower u.d, Wei et al., 2008). Oil is essentially non-volatile under typical refrigeration operating condition, and P than R22. The lower impact of a given P on therefore it mainly affects the liquid-phase properties. saturation temperatures coupled with an improved heat Thome (u.d.) commented that vapour pressure of transfer for R410A reduces the temperature lift oil is extremely small compared to that of the between Tr,dew,cond and Tr,dew,evap, thus lowering refrigerant, resulting in practically very little oil the compressor power requirement. On the other hand, entering the vapour phase with the refrigerant. Heat though at the same mass flux, the HTC of R290 is transfer and pressure drop characteristics of higher than R22, R290 also has a higher pressure drop. evaporators are very sensitive to the presence of oil However at a given capacity, R290 has a much lower (Youbi-Idrissi, et al., 2003, 2004). However, it is mass flux than R22, and hence its HTC and pressure difficult to predict accurately the HTC due to oil’s drop are comparable to R22, resulting in the COP of presence. In some cases, a small quantity of oil (e.g. R290 only marginally better than R22. Simulation 0.1 % oil by mass in a R410A/POE mixture) could work of Devotta et al. (2005b) also found the pressure improve HTCcond and HTCevap by up to 10% and 5%, drop of R290 in both HXs are lower than that of R22 respectively, while a larger oil mass fraction, say 5%, when specifying a refrigerant mass flow rate of R290 488 | P a g e
- 4. Rotchana Prapainop, K O Suen / International Journal of Engineering Research and Applications (IJERA) ISSN: 2248-9622 www.ijera.com Vol. 2, Issue 4, July-August 2012, pp.486-493 the HTC decreases more severely by 25% (Lottin et al., conductivity and viscosity, the vapour density and the 2003b). evaporative HTC appeared to have the significant In general, a reduction in HTC and an increase in impact on system performance. two-phase pressure drop, for both evaporator and In general, the presence of oil could decrease HTC condenser, could be expected when oil is present and pressure drop, nevertheless it depends on the (Thome, u.d., Bassi and Bansal, 2003, Shen and Groll, amount of oil and the solubility. The consequence of 2005a, b). In addition, the effect of oil on local HTC the change in HTC and pressure drop can affect the varies with vapour quality, for example a 5% by mass system performance. in R134a/oil, at a vapour quality (x) of 0.5, could reduce the HTCevap by 20%, and at x = 0.9, the Nomenclatures HTCevap could drop by 80% (Zurcher et al., 1997, cp isobaric Thome, u.d.). specific heat [kJkg 1K1] Effect of oil on heat exchanger/system COP coefficient of performance performance (= A heat exchanger performance simulated by Qcool / Wcom ) [---] Rajakphaksa (2003) using R407C with an oil content of 0.5% – 2.5% of the refrigerant mass in the HX heat exchanger evaporator revealed a 2% reduction in overall heat HTC heat transfer transfer coefficient due to both the reduction in coefficient refrigerant mass flow rate and an about 25% increase [Wm2K1] in two-phase pressure drop. These caused about a 5% k thermal reduction in evaporator capacity. conductivity Experimentally, Lottin et al. (2003a) found that [Wm2K1] typical content of 1 – 5% of oil by mass in R410A MW molecular weight reduces the system COP by about 4 – 24%. [kg/kmol] Nevertheless, the effect of oil on the system T temperature [C or performance is negligible when the lubricant does not K] exceed 0.5% of the total refrigerant weight in the hrefrig refrigerating effect system. For a particular refrigerant (e.g. R407C) using [kJkg1] different oils with the same viscosity grade, the P pressure drop [kPa] evaporator capacity decreases when refrigerant-oil VRC volumetric solubility increases (Youbi-Idriss et al., 2003) due to refrigerating the reduction in the enthalpy change across the capacity or effect evaporator. (= hrefrig suc ) Conclusions [kJ/m3] In general, to obtain a high COP, density [kgm3] combinations of high values of latent heat, liquid dynamic (or thermal conductivity and vapour density and low absolute) viscosity values of liquid viscosities and molecular weight are [Pa s] required. Trade-offs between capacity and COP should specific volume be considered for critical temperature and vapour [m3kg1] specific heat. Subscripts It was noted that the evaluation of c, cond condenser or properties/parameters impact on the system condensation or performance also depends on whether the same conduction equipments are used or not. For new system, a dew dew (saturated refrigerant with a higher volumetric refrigerating vapour state) capacity (VRC) could use a smaller compressor for a e, evap evaporator, given capacity. For drop-in or retrofit, the VRC of evaporation alternative fluids should be similar to that of the lat latent replaced fluid to obtain a similar capacity without r refrigerant changing the compressor. From sensitivity point of view, the normal boiling point, the critical temperature, the liquid thermal 489 | P a g e
- 5. Rotchana Prapainop, K O Suen / International Journal of Engineering Research and Applications (IJERA) ISSN: 2248-9622 www.ijera.com Vol. 2, Issue 4, July-August 2012, pp.486-493 References U.S. Department of Commerce, National 1. Akei, M. and Mizuhara, K. 1997. The Bureau of Standards, Gaithersburg. elastohydrodynamic properties of lubricants 25. Domanski, P.A., Yashar, D. and Kim, M. 2. with refrigerant environments. Tribology 2005. Performance of a finned-tube Transactions, 40(1): 1-10. 26. evaporator optimized for different refrigerants 3. AREP 1994. Program status report. R-22 and its effect on system efficiency. alternative refrigerants evaluation program International Journal of Refrigeration, 28(6): 4. (AREP) [online]. Available from:www.ari.org 820-827. [Accessed June 20 2007]. 27. Gosney, W.B.1982. Principles of 5. Bansal, P.K., Dutto, T. and Hivet, B. 1992. refrigeration. Cambridge: Cambridge Performance evaluation of University Press. 6. environmentally benign refrigerants in heat 28. Granryd, E. 2001. Hydrocarbon as pumps 2: An experimental study with refrigerants-an overview. International Journal HFC134a. International Journal of of Refrigeration, 24: 15-24. Refrigeration, 15(6): 349-356. 29. Haberschill, P., Gay, L., Aubouin, P. and 7. Bassi, R. and Bansal, P.K. 2003. In-tube Lallemand, M. 2002. Performance prediction condensation of mixture of R134a and ester of a refrigerating machine using R407C: the 8. oil: Empirical correlations. International effect of the circulating composition on Journal of Refrigeration, 26: 402-409. system performance. International Journal of 9. Calm, J.M. and Domanski, P.A. 2004. R22 Energy Research, 26: 1295-1311. Replacement status. ASHRAE Journal, 30. Hogberg, M. and Vamling, L. 1996. Impact of 10. August: 29-39. uncertainties on estimates of heat pump cycle 11. Chang, Y.S., Kim, M.S. and Ro, S.T. 2000. performance. International Journal of Performance and heat transfer Refrigeration 19(1): 34-42. 12. characteristics of hydrocarbon refrigerants in 31. Hwang, Y. and Radermacher, R. 2002. a heat pump system. International Journal of Opportunities with alternative refrigerants Refrigeration, 23: 232-242. [online]. Available from: 13. Choi, T.Y., Kim, Y.J., Kim, M.S. and Ro, S.T. http://ieeexplore.ieee.org/iel5/7908/21811/010 2000. Evaporation heat transfer of 12533.pdf?arnumber=1012533. 14. R32, R134a, R32/134a and R32/125/134a 32. [Accessed March 09 2006]. inside a horizontal smooth tube. International 33. Hwang, Y., Jin, D.H. and Radermacher, R. Journal of Heat and Mass Transfer, 43: 3651- 2005. Comparison of hydrocarbon R-290 and 3660. two HFC blends R404A and R410A for low 15. Devotta, S. 1995. Alternative heat pump temperature refrigeration applications. working fluids to CFCs. Heat Recovery International Council of Air-Conditioning and 16. Systems and CHP, 15(3): 273-279. Refrigeration Manufacturer’s Associations 17. Devotta, S., Padalkar, A.S. and Sane, N.K. and Air-Conditioning and Refrigeration 2005a. Performance assessment of HCFC- Institute, November 17 at Virginia [online]. 18. 22 window air conditioner retrofitted with Available from: R407C. Applied Thermal Engineering, 25: http://www.icarma.org/green/documents/Gree 2937-2949. nReport-Lowtemp-Final-111705.pdf 19. Devotta, S., A.S. Padalkar, A.S. and Sane, [Accessed March 06 2006]. N.K. 2005b. Performance assessment of 34. Jung, D., Song, Y. and Park, B. 2000. 20. HC290 as a drop-in substitute to HCFC-22 in Performance of HCFC22 alternative a window air conditioner, International refrigerants. International Journal of Journal of Refrigeration, 28: 594–604. Refrigeration, 23:466-474. 21. Didion, D.A. 1999. The influence of the 35. Kumar, K.S. and Rajagopal, K. 2007. thermo-physical fluid properties of the new Computational and experimental 22. Ozone-safe refrigerants on performance. investigationof low ODP and low GWP International Journal of Applied HCFC-123 and HC-290 refrigerant mixture Thermodynamics, 2(1): 19-35. alternate to CFC-12. Energy Conversion and 23. Domanski, P.A. and Didion, D.A. 1987. Management, 48: 3053-3062. Impact of refrigerant property uncertainties 36. Lee, H., Yoon, J., Kim and Bansal, P.K. 2006. 24. on prediction of vapour compression cycle Characteristics of condensing and evaporating performance. Report No. NBSIFI 86-3373, heat transfer using hydrocarbon refrigerants. Applied Thermal Engineering, 26: 1054-1062. 490 | P a g e
- 6. Rotchana Prapainop, K O Suen / International Journal of Engineering Research and Applications (IJERA) ISSN: 2248-9622 www.ijera.com Vol. 2, Issue 4, July-August 2012, pp.486-493 37. Lee, G.H. and Yoo, J.Y. 2000. Performance 50. Shen, B. and Groll, E.A. 2005b. A critical analysis and simulation of automobile air review of the influence of lubricants on the conditioning system. International Journal of heat transfer and pressure drop of refrigerants, Refrigeration, 23:243-254. Part II: Lubricant influence on condensation 38. Lottin, O., Guillemet, P., Lebreton, J.M. and pressure drop. HVAC & R Research, 11 2003a. Effects of synthetic oil in a (4), October: 511-526. compression refrigeration system using 51. Spatz, M.W. and Motta, S.F.Y. 2004. An R410A. Part I: modelling of the whole system evaluation of options for replacing HCFC22 and analysis of its response to an increase in in medium temperature refrigeration system. the amount of circulating oil. International International Journal of Refrigeration, 27: Journal of Refrigeration, 26: 772-782 475-483. 39. Lottin, O., Guillemet, P., Lebreton, J.M. 52. Spauschus, H.O. and Henderson, D.R. 1995. 2003b. Effects of synthetic oil in a New working fluids for refrigeration. compression refrigeration system using 53. 19th International Congress of Refrigeration R410A. Part II: quality of heat transfer and Proceeding, 4b:1006-1013. pressure losses within the heat exchangers. 54. Thome, J.R. unknown date. Wolverine 40. International Journal of Refrigeration, 26: Engineering Databook III [online]. Available 783-794. from: 41. McLinden, M.O. and Didion, D.A. 1987. ww.wlv.com/products/databook/db3/DataBoo Quest for alternatives. ASHRAE Journal, kIII.pdf [Accessed November 14 2006]. 29(12): 32-42. 55. Tuomas, R. 2006. Properties of oil and 42. MPROG: BNCR35, unknown date. BNCR35: refrigerant mixtures-Lubrication of ball Overview of new and alternative refrigerants bearing in refrigeration compressors. Doctoral [online].Available from: thesis, Lulea University of Technology. http://www.mtprog.com/ApprovedBriefingNo 56. UNEP 2006. The secretariat of United tes/PDF/MTP_BNCR35_2008January17.pdf Nations Environment Programme. 2006. [Accessed January 31 2008]. 57. Handbook for the Montreal Protocol on 43. Petersson, B. and Thorsell, H. 1990. Substances that Deplete the Ozone Layer, Comparison of the refrigerants HFC134a and Seventh edition [online]. Available from: 44. CFC12. International Journal of Refrigeration, http://ozone.unep.org/Publications/MP_Handb 13:176-180. ook/index.shtml. [Accessed November 01 45. Purkayastha, B. and Bansal, P.K. 1998. An 2007]. experimental study on HC290 and a 58. UNEP 2007. The secretariat of the United commercial liquefied petroleum gas (LPG) Nations Framework Convention on Climate mix as a suitable replacement for HCFC22. 59. Change. Kyoto Protocol [online]. Available International Journal of Refrigeration, from: 21(1):3-17. http://unfccc.int/kyoto_protocol/items/2830.p 46. Rajapaksha, K.L. 2003. Performance hp [Accessed October 10 2007]. evaluation of reversible heat pumps when 60. Urchueguia, J.F., Corberan, J.M., Gonzalvez, using refrigerant mixtures. Ph.D. thesis. J., Diaz, J. M. 2004. Experimental University College London. characterisation of a commercial-size scroll 47. Rajapaksha, L. 2007. Influence of special and reciprocating compressor working with attributes of zeotropic refrigerant mixtures on R22 and propane(R290). EcoLibrium, May: design and operation of vapour compression 20-25. refrigeration and heat pump systems. Energy 61. Wei, W., Ding, G., Hu, H. and Wang, K. Conversion and Management, 48: 539-545. 2008. Model of thermodynamic and transport 48. Saleh, B. and Wendland, M. 2006. Screening properties of POE VG68 and R410A/POE of pure fluids as alternative refrigerants. VG68 mixture. Energy and Power International Journal of Refrigeration, 29: Engineering, 2: 227-234. 260-269. 62. Wen, M. and Ho, C. 2005. Evaporation heat 49. Shen, B. and Groll, E.A. 2005a. A critical transfer and pressure drop characteristics of review of the influence of lubricants on the R290 (propane), R600 (butane) and a mixture heat transfer and pressure drop of refrigerants, of R290/R600 in the three-lines serpentine Part I: Lubricant influence on pool and flow small-tube bank. Applied Thermal boiling. HVAC & R Research, 11 (3), July: Engineering, 25: 2921-2936. 341-359. 491 | P a g e
- 7. Rotchana Prapainop, K O Suen / International Journal of Engineering Research and Applications (IJERA) ISSN: 2248-9622 www.ijera.com Vol. 2, Issue 4, July-August 2012, pp.486-493 63. Woollatt, D. 1982. Estimating valve losses evaporator: experimental validation of a when dynamic effects are important. refrigerant/oil mixture enthalpy calculation 64. Proceeding of Purdue compressor technology model. International Journal of Refrigeration, conference. Purdue university. 27:215-224. 65. Youbi-Idrissi, M., Bonjour, J., Marvillet, C. 67. IIF-IIR Bulletin. and Meunier, F. 2003. Impact of refrigerant- http://www.iifiir.org/en/doc/1160.pdfZurcher, oil solubility on an evaporator performance O., Thome, J.R. and Favrat, D. 1997. Flow working with R407C. International Journal of boiling and pressure drop measurements for Refrigeration, 26: 284-292. R134a/oil mixtures. Part 2: Evaporation in a 66. Youbi-Idrissi, M., Bonjour, J., Marvillet, C. Plain tube. HVAC&R Research, 3(1): 54-64. and Meunier, F. 2004. Oil presence in an Temperature excess superheat low cv,vap,mol high cv,vap,mol wet compression Entropy Figure 1 Effect of vapour heat capacity on the shape of the two-phase region or “vapour dome” on a temperature-entropy diagram (as adapted from Didion, 1999) Table 1 Summary of desirable values of refrigerant properties for high COP Refrigerant properties Recommended values High Low Latent heat x Critical temperature x Liquid thermal conductivity x Vapour density x Vapour specific heat x Liquid viscosity x Molecular weight x 492 | P a g e
- 8. Rotchana Prapainop, K O Suen / International Journal of Engineering Research and Applications (IJERA) ISSN: 2248-9622 www.ijera.com Vol. 2, Issue 4, July-August 2012, pp.486-493 Table 2 Variations in system performance caused by changes in thermo-physical properties and derived parameters in sensitivities analysis Properties Sensitivities References Tcrit, Tb Tcrit and Tb 2 % => Qheat 11-14 %, COP 0.3-1.8 Hogberg and Vamling (1996) % (vary depending on refrigerants); Tcrit and Tb 2 % => Qheat 11-14 %, COP 0.7-2.3 % (vary depending on refrigerants) cp cp,vap 5 % => Qheat 1-4 %, COP 0.5-1.2 %, Hogberg and Vamling (1996) cp,vap 5 % => Qheat 1-4 %, COP 0.5-1.2 % liq 15% => Qheat 0.6-0.7 %, COP 0.4-0.5 % Hogberg and Vamling (1996) vap 15% => Qheat and COP ~ no significant change liq 50 % => Qcool 4 %, W 1% Domanski and Didion (1987) k kliq 10 % => Qheat 0.5-0.6 %, COP 0.5-0.6 % Hogberg and Vamling (1996) kvap 15 % => Qheat and COP ~ no significant change kliq 50 % => Qcool 3 %, Wcom 0.8 % Domanski and Didion (1987) kliq 50 % => Qcool 7 %, Wcom 1.6 % liq 10 % => Qcool 0.5 %, Wcom ~ no change Domanski and Didion (1987) vap 10 % => Qcool 0.3 %, Wcom 6 % vap 10 % => Qcool 0.5 %, Wcom 7 % HTCevap HTCevap 30 % => Qheat 2.2 %, COP 1.8 % HTCevap 30 % => Qheat 4 %, COP 2.5 % Hogberg and Vamling (1996) HTCevap 50 % => Qcool 2.5 %, Wcom 1 % Domanski and Didion (1987) HTCevap 50 % => Qcool 6 %, Wcom 2.5 % HTCcond HTCcond 30 % or 30 % => Qheat and COP ~ no significant change Hogberg and Vamling (1996) HTCcond 50 % => Qcool 0.5 %, Wcom 0.5 % Domanski and Didion (1987) HTCcond 50 % => Qcool 2 %, Wcom 1.5 % (P/z)evap (P/z)evap 20 % => Qheat 0.6 %, COP 0.2 % (P/z)evap 20 % => Qheat 0.6 %, COP 0.1 % Hogberg and Vamling (1996) (P/z)evap 100 % => Qcool 2 %, Wcom 0.8 % Domanski and Didion (1987) (P/z)evap 50 % => Qcool 1 %, Wcom 0.3 % (P/z)cond (P/z)cond change from 50 to 100 %, Qcool and Wcom ~ no significant change. Domanski and Didion (1987) Notes: 1) The numbers shown in the table are derived from the graphical results in the published literature. 2. Domanski and Didion (1987) studied only one refrigerant (R22), while Hogberg and Vamling (1996) studied R134a, R600a, R152a and R22/R142b. 493 | P a g e