Asclme monitoring and indicators scott for iw learn v3
•Descargar como PPT, PDF•
2 recomendaciones•336 vistas


Recomendados
Recomendados
Más contenido relacionado
La actualidad más candente
La actualidad más candente (20)
Destacado
Destacado (8)
Similar a Asclme monitoring and indicators scott for iw learn v3
Similar a Asclme monitoring and indicators scott for iw learn v3 (20)
Más de Iwl Pcu
Más de Iwl Pcu (20)
Último
Último (20)
Asclme monitoring and indicators scott for iw learn v3
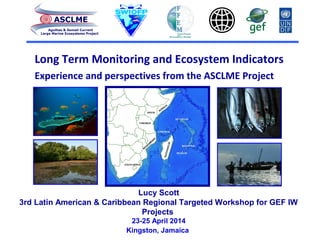
- 1. Long Term Monitoring and Ecosystem Indicators Experience and perspectives from the ASCLME Project ASCLME Agulhas & Somali Current Large Marine Ecosystems Project Lucy Scott 3rd Latin American & Caribbean Regional Targeted Workshop for GEF IW Projects 23-25 April 2014 Kingston, Jamaica
- 2. Agulhas and Somali Currents Large Marine Ecosystem (ASCLME) Project •Somalia •Kenya •Tanzania •Mozambique •South Africa •Comoros •Madagascar •Seychelles •Mauritius •(France) 2008-2014
- 3. GEF Projects in the region 1. Addressing Land-based Activities in the Western Indian Ocean (WIO-LaB), focusing on the issues relating to land-based sources of pollution and other activities that impact on the marine and coastal environment (UNEP). 2. South Western Indian Ocean Fisheries Project (SWIOFP), addressing the issues related to assessment and shared management of the region’s offshore commercial fisheries (World Bank). 3. Agulhas and Somali Currents Large Marine Ecosystem (ASCLME) Project, whose scope is focused on issues relating to ocean dynamics, productivity, artisanal fisheries, coastal livelihoods, marine pollution and invasive species (UNDP).
- 4. Project Objectives 1) A Transboundary Diagnostic Analysis 2) A Strategic Action Programme
- 5. Causal chain analysis TDA / SAP DEVELOPMENT PROCESS MEDA National Marine Ecosystem Diagnostic Analysis National Areas of Concern Causes Regional Ecosystem status and Areas of Concern TDA
- 6. The TDA is based on information from the MEDAs, the analyses in the CCAs, inshore/offshore surveys, and on additional studies….. The Transboundary Diagnostic Analysis (TDA) MEDA CCA TDA SAP Cruises Moorings Parallel Policy and Governance Process • Permanent coordinator for policy-level interaction • National and regional P&G assessments • Policy Advisory committee at DG / PS level
- 7. The Transboundary Diagnostic Analysis (TDA) MEDA CCA TDA SAP The four main areas of concern were identified as: Water Quality Degradation •Alteration of natural river flow and changes in freshwater input and sediment load •Degradation of ground and surface water quality Habitat and Community Modification •Shoreline change, land reclamation and coastal erosion •Disturbance, damage and degradation of open water habitats •Introduction of alien and invasives species Declines in Living Marine Resources •Overexploited fisheries. •Impacts on other non-target species •Loss or disturbance of natural habitats •Excessive by-catch and discards Unpredictable Environmental Variability and Extreme Events •Climate hazards and extreme weather events •Sea level change •Ocean acidification
- 8. Causal chain analysis TDA / SAP DEVELOPMENT PROCESS Targets MEDA National Marine Ecosystem Diagnostic Analysis National Areas of Concern Causes Regional Ecosystem status and Areas of Concern TDA Strategic Action Programme (SAP) SAPPHIRE Project Vision Ecosystem Quality Objectives Indicator development Actions
- 9. TDA Baseline assessment of the ecosystem The TDA-SAP Process and the role of ecosystem monitoring
- 10. TDA Baseline assessment of the ecosystem Business as usual Risk of further degradation Unsustainable management practices
- 11. TDA SAP Baseline assessment of the ecosystem Business as usual
- 12. TDA SAP Baseline assessment of the ecosystem Areas of Concern Business as usual
- 13. TDA SAP SAP Implementation Baseline assessment of the ecosystem Areas of Concern Business as usual
- 14. TDA SAP SAP Implementation Baseline assessment of the ecosystem Areas of Concern ACTIONS Business as usual
- 15. TDA SAP SAP Implementation Baseline assessment of the ecosystem Areas of Concern ACTIONS Business as usual Joint action
- 16. TDA SAP SAP Implementation Baseline assessment of the ecosystem Areas of Concern ACTIONS Business as usual Joint action Environmental status and socio-economic indicators Stress reduction indicators Process indicators
- 17. TDA SAP SAP Implementation Baseline assessment of the ecosystem Areas of Concern ACTIONS Business as usual Joint action Environmental status and socio-economic indicators Stress reduction indicators Process indicators Management and governance Fish and fisheries Ecosystem Health Socio- economics Productivity Water quality and pollution
- 18. TDA SAP SAP Implementation Baseline assessment of the ecosystem Areas of Concern ACTIONS Business as usual Joint action Environmental status and socio-economic indicators Stress reduction indicators Process indicators Fish and fisheries Ecosystem Health Socio- economics Productivity Management and governance SAPPHIREproject Water quality and pollution
- 19. The Strategic Action Programme Policy Harmonisation and Institutional Reforms (SAPPHIRE) aims to implement elements of the SAP throughout the WIO region The Project has five components 1. Executing Management and Policy Reforms through a Knowledge-Based Governance Mechanism 2. Stress Reduction within the LMEs through Community-Level Stakeholder Engagement and Empowerment in SAP Implementation 3. Stress Reduction in Marine Pollution within the WIO LMEs through Private Sector/Industry Commitment to transformations in their Operations and Management Practices 4. Innovative Management Mechanisms for Extended Continental Shelf and High Seas Areas with the LMEs 5. Capacity Building and Training for Effective SAP Implementation and Long-term Ecosystem Monitoring
- 20. Types of indicators 1. Process indicators 2. Stress reduction indicators 3. Environmental and socio-economic status indicators
- 21. 1. PROCESS indicators Are indicators of project, institutional, or policy reform. These are set out in: A) the overall regional SAP against 5 and 20 year targets (to meet overall EQOs) B) The SAPPHIRE project indicator set (from the logframe, against specific Project targets). This set maps across to the GEF IW Tracking Tool)
- 22. Relate to specific measures implemented by collaborating countries These are set out in: A) the overall regional SAP against 5 and 20 year targets (to meet overall EQOs) B) The SAPPHIRE project indicator set (from the logframe, against specific Project activities and targets). 2. STRESS REDUCTION indicators
- 23. Component 1: Supporting Management and Policy Reforms for SAP implementation through national and regional level collaboration and monitoring Example from SAPPHIRE Project indicators
- 24. TDA SAP SAP Implementation Baseline assessment of the ecosystem Areas of Concern ACTIONS Business as usual Joint action Environmental status and socio-economic indicators Stress reduction indicators Process indicators Management and governance SAPPHIREproject Fish and fisheries Ecosystem Health Socio- economics Productivity Water quality and pollution
- 25. Tracking of the overall ecosystem response to Process/stress reduction interventions. The objective may be rehabilitation or improvement, or just maintenance of healthy systems. Not just ecological; environmental status indicators are also used to measure whether communities/stakeholder benefit materialises 3. ENVIRONMENTAL STATUS + SOCIO-ECONOMIC indicators
- 26. ASCLME approach to defining environmental status indicators We have reviewed existing monitoring programmes in the WIO, with additions from the MEDAs, peer review and Causal Chain Analysis Workshops and TDA development process. Some regional programmes have standardised methods, while country-specific monitoring may employ methods unique to particular countries or institutions A Panel meeting made up of countries and regional partners further refined indicator sets The ASCLME project (with countries and partners) has established 47 possible long term monitoring data sets We have identified national, regional and global partners and stakeholders
- 27. Long term monitoring of environmental status Within each of the five themes, the ASCLME and SWIOF Projects have established partnerships for data collection (nearshore and offshore expeditions, remote sensing of the environment, modelling, processing, data management and dissemination). These partners AND others identified during the first phase of the projects will be involved & responsible for components of the M&I programme. Fish & fisheries • FAO • IOTC •SWIOFC • SIOFA • IndiSeas Ecosystem health • IOSEA, GEO Bon • GCRMN, CBD •FAO EAF Nansen • NOAA, NIOZ, WOC • IOC/UNESCO • IRD, JAMSTEC • CORDIO, GOOS •Seagrass Watch •IUCN, WWF, CI •BirdLife International Productivity • FAO EAF Nansen • NOAA, NIOZ, WOC • IOC/UNESCO • IRD, JAMSTEC • CORDIO, GOOS Water quality & pollution • Nairobi Convention • COI • IMO Socio-economics • CORDIO • SocMon WIO
- 28. Fish and fisheries (28) Lead / partners • FAO • IOTC •SWIOFC • SIOFA • IndiSeas Parameters monitored • Catch • Bycatch • Use of bycatch exclusion devices Indicators • Catch rate • Fishing in balance • Marine Trophic Index • % Bycatch reduction
- 29. Ecosystem Health (39) Lead / partners • IOSEA, GEO Bon • GCRMN, CBD •Seagrass Watch •IUCN, WWF, CI •BirdLife International Parameters monitored • Critical habitats (coral reefs, seagrass beds, mangroves) • Focal species •Shoreline Indicators • % habitat change • Condition of habitat • Change in status of focal species •Shoreline change
- 30. Productivity (3) Lead / partners • FAO EAF Nansen • NOAA, NIOZ, WOC • IOC/UNESCO • IRD, JAMSTEC • CORDIO, GOOS Parameters monitored • In-situ ocean (temp, nutr) • RS ocean (SST, Chlor) • Currents Indicators • Degrees, % of change • Monitoring of monsoon events • Monitoring of mesoscale features
- 31. Water quality and pollution (8) Lead / partners • Nairobi Convention • COI • IMO Parameters monitored • Inshore coastal water quality • POPs •River discharge Indicators • Bacterial load • Incidence of related diseases
- 32. Socio-economics (~29+54) Lead / partners • CORDIO • SocMon WIO Parameters monitored • 54 SOC MON variables Indicators • change over time
- 33. Notes for each indicator Data Sources Baseline Indicator detail Target Resolution/Scale Frequency of monitoring Indicator reporting rate Notes Indicator links to / contributes to Priority (H/M/L) National institutions Regional partners Data design & collection Processing Indicator reporting Data management Dissemination Monitoring data set - source and metadata Whether a complete baseline exists or not, temporal detail How it is calculated Target Other regional and global programmes (GCRMN, OHI, TWAP etc)
- 34. Crosscutting partners for indicator development • IOC/UNESCO’s African Marine Atlas • IndiSeas (Indicators for the Seas ); a SWIOFP partner • UBC’s (University of British Columbia) Seas Around Us Project • OHI (Ocean Health Index) a global programme; maximising sustainable use • TWAP (Transboundary Waters Assessment Programme)
- 35. Crosscutting partners for indicator implementation •IOC/UNESCO’s African Marine Atlas • The Nairobi Convention •WIOMSA • OHI (Ocean Health Index) • TWAP (Transboundary Waters Assessment Programme)
- 36. A multi-partner Alliance has been established for long term ocean-atmosphere monitoring • Track and understand change and trends in the state of ecosystem processes over the long term • Understand anthropogenic effects as well as natural change • Access long term forecasts where reliable and useful for management purposes. • Understand the effects of transboundary management interventions • Management and dissemination of data • Create a link between observations and governance
- 37. Annual Cruises of Alliance Partners • Ongoing collection of ocean-atmosphere data and servicing of moorings for near-real time data streams. • Needs to be independent of GEF-investments (sustainable)
- 38. The final ecosystem monitoring and indicators framework will be defined during the implementation of the SAPPHIRE project A pragmatic sub-set needs to be chosen based on maximising information derived, and co-funding and support from countries and other programmes. Indicators must be nested and integrated with national reporting requirements as well as global programmes Ecosystem monitoring at National level needs to be aligned with other existing reporting requirements (to minimise the burden of time) and will be reflected in the revised MEDAs. Conclusion
- 39. Process/stress reduction Environmental status Global GEW IW Tracking Tool TWAP OHI IndiSEAS Regional Regional SAP (SAPPHIRE) LME indicators National National Action plans State of the ecosystem