From the Arctic to the Tropics: The U.S. UNCLOS Bathymetric Mapping Program

Since CHC2006, the University of New Hampshire’s Center for Coastal & Ocean Mapping/Joint Hydrographic Center has mapped with multibeam, the bathymetry of an additional ~220,000 km2 of seafloor in areas as diverse as the Arctic, the Northern Marianas of the western Pacific and the Gulf of Mexico. The mapping supports any potential U.S. submission for of extended continental shelves under Article 76 of the United Nations Convention of the Law of the Sea. Consequently, the mapping has concentrated on capturing the complete extent of the 2500-m isobath and the zone where the Article 76-defined foot of the slope exists. In practice, the complete area between ~1500 and ~4500 m water depths is mapped in each region (with the exception of the Arctic Ocean). The data have been collected in conditions that range from harsh Arctic sea ice to the calms of the Philippine Sea tropics. Although, some of the conditions have limited the quality of some of the data, the data quality is generally quite good and geological surprises have been uncovered on each of the cruises.

Recomendados
Recomendados
Más contenido relacionado
La actualidad más candente
La actualidad más candente (20)
Similar a From the Arctic to the Tropics: The U.S. UNCLOS Bathymetric Mapping Program
Similar a From the Arctic to the Tropics: The U.S. UNCLOS Bathymetric Mapping Program (20)
Último
Último (20)
From the Arctic to the Tropics: The U.S. UNCLOS Bathymetric Mapping Program
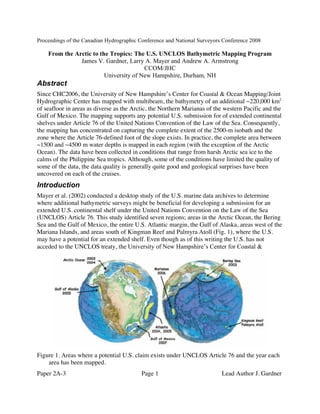
- 1. Proceedings of the Canadian Hydrographic Conference and National Surveyors Conference 2008 Paper 2A-3 Page 1 Lead Author J. Gardner From the Arctic to the Tropics: The U.S. UNCLOS Bathymetric Mapping Program James V. Gardner, Larry A. Mayer and Andrew A. Armstrong CCOM/JHC University of New Hampshire, Durham, NH Abstract Since CHC2006, the University of New Hampshire’s Center for Coastal & Ocean Mapping/Joint Hydrographic Center has mapped with multibeam, the bathymetry of an additional ~220,000 km2 of seafloor in areas as diverse as the Arctic, the Northern Marianas of the western Pacific and the Gulf of Mexico. The mapping supports any potential U.S. submission for of extended continental shelves under Article 76 of the United Nations Convention of the Law of the Sea. Consequently, the mapping has concentrated on capturing the complete extent of the 2500-m isobath and the zone where the Article 76-defined foot of the slope exists. In practice, the complete area between ~1500 and ~4500 m water depths is mapped in each region (with the exception of the Arctic Ocean). The data have been collected in conditions that range from harsh Arctic sea ice to the calms of the Philippine Sea tropics. Although, some of the conditions have limited the quality of some of the data, the data quality is generally quite good and geological surprises have been uncovered on each of the cruises. Introduction Mayer et al. (2002) conducted a desktop study of the U.S. marine data archives to determine where additional bathymetric surveys might be beneficial for developing a submission for an extended U.S. continental shelf under the United Nations Convention on the Law of the Sea (UNCLOS) Article 76. This study identified seven regions; areas in the Arctic Ocean, the Bering Sea and the Gulf of Mexico, the entire U.S. Atlantic margin, the Gulf of Alaska, areas west of the Mariana Islands, and areas south of Kingman Reef and Palmyra Atoll (Fig. 1), where the U.S. may have a potential for an extended shelf. Even though as of this writing the U.S. has not acceded to the UNCLOS treaty, the University of New Hampshire’s Center for Coastal & Figure 1. Areas where a potential U.S. claim exists under UNCLOS Article 76 and the year each area has been mapped.
- 2. Proceedings of the Canadian Hydrographic Conference and National Surveyors Conference 2008 Paper 2A-3 Page 2 Lead Author J. Gardner Ocean Mapping/Joint Hydrographic Center was directed by Congress, through funding to NOAA in 2003, to commence a multiyear multibeam bathymetry-mapping campaign of the above U.S. areas (Gardner et al., 2006). Over and above the obvious importance of the data to potential U.S. UNCLOS submissions for an extended continental shelf, the new bathymetry data are undoubtedly even more important to the science of marine geology. The new data provide high-resolution databases that will be used in continuing attempts to identify and understand the processes that occur on ~70% of Earth’s surface – the seafloor. To date, about 60% of the identified Arctic Ocean area, the entire area identified in the Bering Sea, all of the original U.S. Atlantic margin area, both areas in the Gulf of Mexico, the entire area in the Commonwealth of the Northern Mariana Islands and Guam and all the area in the Gulf of Alaska, have been mapped under this program. Together, the total area mapped exceeds 1,000,000 km2 . A discussion of the bathymetry mapping up to the time of the 2005 U.S. Hydro conference can be found in Gardner et al. (2005). The purpose of this report is to briefly describe the completed mapping surveys since the 2005. Background The multibeam echosounder systems used in the post-2005 surveys include an L3 SeaBeam 2112 on the U.S. Coast Guard Ice Breaker Healy, a Kongsberg Maritime EM121A system aboard the U.S. Naval Oceanographic Office vessel USNS Bowditch and a Kongsberg Maritime EM120 on the C&C Technologies, Inc. research vessel R/V Northern Resolution. All of the systems operate at 12 kHz and achieve swath widths of at least 120˚. These multibeam systems produce high- quality bathymetry as well as co-registered acoustic backscatter in ideal sea conditions; however, in more challenging conditions such as the high Arctic or in typhoons in the western Pacific, the data can sometimes be less than high quality. Regardless of the quality, used together, the bathymetry and co-registered backscatter provide not only a high-resolution view of the seafloor but also some suggestion of the geological character of the seafloor. Results Arctic Ocean The USCG Icebreaker Healy traversed approximately 10,000 km in 30 days during the summer of 2007 (Fig. 2). The primary objectives of the cruise were to: 1) complete the mapping of the 2500-m isobath that was started in 2003 and continued in 2004; 2) begin to locate the UNCLOS Article 76-defined foot of the slope around the northern and eastern edges of Chukchi Cap; and 3) further map an area of pockmarks on Chukchi Cap originally discovered in 2003. All objectives were achieved, far beyond expectations. The 2007 cruise mapped a total area of ~70,000 km2 (using a nominal swath width of 7 km). The cruise first encountered ice at approximately 76˚N that consisted of thick, multi-year ice but was broken up enough to allow relatively easy passage at 3 to 6 kts. No definitive foot of the slope was apparent until a long excursion to the north revealed a clear transition between the slope and
- 3. Proceedings of the Canadian Hydrographic Conference and National Surveyors Conference 2008 Paper 2A-3 Page 3 Lead Author J. Gardner flat-lying abyssal plain sediments at approximately 81˚15’N. Several more north–south transits consistently found this same slope/plain transition on the northern end of the cap north of 81˚N. Figure 2. Trackplot of HEALY-0703 expedition, Aug-Sept 2007. A well-developed foot of the slope was traced along the eastern side of Northwind Ridge, revealing a very sharp and clear slope-abyssal plain transition with the abyssal plain sediments consistently occurring at a depth of ~3820 m. This transition appears to define a continuous foot of the slope around the northern most extreme of Chukchi Cap to the northern-most point of the survey (82˚17’N). An area of large, well-developed pockmarks, probably related to gas expulsion, was mapped at ~ 400 m depth on the Chukchi Cap (Fig. 3). In addition, a remarkable series of closely spaced, NW-SE oriented, parallel grooves (3 to 5 m deep) was also found in this area. Given the parallel nature of these grooves, they appear to be related to ice-sheet flow rather than individual icebergs scours. South of these grooves, as the present water depths get deeper, there are a series of large, dune-like features that appear erosional in origin (Fig 3). These may be related to flow under an ice shelf that was not firmly grounded but was near the seafloor. Commonwealth of the Northern Mariana Islands and Guam The western insular margin of the West Mariana Ridge (WMR) (Fig. 4), located about 250 km west of the islands of the Commonwealth of the Northern Mariana Islands and Guam has now been mapped almost in its entirety (Fig. 5). The mapping was focused between the ~2000 m and 5000 m isobaths and includes complete coverage of the 2500-m isobath and the zone where a Chukchi Cap Northwind Ridge
- 4. Proceedings of the Canadian Hydrographic Conference and National Surveyors Conference 2008 Paper 2A-3 Page 4 Lead Author J. Gardner foot of the slope, as defined by the UNCLOS, will be found. The total area mapped is 184,262 km2 . The West Mariana Ridge has seen little scientific study compared to the Mariana Ridge with Figure 3. Parallel grooves and dune-like bedforms found at ~400-m water depth on Chukchi Cap an active subduction zone, volcanoes, and islands; surefire attractions for geoscientists. Generally, the West Mariana Ridge is thought to be a remnant island arc (Karig, 1972) that ceased volcanic activity about 7 Ma ago (Stern et al., 2003). Since the cessation of volcanism, the West Mariana Ridge is thought to have subsided at least a kilometer (Park et al, 1990). The western flank of the West Mariana Ridge is composed of almost 100 extinct volcanoes, surrounded by an apron of volcanic debris that merges with the basin sediments to the west. Some of the most startling discoveries of the 2006 and 2007 multibeam bathymetry cruises are 27 very well-developed submarine channel systems that have eroded into the volcanic apron (Fig. 5). The channels are 2- to 4-km wide and entrenched 40 to 60 m into the volcanic apron. Although the slopes of the channel floors are typically less than 1˚, almost all of them show evidence of extensive channel-bank erosion into the volcanic apron. Many of the channel systems show a third-order dendritic pattern (Fig. 6) typical in subaerial environments of
- 5. Proceedings of the Canadian Hydrographic Conference and National Surveyors Conference 2008 Paper 2A-3 Page 5 Lead Author J. Gardner Figure 4. Location of Mariana mapping in the western Pacific (yellow polygon). erosion in horizontal sediments with uniform resistance to erosion on gentle regional slopes (Howard, 1967). Clearly, none of these conditions apply to these submarine channels. However, in virtually all geomorphic aspects, these submarine channel systems resemble their subaerial counterparts, even though the submarine channels have never seen the light of day. Another surprise was the mapping of 17 seamounts (extinct volcanoes) along the crest of the West Mariana Ridge whose summits are today less than 500 m deep (Fig. 7). If the conventional geological wisdom is followed that the West Mariana Ridge has subsided at least 1000 m since
- 6. Proceedings of the Canadian Hydrographic Conference and National Surveyors Conference 2008 Paper 2A-3 Page 6 Lead Author J. Gardner Figure 5. Multibeam bathymetry (left) and locations of channels and depositional lobes (right) of Marianas area. Figure 6. Left panel is shaded-relief map view of channel system on west flank of West Mariana Ridge. Right panel shows outline of the dendritic pattern of channel. Scale bar 10 km.
- 7. Proceedings of the Canadian Hydrographic Conference and National Surveyors Conference 2008 Paper 2A-3 Page 7 Lead Author J. Gardner volcanic activity ceased (e.g., Park et al, 1990), then most of the summits of submarine volcanoes should now be many hundreds of meters deep. In addition, those volcanoes that rose above sea level when they were active should have been eroded at sea level to form a flat summit (i.e., a guyot), yet only two of the seamounts are guyots; all the other summits are conical (i.e., have not been eroded by sea level). The implication is that the West Mariana Ridge has not subsided 1000 m since volcanism ceased and that the ridge may be either younger than thought or submarine volcanism has reactivated since the accepted 7 Ma age of volcanism cessation. Figure 7. Oblique view of bathymetry of WMR showing numerous volcanoes whose summits are shallower than 500 m. Gulf of Mexico The Florida Escarpment and the Sigsbee Escarpment in the Gulf of Mexico, (Fig. 8) were identified by Mayer et al. (2002) as areas that need new bathymetry surveys. The areas total ~31,300 km2 and were mapped in a single cruise in 2007 using the C&C Technologies RV Northern Resolution with a Simrad EM120 multibeam echosounder. Both areas, outlined in Figure 8. Location of Florida and Sigsbee Escarpments, northern Gulf of Mexico.
- 8. Proceedings of the Canadian Hydrographic Conference and National Surveyors Conference 2008 Paper 2A-3 Page 8 Lead Author J. Gardner yellow polygons on Figure 8, were mapped between the ~1000- and ~3500-m isobaths. Although these two areas did not reveal big surprises on the scale of those found in the mapping in the Arctic and Marianas regions, details of the seafloor that were only hinted at from previous non-multibeam surveys are clearly delineated in the new data. One such feature is the youngest depositional lobe of the Mississippi Fan. Although barely resolved in the new bathymetry, the fine details of the Figure 9. Map views of bathymetry (left) and acoustic backscatter (right) of the youngest depositional lobe (yellow arrows) of the Mississippi Fan. depositional lobe are clearly shown in the new co-registered acoustic-backscatter image (Fig. 9 right), even in 3300 m water depth and 500 km away from the head of the fan. Other newly mapped features that came as surprises are a series of plunge pools at the base of the Florida Escarpment and extensive erosion on the top of the Florida Escarpment. The erosion occurs in several forms, but all of the erosion falls in the general category of large gravity-induced failures. Twichell et al. (1991) described the erosion from long-range sidescan-sonar images but the details of the bathymetry were not resolved. The multibeam data add an entirely new perspective into the style of erosion on the top of the escarpment. The Sigsbee Escarpment (Fig. 8) is the seaward edge of an advancing subsurface salt wedge (e.g., Amery 1969; Ewing, 1991). The escarpment is 400- to 500-m high rising above a seafloor of ~3150-m deep with slopes of ~15˚. Although the escarpment region has been studied in detail for several decades, the new multibeam mapping reveals additional information on recently discovered features. Mega- furrows with wavelengths of 20- to 200-m have been found at the base of the Sigsbee Escarpment (Bryant et al., 2000; Bryant et al., 2001; George et al., 2002; Lee and George, 2004) but their full extent has not yet been mapped. The new bathymetry barely resolves the mega-furrows but the co-registered acoustic- backscatter data show that the mega-furrows occur along the full 200-km extent of
- 9. Proceedings of the Canadian Hydrographic Conference and National Surveyors Conference 2008 Paper 2A-3 Page 9 Lead Author J. Gardner the escarpment, including on the surface of Bryant Fan, and that the mega-furrows trend 15˚ to 22˚ to the isobaths (Fig. 10). Figure 10. Oblique view of bathymetry (left panel) and acoustic backscatter (right panel) of mega-furrows that occur along the base of Sigsbee Escarpment. Conclusions New 12-kHz multibeam bathymetry and acoustic backscatter from the Arctic Ocean, Gulf of Mexico and the Marianas region of the Philippine Sea are the fundamental datasets that will be used in any potential U.S. submission for an extended continental shelf under the U.N. Convention on the Law of the Sea. Although the data were collected for this purpose, perhaps their greater value is in the advancement of knowledge about the processes along the margins of the deep sea. Toward that end, all the bathymetry and acoustic-backscatter data, in formats that include images, ASCII XYZ soundings, ESRI ArcGIS grids and IVS3D sd grids, along with the corresponding metadata are being made publically available, and can be found and freely downloaded on the web at http://ccom.unh.edu/law_of_the_sea.html. Acknowledgements We gratefully acknowledge the fine ship masters, crews and especially the technical teams of the U.S. Coast Guard icebreaker Healy, the U.S. Naval Oceanographic ship USNS Bowditch and the C&C Technology RV Northern Resolution, without whom none of these data could have been collected. This project is a product of NOAA Grant NA05NOS4001153 to the University of New Hampshire, Center for Coastal & Ocean Mapping. References Amery, G. B., 1969, Structure of Sigsbee scarp, Gulf of Mexico. American Association of Petroleum Geologists Bulletin, v. 53, p. 2480-2482. Bryant, W., Dellapenna, T., Silva, A., Dunlap, W., and Bean, D., 2000. Mega-furrows on the continental rise south of the Sigsbee Escarpment, northwest Gulf of Mexico. American Association of Petroleum Geologists, Annual meeting, New Orleans. Bryant, W., Bean, D., Slowey, N., Dellapenna, T, and Scott, E., 2001. Deepwater currents form mega-furrows near US Geulf’s Sigsbee Eecarpment. Offshore, July, p. 94-95.
- 10. Proceedings of the Canadian Hydrographic Conference and National Surveyors Conference 2008 Paper 2A-3 Page 10 Lead Author J. Gardner Ewing, T.E., 1991, Structural framework, in Salvador, A. (ed.), The Gulf of Mexico Basin, Boulder, Colorado, Geological Society of America, The Geology of North America, v. J, p. 31- 52. Gardner, J.V., Mayer, L.A., and Armstrong, A., 2005, New views of the U.S. continental margins, U.S. Hydro 2005 Conference, San Diego, CA, p. 1-13. Gardner, J.V., Mayer, L.A., and Armstrong, A., 2006, Mapping supports potential submission to U.N. Law of the Sea, Eos, Transactions, American Geophysical Union, v. 87, p. 157-160. George, R.A., Gee, L., Hill, A.W., Thomson, J.A., and Jeanjean, P., 2002, High-resolution AUV surveys of the eastern Sigsbee Escarpment. Offshore Technology Conference, Houston, TX, no. OTC 14139, p. 1-12. Howard, A.D., 1967, Drainage analysis in geologic interpretation: A summation. American Association of Petroleum Geologists Bulletin, v. 51, p. 2246-2259. Karig, D.E., 1972, Remnant Arcs, Geological Society of America Bulletin v. 83, p. 1057-1068. Lee, Y-D. E. and George, R.A., 2004. High-resolution geological AUV survey results across a portion of the eastern Sigsbee Escarpment, American Association of Petroleum Geologists Bulletin, v. 8, p. 747-764. Mayer, L.A., Jakobsson, M., and Armstrong, A., 2002, The compilation and analysis of data relevant to a U.S. claim under United Nations Law of the Sea Article 76: A Preliminary Report. http://www.jhc.unh.edu/unclos/html/reports.htm. Park, C., Tamaki, K., and Kobayashi, K., 1990, Age-depth correlation of the Philipine Sea back- arc basins and other marginal basins in the world. Tectonophysics, v. 181, p. 351-371. Stern, R.J., Fouch, M.J., and Klemperer, S.L., 2003, An overview of the Izu-Bonin-Mariana subduction factory, in Eiler, J. (ed.(), Inside the subduction factory, Geophysical Monograph 138, American Geophysical Union, p. 175-222. Twichell, D.C., Paull, C.K., and Parson, L.M., 1991. Terraces on the Florida escarpment: Implications for erosional proceses. Teology, v. 19, p. 897-900. Author Biographies Dr. James V. Gardner: Center for Coastal & Ocean Mapping-Joint Hydrographic Center and Research Professor, University of New Hampshire, 24 Colovos Road, Durham, NH 03824; email jim.gardner@unh.edu, phone 603-862-3473. Dr. Gardner is the project leader for data collection, processing and archiving the UNH-collected UNCLOS bathymetry and acoustic backscatter data. Dr. Larry A. Mayer, Co-Director of the Center for Coastal & Ocean Mapping-Joint Hydrographic Center and Professor; University of New Hampshire, 24 Colovos Road, Durham, NH 03824; email larry.mayer@unh.edu, phone 603-862-2615. Dr. Mayer is the UNH lead for the Center’s UNCLOS efforts and the chief scientist for the Arctic Ocean cruises. Capt. Andy Armstrong, Co-Director of the Center for Coastal & Ocean Mapping-Joint Hydrographic Center; University of New Hampshire, 24 Colovos Road, Durham, NH 03824;
- 11. Proceedings of the Canadian Hydrographic Conference and National Surveyors Conference 2008 Paper 2A-3 Page 11 Lead Author J. Gardner email andy.armstrong@noaa.gov, phone 603-862-4559. Capt. Armstrong is the NOAA Program Manager for the Center’s UNCLOS efforts and the co-chief scientist for the Arctic Ocean cruises.