SlideShare una empresa de Scribd logo
1 de 7
AP/H Statistics Guided Notes
Mrs. LeBlanc – Perrone                                                       Name: ______________________________

9.3 Inferences for Correlation and Regression                                Date: ___________
       Part 1: Testing     and the Standard Error of Estimate

Inferences for Correlation and Regression
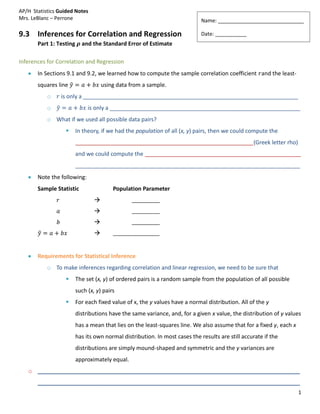
       In Sections 9.1 and 9.2, we learned how to compute the sample correlation coefficient and the least-
       squares line                  using data from a sample.
           o     is only a _____________________________________________________________________
           o                  is only a _____________________________________________________________
           o What if we used all possible data pairs?
                        In theory, if we had the population of all (x, y) pairs, then we could compute the
                         _________________________________________________________(Greek letter rho)
                         and we could compute the __________________________________________________
                         ________________________________________________________________________
       Note the following:
       Sample Statistic                  Population Parameter
                                 
                                 
                                 
                                 


       Requirements for Statistical Inference
           o To make inferences regarding correlation and linear regression, we need to be sure that
                        The set (x, y) of ordered pairs is a random sample from the population of all possible
                         such (x, y) pairs
                        For each fixed value of x, the y values have a normal distribution. All of the y
                         distributions have the same variance, and, for a given x value, the distribution of y values
                         has a mean that lies on the least-squares line. We also assume that for a fixed y, each x
                         has its own normal distribution. In most cases the results are still accurate if the
                         distributions are simply mound-shaped and symmetric and the y variances are
                         approximately equal.
   o ____________________________________________________________________________________
       ____________________________________________________________________________________
                                                                                                                     1
AP/H Statistics Guided Notes
Mrs. LeBlanc – Perrone

Testing the Correlation Coefficient
       The first topic we want to study is the statistical significance of the sample correlation coefficient r.
       To do this, we construct a statistical test of , the population correlation coefficient.


How to Test the population correlation coefficient
       Let be the sample correlation coefficient computed using data pair (          )
            1. Use the null hypothesis                        (x and y have _______________________________).
                Use the context of the application to state the alternate hypothesis (                             ).
                State the level of significance .
            2. Obtain a sample of          data pairs and compute the sample test statistic
                               with degrees of freedom
            3. Use the TI-83 or TI-84 to calculate the _____________________
                     _______________________________________________________________________
            4. Conclude the test
                     If the P-values is      , then reject
                     If the P-values is      , then fail to reject
            5. Interpret the results in the context of your application


                                                                                                                   2
AP/H Statistics Guided Notes
Mrs. LeBlanc – Perrone

Example: Testing
Do college graduates have an improved chance at a better income? Is there a trend in the general population
to support the “learn more, earn more” statement? We suspect the population correlation is positive, let’s test
using a 1% level of significance. Consider the following variables: x = percentage of the population 25 or older
with at least four years of college and y = percentage growth in per capita income over the past seven years. A
random sample of six communities in Ohio gave the information shown


       Caution: Although we have shown that x and y are positively correlated, we have not shown that an
       increase in education causes an increase in earnings.

                                                                                                                   3
AP/H Statistics Guided Notes
Mrs. LeBlanc – Perrone

You Try It!
A medical research team is studying the effect of a new drug on red blood cells. Let x be a random variable
representing milligrams of the drug given to a patient. Let y be a random variable representing red blood cells
per cubic milliliter of whole blood. A random sample of        volunteer patients gave the following results.

x   9.2       10.1   9.0   12.5   8.8   9.1    9.5

y   5.0       4.8    4.5   5.7    5.1   4.6    4.2


Use a 1% level of significance to test the claim that


                                                                                                                  4
AP/H Statistics Guided Notes
Mrs. LeBlanc – Perrone

Standard Error of Estimate
       Sometimes a scatter diagram clearly ______________________________________________________
       between x and y, but it can happen that the points are widely scattered about the least-squares line.
       We need a method (besides just looking) for measuring the spread of a set of points about the least-
       squares line. There are three common methods of measuring the spread.
           o the coefficient of correlation
           o the coefficient of determination
           o ______________________________________________________
    For the standard error of estimate, we use a measure of spread that is in some ways like the
       standard deviation of measurements of a single variable. Let_________________________________
       ________________________________________________from the least-squares line.
    Then y – is the difference between the y value of the data point (x, y) shown on the scatter diagram

       (Figure 9-16) and the       value of the point on the least-squares line with the same x value.


    The quantity __________ is known as the ___________________. To avoid the difficulty of having
       some positive and some negative values, we square the quantity (y – ).
    Then we sum the squares and, for technical reasons, divide this sum by n – 2. Finally, we take the
       square root to obtain the standard error of estimate, denoted by S .
                                                                             e


    Standard Error of Estimate = ______________________________________________
       where                 and


         Using the TI 83 & TI 84
            1. STAT
            2. TEST
            3. LinRegTTest
                      The value for       is given as
                                                                                                               5
AP/H Statistics Guided Notes
Mrs. LeBlanc – Perrone

Example
June and Jim are partners in the chemistry lab. Their assignment is to determine how much copper sulfate
(CuSO ) will dissolve in water at 10, 20, 30, 40, 50, 60, and 70°C.Their lab results are shown in Table 9-12,
      4

where y is the weight in grams of copper sulfatethat will dissolve in 100 grams of water at x°C. Sketch a scatter
diagram, find the equation of the least-squares line, and compute


                                                                                                                6
AP/H Statistics Guided Notes
Mrs. LeBlanc – Perrone

Summary Questions


   1. What does testing the population correlation coefficient show?
      ____________________________________________________________________________________
      ____________________________________________________________________________________
      ____________________________________________________________________________________
      ____________________________________________________________________________________


   2. Complete 9.1 – 9.3 Graphing Calculator Exercises (including the “You Try It”)


“HOT” Question:
__________________________________________________________________________________________
__________________________________________________________________________________________


                                                                                         7

Más contenido relacionado

La actualidad más candente

Chi square and t tests, Neelam zafar & group
Chi square and t tests, Neelam zafar & groupChi square and t tests, Neelam zafar & group
Chi square and t tests, Neelam zafar & groupNeelam Zafar
 
Principal components
Principal componentsPrincipal components
Principal componentsHutami Endang
 
binomial distribution
binomial distributionbinomial distribution
binomial distributionZarish Qaiser
 
Chi Square
Chi SquareChi Square
Chi SquareJolie Yu
 
Elementary statistics for Food Indusrty
Elementary statistics for Food IndusrtyElementary statistics for Food Indusrty
Elementary statistics for Food IndusrtyAtcharaporn Khoomtong
 
International Journal of Computational Engineering Research(IJCER)
International Journal of Computational Engineering Research(IJCER)International Journal of Computational Engineering Research(IJCER)
International Journal of Computational Engineering Research(IJCER)ijceronline
 
Z and t_tests
Z and t_testsZ and t_tests
Z and t_testseducation
 
Spss cross tab n chi sq bivariate analysis
Spss  cross tab n chi sq bivariate analysisSpss  cross tab n chi sq bivariate analysis
Spss cross tab n chi sq bivariate analysisRaja Azrul Raja Ahmad
 
Chi squared test
Chi squared testChi squared test
Chi squared testvikas232190
 
Binary OR Binomial logistic regression
Binary OR Binomial logistic regression Binary OR Binomial logistic regression
Binary OR Binomial logistic regression Dr Athar Khan
 
Heteroscedasticity
HeteroscedasticityHeteroscedasticity
HeteroscedasticityMuhammad Ali
 
Categorical data analysis
Categorical data analysisCategorical data analysis
Categorical data analysisSumit Das
 

La actualidad más candente (19)

3rd Grade Glossary
3rd Grade Glossary3rd Grade Glossary
3rd Grade Glossary
 
Chi square and t tests, Neelam zafar & group
Chi square and t tests, Neelam zafar & groupChi square and t tests, Neelam zafar & group
Chi square and t tests, Neelam zafar & group
 
Principal components
Principal componentsPrincipal components
Principal components
 
binomial distribution
binomial distributionbinomial distribution
binomial distribution
 
Chi Square
Chi SquareChi Square
Chi Square
 
Elementary statistics for Food Indusrty
Elementary statistics for Food IndusrtyElementary statistics for Food Indusrty
Elementary statistics for Food Indusrty
 
Chapter12
Chapter12Chapter12
Chapter12
 
International Journal of Computational Engineering Research(IJCER)
International Journal of Computational Engineering Research(IJCER)International Journal of Computational Engineering Research(IJCER)
International Journal of Computational Engineering Research(IJCER)
 
Z and t_tests
Z and t_testsZ and t_tests
Z and t_tests
 
Spss cross tab n chi sq bivariate analysis
Spss  cross tab n chi sq bivariate analysisSpss  cross tab n chi sq bivariate analysis
Spss cross tab n chi sq bivariate analysis
 
Chi square test
Chi square testChi square test
Chi square test
 
Chi square test
Chi square testChi square test
Chi square test
 
Chi squared test
Chi squared testChi squared test
Chi squared test
 
7 qc tools
7 qc tools7 qc tools
7 qc tools
 
Binary OR Binomial logistic regression
Binary OR Binomial logistic regression Binary OR Binomial logistic regression
Binary OR Binomial logistic regression
 
Heteroscedasticity
HeteroscedasticityHeteroscedasticity
Heteroscedasticity
 
Chi Squared Test
Chi Squared TestChi Squared Test
Chi Squared Test
 
Categorical data analysis
Categorical data analysisCategorical data analysis
Categorical data analysis
 
Correlation
CorrelationCorrelation
Correlation
 

Destacado

Ch 7 final review key
Ch 7 final review keyCh 7 final review key
Ch 7 final review keyleblance
 
5.4 5.9 test review answers
5.4   5.9 test review answers5.4   5.9 test review answers
5.4 5.9 test review answersleblance
 
Alg 2 midterm review key
Alg 2 midterm review keyAlg 2 midterm review key
Alg 2 midterm review keyleblance
 
5.5 ws answers
5.5 ws answers5.5 ws answers
5.5 ws answersleblance
 
Ch 9 practice exam
Ch 9 practice examCh 9 practice exam
Ch 9 practice examleblance
 
Ch 8 test review key
Ch 8 test review keyCh 8 test review key
Ch 8 test review keyleblance
 
Ch 5 test review answers
Ch 5 test review answersCh 5 test review answers
Ch 5 test review answersleblance
 
Parent night contact&survey
Parent night contact&surveyParent night contact&survey
Parent night contact&surveyleblance
 
2.1 Part 1 - Frequency Distributions
2.1 Part 1 - Frequency Distributions2.1 Part 1 - Frequency Distributions
2.1 Part 1 - Frequency Distributionsleblance
 
Chapter 4 Extra Practice Answers
Chapter 4 Extra Practice AnswersChapter 4 Extra Practice Answers
Chapter 4 Extra Practice Answersleblance
 
Scatter plots
Scatter plotsScatter plots
Scatter plotsMs. Jones
 

Destacado (14)

Ch 7 final review key
Ch 7 final review keyCh 7 final review key
Ch 7 final review key
 
5.4 5.9 test review answers
5.4   5.9 test review answers5.4   5.9 test review answers
5.4 5.9 test review answers
 
Alg 2 midterm review key
Alg 2 midterm review keyAlg 2 midterm review key
Alg 2 midterm review key
 
5.5 ws answers
5.5 ws answers5.5 ws answers
5.5 ws answers
 
Ch 9 practice exam
Ch 9 practice examCh 9 practice exam
Ch 9 practice exam
 
Ch 8 test review key
Ch 8 test review keyCh 8 test review key
Ch 8 test review key
 
Ch 5 test review answers
Ch 5 test review answersCh 5 test review answers
Ch 5 test review answers
 
Parent night contact&survey
Parent night contact&surveyParent night contact&survey
Parent night contact&survey
 
5.2
5.25.2
5.2
 
2.1 Part 1 - Frequency Distributions
2.1 Part 1 - Frequency Distributions2.1 Part 1 - Frequency Distributions
2.1 Part 1 - Frequency Distributions
 
Chapter 4 Extra Practice Answers
Chapter 4 Extra Practice AnswersChapter 4 Extra Practice Answers
Chapter 4 Extra Practice Answers
 
9.1
9.19.1
9.1
 
Scatter plots
Scatter plotsScatter plots
Scatter plots
 
Scatter diagram in tqm
Scatter diagram in tqmScatter diagram in tqm
Scatter diagram in tqm
 

Similar a 9.1 9.2 9.3 using the graph calc

8.4 guided notes
8.4 guided notes8.4 guided notes
8.4 guided notesleblance
 
8.3 p value
8.3 p value8.3 p value
8.3 p valueleblance
 
8.3 critical region
8.3 critical region8.3 critical region
8.3 critical regionleblance
 
8.1 guided notes
8.1 guided notes8.1 guided notes
8.1 guided notesleblance
 
8.2 p value guided notes
8.2 p value guided notes8.2 p value guided notes
8.2 p value guided notesleblance
 
marketing research & applications on SPSS
marketing research & applications on SPSSmarketing research & applications on SPSS
marketing research & applications on SPSSANSHU TIWARI
 
Histograms and Descriptive Statistics Scoring GuideCRITERIANON.docx
Histograms and Descriptive Statistics Scoring GuideCRITERIANON.docxHistograms and Descriptive Statistics Scoring GuideCRITERIANON.docx
Histograms and Descriptive Statistics Scoring GuideCRITERIANON.docxpooleavelina
 
Qnt 275 Enhance teaching / snaptutorial.com
Qnt 275 Enhance teaching / snaptutorial.comQnt 275 Enhance teaching / snaptutorial.com
Qnt 275 Enhance teaching / snaptutorial.comBaileya33
 
QNT 275 Inspiring Innovation / tutorialrank.com
QNT 275 Inspiring Innovation / tutorialrank.comQNT 275 Inspiring Innovation / tutorialrank.com
QNT 275 Inspiring Innovation / tutorialrank.comBromleyz33
 
QNT 275 Exceptional Education - snaptutorial.com
QNT 275   Exceptional Education - snaptutorial.comQNT 275   Exceptional Education - snaptutorial.com
QNT 275 Exceptional Education - snaptutorial.comDavisMurphyB22
 
Module-2_Notes-with-Example for data science
Module-2_Notes-with-Example for data scienceModule-2_Notes-with-Example for data science
Module-2_Notes-with-Example for data sciencepujashri1975
 
Statistics and Probability Q4_M1_LAS .docx
Statistics and Probability Q4_M1_LAS .docxStatistics and Probability Q4_M1_LAS .docx
Statistics and Probability Q4_M1_LAS .docxNelia Sumalinog
 

Similar a 9.1 9.2 9.3 using the graph calc (20)

8.4 guided notes
8.4 guided notes8.4 guided notes
8.4 guided notes
 
8.3 p value
8.3 p value8.3 p value
8.3 p value
 
8.3 critical region
8.3 critical region8.3 critical region
8.3 critical region
 
8.1 guided notes
8.1 guided notes8.1 guided notes
8.1 guided notes
 
8.2 p value guided notes
8.2 p value guided notes8.2 p value guided notes
8.2 p value guided notes
 
Multiple linear regression
Multiple linear regressionMultiple linear regression
Multiple linear regression
 
Chapter 3
Chapter 3Chapter 3
Chapter 3
 
Chapter 3
Chapter 3Chapter 3
Chapter 3
 
marketing research & applications on SPSS
marketing research & applications on SPSSmarketing research & applications on SPSS
marketing research & applications on SPSS
 
Histograms and Descriptive Statistics Scoring GuideCRITERIANON.docx
Histograms and Descriptive Statistics Scoring GuideCRITERIANON.docxHistograms and Descriptive Statistics Scoring GuideCRITERIANON.docx
Histograms and Descriptive Statistics Scoring GuideCRITERIANON.docx
 
Qnt 275 Enhance teaching / snaptutorial.com
Qnt 275 Enhance teaching / snaptutorial.comQnt 275 Enhance teaching / snaptutorial.com
Qnt 275 Enhance teaching / snaptutorial.com
 
QNT 275 Inspiring Innovation / tutorialrank.com
QNT 275 Inspiring Innovation / tutorialrank.comQNT 275 Inspiring Innovation / tutorialrank.com
QNT 275 Inspiring Innovation / tutorialrank.com
 
QNT 275 Exceptional Education - snaptutorial.com
QNT 275   Exceptional Education - snaptutorial.comQNT 275   Exceptional Education - snaptutorial.com
QNT 275 Exceptional Education - snaptutorial.com
 
Chapter 10
Chapter 10Chapter 10
Chapter 10
 
Chapter 10
Chapter 10Chapter 10
Chapter 10
 
Qnt275 qnt 275
Qnt275 qnt 275Qnt275 qnt 275
Qnt275 qnt 275
 
Module-2_Notes-with-Example for data science
Module-2_Notes-with-Example for data scienceModule-2_Notes-with-Example for data science
Module-2_Notes-with-Example for data science
 
Chapter 5
Chapter 5Chapter 5
Chapter 5
 
Chapter 5
Chapter 5Chapter 5
Chapter 5
 
Statistics and Probability Q4_M1_LAS .docx
Statistics and Probability Q4_M1_LAS .docxStatistics and Probability Q4_M1_LAS .docx
Statistics and Probability Q4_M1_LAS .docx
 

Más de leblance

Más de leblance (20)

7.3 daqy 2
7.3 daqy 27.3 daqy 2
7.3 daqy 2
 
7.3
7.37.3
7.3
 
7.1
7.17.1
7.1
 
7.2
7.27.2
7.2
 
10.3 part 1
10.3 part 110.3 part 1
10.3 part 1
 
10.2
10.210.2
10.2
 
10.1 part2
10.1 part210.1 part2
10.1 part2
 
10.1 part 1
10.1 part 110.1 part 1
10.1 part 1
 
5.4 synthetic division
5.4 synthetic division5.4 synthetic division
5.4 synthetic division
 
5.4 long division
5.4 long division5.4 long division
5.4 long division
 
5.3
5.35.3
5.3
 
9.3 Part 1
9.3 Part 19.3 Part 1
9.3 Part 1
 
5.1 part 2
5.1 part 25.1 part 2
5.1 part 2
 
5.1[1]
5.1[1]5.1[1]
5.1[1]
 
9.2 lin reg coeff of det
9.2 lin reg coeff of det9.2 lin reg coeff of det
9.2 lin reg coeff of det
 
Ch 8 review answers
Ch 8 review answersCh 8 review answers
Ch 8 review answers
 
8.4
8.48.4
8.4
 
8.3 critical region
8.3 critical region8.3 critical region
8.3 critical region
 
8.3
8.38.3
8.3
 
8.2
8.28.2
8.2
 

9.1 9.2 9.3 using the graph calc

  • 1. AP/H Statistics Guided Notes Mrs. LeBlanc – Perrone Name: ______________________________ 9.3 Inferences for Correlation and Regression Date: ___________ Part 1: Testing and the Standard Error of Estimate Inferences for Correlation and Regression In Sections 9.1 and 9.2, we learned how to compute the sample correlation coefficient and the least- squares line using data from a sample. o is only a _____________________________________________________________________ o is only a _____________________________________________________________ o What if we used all possible data pairs?  In theory, if we had the population of all (x, y) pairs, then we could compute the _________________________________________________________(Greek letter rho) and we could compute the __________________________________________________ ________________________________________________________________________ Note the following: Sample Statistic Population Parameter     Requirements for Statistical Inference o To make inferences regarding correlation and linear regression, we need to be sure that  The set (x, y) of ordered pairs is a random sample from the population of all possible such (x, y) pairs  For each fixed value of x, the y values have a normal distribution. All of the y distributions have the same variance, and, for a given x value, the distribution of y values has a mean that lies on the least-squares line. We also assume that for a fixed y, each x has its own normal distribution. In most cases the results are still accurate if the distributions are simply mound-shaped and symmetric and the y variances are approximately equal. o ____________________________________________________________________________________ ____________________________________________________________________________________ 1
  • 2. AP/H Statistics Guided Notes Mrs. LeBlanc – Perrone Testing the Correlation Coefficient The first topic we want to study is the statistical significance of the sample correlation coefficient r. To do this, we construct a statistical test of , the population correlation coefficient. How to Test the population correlation coefficient Let be the sample correlation coefficient computed using data pair ( ) 1. Use the null hypothesis (x and y have _______________________________). Use the context of the application to state the alternate hypothesis ( ). State the level of significance . 2. Obtain a sample of data pairs and compute the sample test statistic with degrees of freedom 3. Use the TI-83 or TI-84 to calculate the _____________________  _______________________________________________________________________ 4. Conclude the test  If the P-values is , then reject  If the P-values is , then fail to reject 5. Interpret the results in the context of your application 2
  • 3. AP/H Statistics Guided Notes Mrs. LeBlanc – Perrone Example: Testing Do college graduates have an improved chance at a better income? Is there a trend in the general population to support the “learn more, earn more” statement? We suspect the population correlation is positive, let’s test using a 1% level of significance. Consider the following variables: x = percentage of the population 25 or older with at least four years of college and y = percentage growth in per capita income over the past seven years. A random sample of six communities in Ohio gave the information shown Caution: Although we have shown that x and y are positively correlated, we have not shown that an increase in education causes an increase in earnings. 3
  • 4. AP/H Statistics Guided Notes Mrs. LeBlanc – Perrone You Try It! A medical research team is studying the effect of a new drug on red blood cells. Let x be a random variable representing milligrams of the drug given to a patient. Let y be a random variable representing red blood cells per cubic milliliter of whole blood. A random sample of volunteer patients gave the following results. x 9.2 10.1 9.0 12.5 8.8 9.1 9.5 y 5.0 4.8 4.5 5.7 5.1 4.6 4.2 Use a 1% level of significance to test the claim that 4
  • 5. AP/H Statistics Guided Notes Mrs. LeBlanc – Perrone Standard Error of Estimate Sometimes a scatter diagram clearly ______________________________________________________ between x and y, but it can happen that the points are widely scattered about the least-squares line. We need a method (besides just looking) for measuring the spread of a set of points about the least- squares line. There are three common methods of measuring the spread. o the coefficient of correlation o the coefficient of determination o ______________________________________________________  For the standard error of estimate, we use a measure of spread that is in some ways like the standard deviation of measurements of a single variable. Let_________________________________ ________________________________________________from the least-squares line.  Then y – is the difference between the y value of the data point (x, y) shown on the scatter diagram (Figure 9-16) and the value of the point on the least-squares line with the same x value.  The quantity __________ is known as the ___________________. To avoid the difficulty of having some positive and some negative values, we square the quantity (y – ).  Then we sum the squares and, for technical reasons, divide this sum by n – 2. Finally, we take the square root to obtain the standard error of estimate, denoted by S . e  Standard Error of Estimate = ______________________________________________ where and  Using the TI 83 & TI 84 1. STAT 2. TEST 3. LinRegTTest The value for is given as 5
  • 6. AP/H Statistics Guided Notes Mrs. LeBlanc – Perrone Example June and Jim are partners in the chemistry lab. Their assignment is to determine how much copper sulfate (CuSO ) will dissolve in water at 10, 20, 30, 40, 50, 60, and 70°C.Their lab results are shown in Table 9-12, 4 where y is the weight in grams of copper sulfatethat will dissolve in 100 grams of water at x°C. Sketch a scatter diagram, find the equation of the least-squares line, and compute 6
  • 7. AP/H Statistics Guided Notes Mrs. LeBlanc – Perrone Summary Questions 1. What does testing the population correlation coefficient show? ____________________________________________________________________________________ ____________________________________________________________________________________ ____________________________________________________________________________________ ____________________________________________________________________________________ 2. Complete 9.1 – 9.3 Graphing Calculator Exercises (including the “You Try It”) “HOT” Question: __________________________________________________________________________________________ __________________________________________________________________________________________ 7