Timeliness of Malaria Treatment in Children Under Five Years of Age in sub-Saharan Africa: A Multicountry Analysis of National-scale Household Survey Data
•
0 recomendaciones•600 vistas

Presented at the November 2013 ASTMH Conference.
Recomendados

Recomendados
Más contenido relacionado
La actualidad más candente
La actualidad más candente (20)
Destacado
Destacado (9)
Similar a Timeliness of Malaria Treatment in Children Under Five Years of Age in sub-Saharan Africa: A Multicountry Analysis of National-scale Household Survey Data
Similar a Timeliness of Malaria Treatment in Children Under Five Years of Age in sub-Saharan Africa: A Multicountry Analysis of National-scale Household Survey Data (20)
Más de MEASURE Evaluation
Más de MEASURE Evaluation (20)
Último
Último (20)
Timeliness of Malaria Treatment in Children Under Five Years of Age in sub-Saharan Africa: A Multicountry Analysis of National-scale Household Survey Data
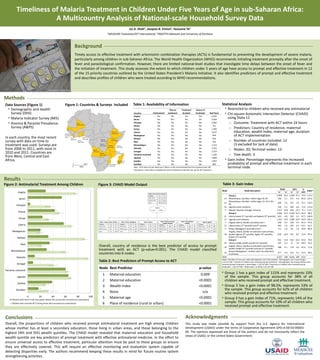
- 1. Background Timeliness of Malaria Treatment in Children Under Five Years of Age in sub-Saharan Africa: A Multicountry Analysis of National-scale Household Survey Data Methods Timely access to effective treatment with artemisinin combination therapies (ACTs) is fundamental to preventing the development of severe malaria, particularly among children in sub-Saharan Africa. The World Health Organization (WHO) recommends initiating treatment promptly after the onset of fever and parasitological confirmation. However, there are limited national-level studies that investigate time delays between the onset of fever and the initiation of treatment. This study assesses the extent to which children under 5 years of age have access to prompt and effective treatment in 12 of the 15 priority countries outlined by the United States President’s Malaria Initiative. It also identifies predictors of prompt and effective treatment and describes profiles of children who were treated according to WHO recommendations. Results Data Sources (Figure 1) • Demographic and Health Survey (DHS) • Malaria Indicator Survey (MIS) • Anemia & Parasite Prevalence Survey (A&PS) In each country, the most recent survey with data on time to treatment was used. Surveys are from 2006 to 2011, with most in 2010 and 2011. Countries are from West, Central and East Africa. Conclusions Overall, the proportions of children who received prompt antimalarial treatment are high among children whose mother has at least a secondary education, those living in urban areas, and those belonging to the highest (4th and 5th) wealth quintiles. The CHAID model revealed that maternal education and household wealth quintile are key predictors of prompt treatment with effective antimalarial medicine. In the effort to ensure universal access to effective treatment, particular attention must be paid to these groups to ensure they are effectively covered. This will require an effective monitoring and evaluation system capable of detecting disparities early. The authors recommend keeping these results in mind for future routine system strengthening activities. Acknowledgments This study was made possible by support from the U.S. Agency for International Development (USAID) under the terms of Cooperative Agreement GPO-A-00-03-00003- 00. The opinions expressed are those of the authors and do not necessarily reflect the views of USAID, or the United States Government. Overall, country of residence is the best predictor of access to prompt treatment with an ACT (p-value<0.001). The CHAID model classified countries into 6 nodes. Table 2: Best Predictors of Prompt Access to ACT • Group 1 has a gain index of 115% and represents 33% of the sample. This group accounts for 38% of all children who received prompt and effective treatment. • Group 2 has a gain index of 98.5%, represents 53% of the sample. This group accounts for 62% of all children who received prompt and effective treatment. • Group 3 has a gain index of 71%, represents 14% of the sample. This group accounts for 10% of all children who received prompt and effective treatment. Figure 3: CHAID Model Output Table 3: Gain Index Jui A. Shah1, Jacques B. Emina2, Yazoume Ye1 1MEASURE Evaluation/ICF International, 2INDEPTH-Network and University of Kinshasa Node Node description Node Gain % 24h5 Index6 N1 %2 N3 %4 Group 1 2,059 32.5 1,504 37.5 73.0 115.3 14 Mozambique, Zanzibar, mother ages 20–29 199 3.1 171 4.3 85.9 135.6 15 Mozambique, Zanzibar, mother ages 15–19 or 30– 49 209 3.3 157 3.9 75.1 118.5 16 Uganda urban residents 334 5.3 240 6.0 71.9 113.4 4 Malawi, Rwanda, Senegal, Tanzania 1,317 20.8 936 23.3 71.1 112.1 Group 2 3,366 53.1 2,102 52.3 62.4 98.5 11 Liberia lowest (1st quintile) and highest (5th quintile) 303 4.8 205 5.1 67.7 106.8 17 Uganda rural residents 1,515 23.9 1,000 24.9 66.0 104.2 7 Angola, Ghana, Zambia secondary and + 358 5.6 220 5.5 61.5 97.0 13 Liberia lower (2nd quintile) and 4th quintile 445 7.0 263 6.5 59.1 93.3 9 Kenya, Madagascar secondary and + 111 1.8 63 1.6 56.8 89.6 18 Angola, Ghana, Zambia no education and primary; wealth highest (5th quintile), higher (4th quintile), lowest (1st) quintile 634 10.0 351 8.7 55.4 87.4 Group 3 912 14.4 410 10.2 45.0 70.9 12 Liberia middle wealth quintile (3rd quintile) 147 2.3 71 1.8 48.3 76.2 19 Angola, Ghana, Zambia no education and primary; wealth middle (3rd quintile) and low (2nd quintile) 388 6.1 176 4.4 45.4 71.6 10 Kenya/ Madagascar– mothers with non education or primary 377 5.9 163 4.1 43.2 68.2 Total 6,337 100 4,016 100 63.4 - Notes:1 Number of cases per node (demographic size in the sample); 2 Demographic size in percentage = (.1/Σ.1)*100; 3 Number of children who received prompt treatment; 4 Demographic size among children who received prompt treatment in percentage = (.3/Σ.3)*100;5 Proportion of children who received prompt treatment = (.3/Σ.1)*100; 6 Node Index = ((.3/Σ3)/ (.1/Σ.1))*100. Statistical Analysis • Restricted to children who received any antimalarial • Chi-square Automatic Interaction Detector (CHAID) using Stata 12 o Outcome: Treatment with ACT within 24 hours o Predictors: Country of residence, maternal education, wealth index, maternal age, duration of ACT implementation o Number of countries included: 12 (3 excluded for lack of data) o Nodes: 20; Terminal nodes: 13 o Tree depth: 3 • Gain Index: Percentage represents the increased probability of prompt and effective treatment in each terminal node. Table 1: Availability of Information Figure 2: Antimalarial Treatment Among Children Figure 1: Countries & Surveys Included Node Best Predictor p-value 1 Maternal education 0.009 2 Maternal education <0.0001 3 Wealth index <0.0001 4 None n/a 5 Maternal age <0.0001 6 Place of residence (rural or urban) <0.0001 Photo credit: Fadhili Akida 0 20 40 60 80 100 Angola Benin Ethiopia Ghana Kenya Liberia Madagascar Malawi Mali Mozambique Rwanda Senegal Tanzania mainland Uganda Zambia Zanzibar Children with fever in the two weeks before the survey who received any antimalarial Children who received ACT among those who received any antimalarial Country Antimalarial Time to treatment Treatment duration Source of treatment Had Fever Angola Yes Yes Yes Yes 2,645 Benin* Yes Yes* Yes Yes 4,204 Ethiopia Yes No No Yes 2,082 Ghana Yes Yes Yes Yes 751 Kenya Yes Yes Yes Yes 1,385 Liberia Yes Yes No Yes 1,617 Madagascar Yes Yes Yes Yes 959 Malawi Yes Yes Yes Yes 676 Mali Yes No No Yes 705 Mozambique Yes Yes Yes Yes 1,313 Rwanda Yes Yes No Yes 1,332 Senegal Yes Yes No Yes 2,314 Tanzania mainland Yes Yes No Yes 1,320 Uganda Yes Yes No Yes 2,860 Zambia Yes Yes Yes Yes 1,034 Zanzibar Yes Yes No Yes 282 Note: *ACTs were not yet rolled out in Benin, so the recommended first-line treatment was still chloroquine. Information is available for other antimalarial treatment but not for ACT treatment. Node 1: Angola, Ghana, Zambia Category % N After 24 hrs 45.9 633 Within 24 hrs 54.1 747 Total 16.3 1,380 Node 2: Kenya, Madagascar Category % N After 24 hrs 53.7 262 Within 24 hrs 46.3 226 Total 5.7 488 Node 3: Liberia Category % N After 24 hrs 39.8 356 Within 24 hrs 60.2 539 Total 10.5 895 Node 4: Malawi, Rwanda, Senegal, Tanzania Category % N After 24 hrs 28.9 381 Within 24 hrs 71.1 936 Total 20.8 1,317 Node 5: Mozambique, Zanzibar Category % N After 24 hrs 19.6 80 Within 24 hrs 80.4 328 Total 6.4 408 Node 6: Uganda Category % N After 24 hrs 32.9 609 Within 24 hrs 67.1 1,240 Total 29.2 1,849 Node 0: Time to ACT treatment Category % N After 24 hrs 36.6 2,321 Within 24 hrs 63.4 4,016 Total 100.0 6,337 Country P-value <0.0001