
Recomendados
Más contenido relacionado
La actualidad más candente
La actualidad más candente (17)
Similar a 04596361
Similar a 04596361 (20)
Último
Último (20)
04596361
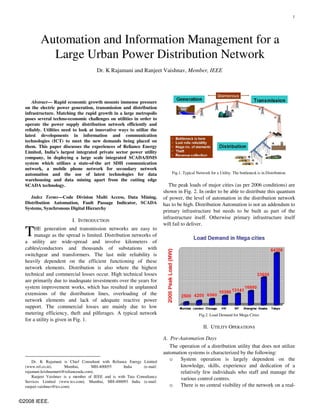
- 1. 1 Automation and Information Management for a Large Urban Power Distribution Network Dr. K Rajamani and Ranjeet Vaishnav, Member, IEEE Abstract— Rapid economic growth mounts immense pressure on the electric power generation, transmission and distribution infrastructure. Matching the rapid growth in a large metropolis poses several techno-economic challenges on utilities in order to operate the power supply distribution network efficiently and reliably. Utilities need to look at innovative ways to utilize the latest developments in information and communication technologies (ICT) to meet the new demands being placed on them. This paper discusses the experiences of Reliance Energy Limited, India’s largest integrated private sector power utility company, in deploying a large scale integrated SCADA/DMS system which utilizes a state-of-the art SDH communication network, a mobile phone network for secondary network automation and the use of latest technologies for data Fig.1. Typical Network for a Utility. The bottleneck is in Distribution. warehousing and data mining apart from the cutting edge SCADA technology. The peak loads of major cities (as per 2006 conditions) are shown in Fig. 2. In order to be able to distribute this quantum Index Terms—Code Division Multi Access, Data Mining, of power, the level of automation in the distribution network Distribution Automation, Fault Passage Indicator, SCADA has to be high. Distribution Automation is not an addendum to Systems, Synchronous Digital Hierarchy primary infrastructure but needs to be built as part of the infrastructure itself. Otherwise primary infrastructure itself I. INTRODUCTION will fail to deliver. T HE generation and transmission networks are easy to manage as the spread is limited. Distribution networks of a utility are wide-spread and involve kilometers of cables/conductors and thousands of substations with switchgear and transformers. The last mile reliability is heavily dependent on the efficient functioning of these network elements. Distribution is also where the highest technical and commercial losses occur. High technical losses are primarily due to inadequate investments over the years for system improvement works, which has resulted in unplanned extensions of the distribution lines, overloading of the network elements and lack of adequate reactive power support. The commercial losses are mainly due to low metering efficiency, theft and pilferages. A typical network Fig.2. Load Demand for Mega Cities for a utility is given in Fig. 1. II. UTILITY OPERATIONS A. Pre-Automation Days The operation of a distribution utility that does not utilize automation systems is characterized by the following: Dr. K Rajamani is Chief Consultant with Reliance Energy Limited o System operation is largely dependent on the (www.rel.co.in), Mumbai, MH-400055 India (e-mail: knowledge, skills, experience and dedication of a rajamani.krishnamurti@relianceada.com). relatively few individuals who staff and manage the Ranjeet Vaishnav is a member of IEEE and is with Tata Consultancy various control centres. Services Limited (www.tcs.com), Mumbai, MH-400093 India (e-mail: ranjeet.vaishnav@tcs.com). o There is no central visibility of the network on a real- ©2008 IEEE.
- 2. 2 time basis and snapshots of network operations are real-time control room system employing modern concepts of not possible. Network operators use schematic operating system maintenance, system status monitoring and operating diagrams produced in a variety of forms decision tools for efficient management of control room targeted at the different levels of the control hierarchy processes. The transition from manual operations to (zone, district circle levels). automated operations follows a stepwise procedure. o Knowledge about the state of the network at any given time is limited. o Logs and asset records are many and are manually written and maintained at most control levels. Updating of the asset records to the present network status is manual and not an inherent feature of the process which leads to inconsistency of data between various locations. Moreover, the records become too fragmented and complex for a human mind to comprehend and make efficient conclusions out of it. o Customer Information System is largely unreliable Fig.3. Transition from manual operations to automated operations. due to paucity of information on the fault repair times and knowledge of crew activities leading to low III. INTEGRATED DISTRIBUTION AUTOMATION FOR confidence levels of consumers. INFORMATION MANAGEMENT B. Present Operating Environment A. Design Considerations for Integrated Distribution The present operations of utilities are hugely influenced by Automation the ongoing restructuring of the power sector and regulatory pressures. The following key drivers are seen as influencing Distribution Automation is an umbrella concept that the utility operations: embraces all the real-time and operational functions for the o Greater emphasis on improving efficiency of distribution network. Within this umbrella, SCADA and operations Distribution Management applications (DMS) form the heart o Meeting regulatory requirements of the system which is then interfaced with other business o Striving to become customer centric processes to create a truly integrated utility. A typical o Timely revenue realization and reducing commercial integrated distribution automation system with following losses elements is shown in Fig.4: o Energy trading and sourcing of power from varied o Supervisory Control & Data Acquisition Systems sources to minimize cost of purchase and optimize (SCADA) operations. o Distribution Management System (DMS) o Geographical Information System (GIS) C. Need for Automation o Automatic Meter Reading System (AMR) The above factors influence a utility to automate operations. o Outage Management System (OMS) The utilities go in for automation to: o Communication Systems o Improve reliability and quality at optimum cost. o Billing and Business Process Automation o Improve their Customer Relationship Management o Enterprise Resource Planning (ERP) Systems (CRM). o Have better knowledge of network leading to optimum operations. o Be able to carry out load shedding intelligently instead of doing it in an ad-hoc manner. o Timely update data on actual system state/performance available to all decision makers (management, planners and operators). o Coordinate documentation and information on network assets. o Streamline business and operating processes. o Reduce losses - technical and commercial Fig.4. Integrated Automation System D. Transition Distribution utilities need to move from a distributed, The key design parameters for an integrated automation manual intensive, paper based process relying on a few long system are: experienced, very senior staff to a central computer based o User interface response time
- 3. 3 o Communication media (SCADA) and Distribution Management System (DMS) was o Type, frequency and quantity of data flow one such step. o Data flows between different elements of the A. SCADA/DMS Subsystems and Field Implementation SCADA/DMS network o RTU to Control Center communication In the first step, SCADA system was commissioned which o Hardware sizing (SCADA/DMS servers, RTU) integrated the monitoring and control of generation, o Scalability for future expansion transmission and distribution network. Today full monitoring o Data flows between SCADA/DMS and other IT and control is exercised up to the receiving stations, situated systems all over the REL distribution area. Intelligent Electronic The industry recommended best practices for distribution Devices (IEDs) such as numerical relays, digital tap-changers, system automation are: and energy meters of several makes have been successfully o All primary substations to be unmanned with central integrated for better post mortem analysis after an abnormal decision making processes occurrence. Visibility of all the network elements, like o Decision making based on real-time accurate and generation transmission and distribution at one place has consistent information greatly improved response and decision making during a o Remote control of all key field equipment devices contingency. Islanding scheme after grid failure and automatic o Selected distribution substations (11kV/415V) control load shedding scheme post islanding is implemented in the o Monitoring of all data required to support new SCADA system. contingency In the next step, REL implemented secondary SCADA o Monitoring of power system equipment with a set of network analysis applications which is termed o Remote monitoring of protective relay performance Distribution Management System (DMS). It involves automating Ring Main Units (RMUs) emanating from a B. SCADA/DMS Functionalities receiving station and ending in same or different primary The major functionalities of a SCADA/DMS are: substation (called Receiving Station). Refer Fig. 5. Each ring o Monitoring and Control of EHV and HV network approximately caters to 12 to 20 substations. The incoming o Distribution Network Power Flow: to execute real- and outgoing supplies at substation are controlled by RMUs time power flow studies for optimal switching which are basically switches or isolators. Around 800 such o Switching Procedure Management: to execute locations, out of a total of 5000 locations, had been earmarked switching orders and inverted switching orders for automation. The locations were chosen after careful study o Voltage and VAR Control: for optimal switching of of network configuration to derive maximum benefit on Capacitor banks and OLTC control investment and minimizing interruption to consumers. The o Outage Management System (OMS): to keep records 11kV RMUs or switches at these locations will ultimately be of forced and planned outages operated from remote. o Load shedding and restoration o Short Term Load Forecasting and Calculation of Quality Service Indices o Optimal Feeder Reconfiguration (OFR): for judicious network switching to reduce losses and voltage problems o Energy Balance: to give insight into the energy flow and losses in the network o Fault Location, Isolation and Service Restoration (FLISR): to determine the location of feeder faults and recommend actions to isolate the faulty sections and restore supply to the healthy sections of feeders. IV. AUTOMATION & INFORMATION MANAGEMENT AT Fig. 5. Typical Ring Main RELIANCE ENERGY LIMITED (REL), MUMBAI B. Fault Location, Isolation and Supply Restoration (FLISR) REL supplies power to 2.5 million consumers in the suburban areas of Mumbai. The total load served is about FLISR is the most powerful and useful network application 1400 MW. Mumbai enjoys the reputation of providing one of for REL which has helped in faster location, isolation of faults the most reliable power supplies to the consumers in the and supply restoration. The fault isolation and supply whole country. To maintain high standards of availability and restoration procedure pre and post DMS is explained below. reliability, REL had been continuously introducing new i) Fault Isolation and Restoration before DMS technologies in their network and processes. Commissioning implementation the State of the art Supervisory Control and Data Acquisition Before DMS implementation, fault isolation was done by
- 4. 4 trial and error method. Refer Fig. 6. In case of fault at F, the breaker A at receiving station trips and all substations on the ring up to NOP1 (A-B-C) looses power. Then the field crews are physically sent to a substation (say B) to open the switch or isolator. This might take anywhere between 10 to 30 minutes in a congested city like Mumbai. A ‘test charge’ is then taken from control centre by closing the breaker A at the receiving station. If it holds, the fault is beyond substation B. Between B and NOP, again by trial-and-error, the faulty section is identified (DE). Total fault isolation time is approximately 40 to 60 minutes. Fig.7. Fault Isolation after DMS Implementation C. Fault Passage Indicators (FPI) This device basically detects earth faults in cable system since majority of system faults (more than 70%) is earth faults. It consists of a sensor - split core CT (CBCT) and indicator. Refer Fig. 8. Fig. 6. Fault Isolation before DMS Implementation ii) Fault Isolation and Restoration after DMS implementation Under DMS implementation, typically three isolators in a ring are automated. In automated RMUs, isolator operations Fig.8. FPI with CBCT and Indicator are done by motors which can be remotely controlled. The opening or closing of isolator is done remotely from control Split core CT is wrapped around the cable under centre. All automated RMUs have built in Fault Passage observation. CBCT works on summated flux principle. Under Indicators (FPIs). Apart from this, FPIs are installed normal conditions, fluxes produced by three phase currents separately at every non-automated RMU stations. Let us IR, IY and IB add to zero. In case of earth fault on one phase, analyze the previous case with DMS in place. Refer Fig. 7. In there is a net flux and voltage is induced on secondary. This is case of fault at F, the breaker A at receiving station trips and used to drive the indicator. all substations on the ring up to NOP (A-B-C) looses power. Refer Fig. 9. When earth fault occurs between section X This scenario is same with or without DMS. However with and Y, FPIs in substations from A to X will glow but FPI at DMS in place, FPI indication at B is available at control substation Y will not glow. The fault is in the section between centre. If FPI indicates through-fault, the operator can glowing FPI (at X) and non-glowing FPI (at Y). The field immediately open the isolator at substation and close the personnel can narrow down the faulty section after observing breaker at receiving station remotely from control room. This the status of FPIs. This avoids trial end error method of takes less than a minute compared to 10 to 30 minutes without locating the faulty section reducing ‘unnecessary’ test DMS. Power is restored to the substations in the section AB charges. The stress on the equipment is less since closing on within a minute, a dramatic reduction in outage time. Also to fault is eliminated. This increases the life of the location of faulty portion (section DE) is now done more equipment. Also power quality improves as every test charge rationally using the FPI indications. On the whole this results on fault creates dip in bus voltage. in reduction in outage time and reduction in number of test charges being taken for fault isolation and supply restoration. 1 Normally Open Point
- 5. 5 o All communication channels are path-protected o Network Management features to enable monitoring of the communication network Fig.9. Fault Section Identification with FPI D. Communication Networks for Primary & Secondary Network Automation The architecture of DMS system and communication system is shown in Fig. 10 and Fig.11 respectively. Fig. 11 shows remote operation of RMU from Control Centre through Code Division Multi Access (CDMA) network. This has been engineered through integration of different elements of DMS Fig.11. Secondary Communication Automation Architecture i.e. automated RMU, field RTU (FRTU), CDMA modems and a Front-End Processor (FEP) at Control Centre. E. Data Warehousing The remote operation and monitoring of 33/22/11kV Data collected by the SCADA/DMS is stored in a Utility receiving station elements is carried out through an SDH Fiber Data Warehouse (UDW) for historical data analysis. The Data Optic network. Remote terminal units (RTU) are located in Warehouse (Oracle based) is a component that archives each receiving station for collecting field data. The Fiber selected portions of the SCADA database for years without Optic WAN (Wide-Area Network) consists of several fiber loss of data resolution or accuracy. Once data to be archived rings covering the five zones of the service area of REL. The is identified in the data engineering environment, it is communication with some of the older RTUs is over serial recorded in the warehouse database as it is updated in the protocol whereas the new RTUs communicate over IEC 870- real-time database. The users can start or stop the archiving of 5-104 protocol. The five important transmission stations at the any data point including status values, accumulator values, 220kV level, including the REL Generating Station at analog values, quality flags, sequence of event points (with Dahanu, are connected over dedicated 10 Mbps links with the millisecond time resolution), alarms and events. Control Center. The transmission stations are connected The data warehouse subsystem is highly flexible and through OPGW for SCADA communications. accommodates large amounts of data input from many sources, and provides powerful data mining capability for various purposes such as reporting, trending and analyzing past data to make informed decisions about the network operations and maintenance of assets. The warehouse is an extremely important subsystem in the Distribution Automation architecture of REL as it provides the operations, maintenance and planning teams with critical information about network operations which helps optimize maintenance and planning activities tremendously. F. Use of International Standards As the project involves collecting data from several sources and sharing the same with third party IT systems, it was important to follow international standards and avoid Fig.10. Primary Communication Network – SDH potential roadblocks in integration. Some of the important features of this communication o Using standard communication protocols such as network are: Modbus and IEC 60870-5-103 for ‘device to sub- o The communication network handles both the device’ level integration meant that it was possible to SCADA as well as the IT requirements of REL integrate meters, numerical relays and digital RTCCs o Hardware complies to EMI/EMC requirements of of various makes with the substation RTUs. harsh substation environments o Similarly, by using IEC 60870-5-101 and -104
- 6. 6 protocols for ‘device to host’ communication o Equipment subjected to less stress leading to better facilitated integration of substation RTUs from equipment condition different vendors with host computers systems at the control center system. V. CONCLUSION o ICCP is used to share data with the SCADA/EMS at Summarizing, in a short period automation has yielded the Regional Load Despatch Center. tangible benefits in terms of operational flexibility, reduction o The deployed SCADA/DMS is the central element in in outage time and improved quality of supply in REL the utility’s goal to integrate various enterprise IT network. Experience gained from deploying a large systems (such as GIS, AMR). CIM standards have SCADA/DMS has brought out several aspects that utilities been used to describe the logical (analytical) model of should be careful about while planning similar initiatives. It is an electrical network and related entities in the often seen that utilities are not able to derive the optimum SCADA/DMS with the purpose of providing a benefits of an automation system because of the following common language for describing exactly what data is reasons: required to be exchanged between different o Inadequate specification of requirements applications. o Unclear objectives G. Benefits of Automation in REL network o Overly ambitious goals – too many features are desired especially while targeting integration at not o Integrated view of Generation, Transmission and only device and sub-device level but also at the Distribution enterprise level between various IT systems, for o Centralized remote monitoring and control of information exchange network elements o Not ready with data to kick start the project o Reliable Islanding after grid collapse and Optimal o Lack of know-how within organization load shedding after islanding o Poor implementation o Network reconfiguration and load transfer switching o Lack of training performed remotely for most situations. This has led o Primary equipment compatibility not factored to optimum manpower utilization. o Centralized storage of event logs, fault analysis and VI. ACKNOWLEDGEMENT report generation. o Real-time alarm on a network fault or abnormality The authors would like to thank the management of Reliance o Better assistance to field staff in pin-pointing faulty Energy Limited for the help and support while writing this section by utilizing FPIs at all sub-stations. This has paper. Special thanks to Ms. Bina Mitra and Mr. Shrikant led to reduction in time for fault identification. Yeole for their contribution towards this paper. o Interruption time reduction due to remote operation of switches. It has led to reduction in customer hour VII. REFERENCES loss by 50%. SAIFI and SAIDI calculated for the Papers Presented at Conferences (Unpublished): whole system is not much influenced by DMS [1] Dr. K Rajamani, "Automation in Distribution Systems" Key Note Speech implementation. Effect of DMS is reflected in delivered at the National Conference on Distribution Automation held at Customer Average Interruption Duration Index CPRI, Bangalore between 29th and 31st October 2007. (CAIDI) apportioned to HT tripping as DMS is applied only for 11kV (HT) system. The figures given VIII. BIOGRAPHIES in the table below indicates CAIDI after Dr. K Rajamani obtained his PhD in Electrical Power Systems from IIT Mumbai in 1975. From 1976 to implementation of DMS in one of the zones in REL 1996, he was with Tata Consulting Engineers, network. Mumbai. He was involved in design of electrical TABLE 1 systems for thermal and nuclear power plants and IMPROVEMENT IN CAIDI BEFORE AND AFTER IMPLEMENTING DMS Static VAR compensators for rolling mill applications. From 1997 to 1998, he was with General Electric, Central Zone Nr. of HT Nr. of CAIDI in Schenectady, USA working on dynamic stability simulations for integrated operations of gas turbines (Jul-Sep) Trippings consumers minutes with steel plant loads. From 1999 to 2002, he was with Pre DMS (Y- Power Linkers, Mumbai working on specialized protection problems and 102 577,010 95. 16 islanding. From 2003, he is with Reliance Energy, Mumbai. He is involved in 2006) implementation of SCADA-DMS. His other areas of interest are protection and Post DMS (Y- power quality. 103 599,376 50.24 2007) Ranjeet Vaishnav has a B.E. in Electrical Engineering (1994) from BVM Engineering College, Sardar Patel o Improved power supply quality due to reduced test University (Gujarat). He has 13 years of experience in charges. the field of Control & Automation systems for Electric Utilities as well as for Plant Electrical Networks in the
- 7. 7 Oil & Gas industries. He has worked in various roles in Design & Engineering, Installation & Commissioning, Project Management and Technical Presales in the business of Automation & IT Systems for Electric Utilities. He is working with Tata Consultancy Services Limited on power systems related initiatives. Ranjeet is a member of IEEE and of The IET, UK.