
Recomendados
Recomendados
Más contenido relacionado
La actualidad más candente
La actualidad más candente (19)
Destacado
Destacado (16)
Similar a 1998 epitaxial film growth of the charge density-wave conductor rb0.30 moo3 on srtio3(001)
Similar a 1998 epitaxial film growth of the charge density-wave conductor rb0.30 moo3 on srtio3(001) (20)
Más de pmloscholte
Más de pmloscholte (19)
Último
Último (20)
1998 epitaxial film growth of the charge density-wave conductor rb0.30 moo3 on srtio3(001)
- 1. PHYSICAL REVIEW B VOLUME 57, NUMBER 19 15 MAY 1998-I Epitaxial film growth of the charge-density-wave conductor Rb0.30MoO3 on SrTiO3„001… A. J. Steinfort, H. S. J. van der Zant, A. B. Smits, O. C. Mantel, P. M. L. O. Scholte, and C. Dekker Delft Institute of Microelectronics and Submicron Technology (DIMES), Department of Applied Physics, Delft University of Technology, P.O. Box 5046, NL-2600 G A Delft, The Netherlands Received 29 October 1997 Thin films of the charge-density-wave compound Rb 0.30MoO 3 blue bronze have been grown on SrTiO 3 001 substrates. The films have been analyzed with atomic force microscopy and x-ray diffraction. The growth initially proceeds in the three-dimensional island growth mode Volmer-Weber mode with dropletlike islands that are highly uniform and fully relaxed. Epitaxial growth is observed: the fourfold symmetry of the SrTiO 3 001 surface results in four crystallographic orientations. Thick films show cluster formations that differ in size and form from the islands that appear at the initial stage of growth. They are larger and have an asymmetric shape with clear facets. X-ray diffraction on thick films shows a decrease of both the in-plane and out-of-plane texture. The data are explained with a simple model that involves blue bronze layer growth over the facets of the clusters. The model indicates that the crystalline correlation length perpendicular to the charge-density-wave axis is smaller than the dimensions of the grains. The implications of the model on the electrical transport are discussed. S0163-1829 98 06916-1 I. INTRODUCTION films grow in the island growth mode until full coverage of ¯ the surface. For thicker films, overgrowth of (201 slabs oc- In quasi-one-dimensional conductors a phase transition curs over regular cluster facets, thus limiting the correlation may occur to a collective ground state in which the charge length. Films were investigated by means of atomic force density is periodically modulated.1,2 Both inorganic and or- microscopy AFM and x-ray diffraction. ganic materials have demonstrated this ordered charge- The compound Rb 0.30MoO 3 belongs to the blue bronzes6 density-wave CDW state up to temperatures of several hun- A 0.30MoO 3 with A K, Rb, or Cs. Its crystal structure is dreds of degrees kelvin, including room temperature. In monoclinic, space group C 2/m with 20 formula units in the equilibrium, the CDW is pinned to impurities and conduction unit cell. It has a layered type structure in which the slabs are only occurs by quasiparticles that are excited above the en- built up from units containing ten distorted MoO 6 octahedra. ergy gap. In the low bias dc resistivity, the CDW state shows The Rb atoms are positioned in between the slabs. The blue up as a Peierls3 transition from metal-like behavior at high bronze lattice dimensions are given by a 18.536 Å, temperatures to semiconducting behavior at low tempera- b 7.556 Å, c 10.035 Å, and 118.52°. 7 Single crystals tures. When a moderate electric field is applied of the order of blue bronze grow as platelets elongated in the b direction of 1 V/cm , however, the CDWs can slide collectively. The ¯ forming large 201 crystal facets parallel to the slabs. Blue collective CDW motion leads to strongly nonlinear conduc- bronze exhibits a Peierls transition at 182 K. tion, coherent current oscillations, and mode locking at reso- In our films blue-bronze growth mainly proceeds in the nant frequencies. ¯ (201 direction. For this growth direction, the in-plane rect- The sliding motion of CDWs shows many similarities angular blue bronze lattice net is formed by the b axis and with transport in superconductors, with the role of current the 102 lattice vector. The mismatch between the b axis of and voltage reversed. For the collective CDW current, a blue bronze and twice the principal axis of SrTiO 3 (001) is current-frequency relation exists similar to the ac Josephson 3.3%. In the perpendicular in-plane direction, the mismatch relation between voltage and frequency in superconductors. between the 102 blue bronze and five times the principal Thin-film devices with Josephson junctions are very impor- axis of the substrate is 1.4%. Previous scanning electron mi- tant in both fundamental studies and applications of super- croscopy SEM studies5 have shown that grains grow conductivity. Such devices are unexplored for CDW systems mainly in two perpendicular directions oriented along the due to the absence of a thin-film CDW technology. Various principal axes of the SrTiO 3 substrate. No systematic study properties, e.g., the extremely high dielectric constants up to on the growth mechanism has been performed yet. 10 8 ) and the mode locking, are potentially important in this respect. The CDW state has been studied extensively in bulk crys- II. EXPERIMENTAL DETAILS tals for which the dimensions are much larger than the phase coherence length of the CDW. This coherence length is typi- Blue-bronze films were deposited on SrTiO 3 001 sub- cally of the order of micrometers along the direction of the strates by pulsed-laser deposition. By x-ray diffraction, the CDW chains. We have recently reported the first thin-film vicinal angle of the SrTiO3 001 substrates is estimated to growth of a CDW compound.4,5 In this paper we focus on a 0.5° or less. No influence of these miscut angles on the film more detailed study of epitaxial growth of thin Rb 0.30MoO 3 growth is observed.8 Before mounting, the SrTiO 3 001 sub- blue bronze films on SrTiO 3 001 substrates. We find that strates with typical sizes of 5 5 0.5 mm 3 are cleaned with 0163-1829/98/57 19 /12530 6 /$15.00 57 12 530 © 1998 The American Physical Society
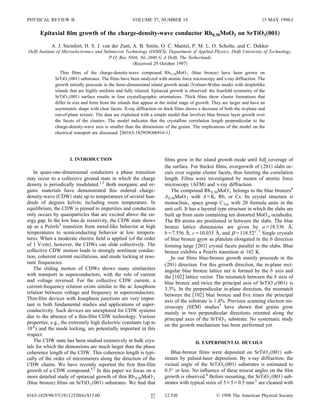
- 2. 57 EPITAXIAL FILM GROWTH OF THE CHARGE- . . . 12 531 organic solvents. Substrates are then glued with silver paint on a heater block that is situated opposite to the target at a distance of 4.7 cm. A polycrystalline Rb 0.30MoO 3 target is placed in a pulsed-laser beam. The illuminated area is about 5 mm 2 . The background pressure in the deposition chamber is 10 6 Torr. During deposition the target rotates and depo- sition takes place in an oxygen atmosphere. To obtain single- phase blue-bronze films the substrate temperature is kept be- tween 375 °C and 500 °C and the oxygen pressure between 100 and 175 mTorr. Films were grown with thicknesses ranging from 1.5 to 1000 nm. Film thicknesses ranging from 300 to 1000 nm were determined by measuring the depth profile across a cut through the film with a Tencor Instru- ments -step 200 profilometer. Thinner films were obtained by adjusting the deposition time. More details about the film growth have been presented elsewhere.4,5 After deposition, various analysis techniques have been used for characterization of the blue-bronze films such as AFM, transmission electron microscopy, scanning electron microscopy, scanning tunneling microscopy STM , optical microscopy, and x-ray diffraction. In this paper we discuss in detail the results obtained from AFM and x-ray diffraction. AFM was done with a Nanoscope III in air at room tempera- ture. The diffraction experiments on films with a thickness from 300 to 1000 nm were carried out with a four-circle FIG. 1. AFM images of the surface of a blue-bronze film on diffractometer. The Cu K x-ray beam was taken from a SrTiO 3 001 . a Small islands are observed for film thicknesses of standard laboratory source run at 20 mA and 40 kV. Slits 2 nm, whereas in b for a film thickness of 300 nm, the surface is were used to define the primary beam and the acceptance covered with much larger, uniformly shaped clusters. angle of the detector. The width of the primary beam in the scattering plane was 0.10°, and a Ni filter was used to elimi- film-substrate relation and the crystalline quality have been nate the K contribution in the wavelength spectrum. investigated. The film-substrate relation is determined from The x-ray measurements on two blue-bronze films with a the in-plane and out-of-plane orientation of the crystal axes thickness of 2 nm were performed on the vertical scattering of both the substrate and the adlayer. The crystalline film diffractometer at the BW2 wiggler beamline in HASYLAB quality is inspected with respect to the correlation length, the DESY Hamburg . The photon energies used for the diffrac- strain, and the texture. Measurements have been performed tion experiments at the two samples were 8.6 and 9.0 keV, on two samples grown at 375 °C and 410 °C, which gave respectively. The angle of grazing incidence was kept con- similar results. stant and equal to 0.5°. All diffraction measurements were The out-of-plane growth direction for blue bronze is performed in air at room temperature. ¯ (201 only, which means that the layers grow plane-parallel to the surface. The orientation of the in-plane b axis in the III. EXPERIMENTAL DATA adlayer has been determined from the intensity distribution on the 020 in-plane circle. This intensity profile describes A. Initial stage of growth all possible directions of the b * axes. In Fig. 2 a , the profile The initial growth of blue bronze on SrTiO 3 001 has at the 020 circle is shown in which the substrate is oriented been studied on films with a thickness between 1 and 10 nm. such that the principal axes are along 0° and 90°. The film thickness is equivalent to the thickness of a con- The background signal is due to scattering from Vaseline tinuous film with the same amount of material. The data used to mount the sample on the diffractometer. The four presented here were taken on films with an equivalent layer maxima in the 020 intensity profile correspond to orienta- thickness of 2 nm. A typical AFM image is shown in Fig. tions of the b axes parallel to the principal axes of the sub- 1 a in which 3D island nucleation is clearly visible. The strate. typical length scale of the dropletlike-shaped islands is 150 To estimate the crystalline quality in the film, the width 50 nm. Their height is about 10 nm. The sample in Fig. and the position of several independent reflections have been 1 a was grown at 440 °C and the island density is about 30 inspected. In general, the tangent width of the reflections m 2 . We have systematically studied the initial stage of i.e., the width of the reflections along a circle in the plane of growth as a function of growth temperature and deposition the surface is due to a combination of a correlation length rate. Island growth dominates in all cases. The density of the reduction and a crystalline orientation distribution. A finite- islands varies only slightly with deposition temperature or size effect results in a broadening independent of the radial deposition rate. position. An orientation distribution leads to a broadening More information about these ultrathin films is obtained with a linear dependence on the radial distance. The tangent by means of synchrotron x-ray diffraction. In particular, the widths of the blue-bronze 0 2n 0 reflections with n 1, 2,
- 3. 12 532 A. J. STEINFORT et al. 57 FIG. 3. The intensity distribution from a 300-nm-thick film re- ¯ ¯ corded through the main 221 and the 403 reflections. In a the circle parallel to the surface is scanned showing four main in-plane crystalline orientations. In b the intensity is recorded by rotating the sample around the b axis. FIG. 2. X-ray-diffraction measurements from a 2-nm-thick film. a The scattering profile recorded on the in-plane 020 circle 10–50 nm. At coverages equivalent to 15 nm and more, showing the preferred crystalline orientations. b The width in AFM images show the formation of larger, uniformly shaped SrTiO 3 rlu of the 0 2n 0 reflections along a circle in the plane of clusters. A typical AFM image of a 300-nm-thick film is the surface. From the slope and the offset of the linear fit through shown in Fig. 1 b . This film is grown at the same tempera- the data points the in-plane orientation distribution and the particle ture and deposition rate as the film in Fig. 1 a . Clearly, the size are estimated. density of the clusters is significantly less than the island density at the initial stage of growth. In contrast to films at and 3 are shown in Fig. 2 b as a function of the radial the initial stage of growth, we find that both the island den- distance in reciprocal space. The distances are expressed in sity and grain sizes of the thick films are strongly tempera- SrTiO 3 reciprocal lattice units rlu with h parallel to the ture dependent. Island density varies from 10 m 2 at blue-bronze b * axis and k in the in-plane direction perpen- 375 °C to 3 m 2 at 440 °C. Grain sizes range from 0.3 dicular to it. The linear fit through the data points is shown as 0.5 m2 at 375 °C to 1 5 m 2 at 440 °C. In general, a solid line. The slope of this solid line corresponds to the thick films consist of grains that are about 10–100 times orientation distribution, and from the intersection with the y larger than the islands at the initial growth stage. axis the island size can be estimated. As can be seen in Fig. Grains in thick films have a form that is very different 2 b , the peak broadening is almost entirely due to an orien- from the dropletlike shape. As can be seen in Fig. 1 b , elon- tation distribution of 1.11°. The intersection of the linear fit gated grains grow in two perpendicular directions. Section with the y axis corresponds to an island size of 200 nm. As analysis on the height profiles shows that the clusters are the intersection is close to the origin, the relative error is asymmetrically bound by facets along the long side. The large, but the estimate of 200 nm equals the size of the is- facet planes are well defined and make preferred angles with lands as deduced from AFM images. Apparently, the islands the substrate. The angles of more than 1000 facets have been are monocrystalline. measured by the AFM and plotted in a histogram see Fig. The strain in the film has been deduced from the positions 5 b . From this histogram the preferred angles are estimated of the in-plane 020 reflection together with thirteen inde- to be 7°, 14°, 18°, 22°, 30°, 32°, and 39°. Angles larger pendent reflections. Strain shows up as an asymmetric peak than 50° were impossible to measure by AFM because of profile or in a shift of the peak position. No asymmetry or convolution between the tip and the surface profile. positional shifts with respect to the bulk reflection positions The film texture and relative orientations of the islands have been found up to 0.1%. This implies that the initial have been studied by means of x-ray diffraction. Measure- islands are fully relaxed. The relaxed, monocrystalline crys- ments are performed on films with a thickness ranging from tal formation on the surface with an orientation distribution 200 to 1000 nm. In general, the in-plane and out-of-plane of over 1° suggests a very weak film-substrate bonding. In texture decreases by increasing the film thickness. The out- spite of this weak bonding, heteroepitaxial film growth is of-plane growth direction of the blue-bronze layers remains ¯ observed: the films are oriented with the (201 slabs parallel ¯ ¯ mainly (201 . Only a minor part of the film is (403 oriented to the substrate surface and the b axis oriented along the as has been estimated from an out-of-plane -2 x-ray scan. substrate principal axes. ¯ The in-plane orientation of the (201 clusters has been investigated from the intensity profiles on the surface- B. Thick Rb 0.30MoO 3 films on SrTiO 3 „100… ¯ ¯ parallel circles through the 221 and the 403 reflections. Continuation of the deposition of blue bronze leads to a An example of the scattering profiles is shown in Fig. 3 a . full coverage of the surface at a layer thickness of about The substrate principal axes are oriented along the 0°
- 4. 57 EPITAXIAL FILM GROWTH OF THE CHARGE- . . . 12 533 and the 90° directions. For clarity, the intensity profiles around the maxima are shown on a larger intensity scale. The similar shape of the profiles shows the azimuthal orientation ¯ distribution of the (201 clusters. The four main intensity maxima in Fig. 3 a result from clusters that are oriented with the b axes along the substrate principal axes. The width of the maxima is 1.3°, slightly more than the width of the peaks in Fig. 2 a . In general, we find that for thick films the in-plane width of the maxima is substantially more than 1° typically, it varies between 2° and 7°. In addition to the main orientations along the substrate axes, intermediate orienta- tions are present that make an angle of 27° and 45° with the substrate principal axes. The width of these maxima is about 10°. Both the broadening of the peaks and the observation of additional orientations indicate a reduced in-plane texture for FIG. 4. The lateral intensity profile of a 300-nm-thick blue- thick films. bronze film recorded at different heights in reciprocal space. Extra The out-of-plane orientation shows a similar trend as reflections are visible on both sides of the rod through the blue found for the in-plane orientation, less texture with increas- bronze ¯01 as a result of the facets on the blue-bronze clusters. 2 ing films thickness. All additional out-of-plane orientations, The reflections run in a direction 55° with the surface. In a the however, have the b axes in the plane of the surface. In Fig. reflections coincide at the blue bronze 020 at l 0 and in b they ¯ ¯ 3 b the profiles through the main 221 and 403 reflections coincide at blue bronze ¯21 at l 0.473. 2 are shown. The x axes in these plots indicate a rotation around the b axis. The profiles clearly contain several side pal axes of the substrate. The relaxed state of the islands peaks next to the main reflection. We have checked that the indicates a weak film-to-substrate bonding. This weak bond- side peaks do not result from a superperiodicity. The main ing may also be responsible for the in-plane mosaic spread of reflection belongs to a ¯01 -oriented material and the side 2 1.1°. At an average film thickness of 10–50 nm, the surface ¯ peaks result from blue bronze with tilted 201 planes. The is fully covered with islands. Between the closed-packed is- tilt angles equal 7°, 14°, and 18°. In the conventional unit lands, grain boundaries will appear as a result of the discrep- cell description, most of these orientations do not result in ancy between the unit nets of the substrate surface and the low-index planes parallel to the surface except for the peak film. The grain boundaries will limit the correlation length to near 18°. Rotation of the ¯01 slabs over 18° around the b 2 the size of the islands. At higher coverages a change in the ¯ axis results in 403 -oriented material, in agreement with the growth appears. Larger, highly uniform, elongated clusters -2 scans. start to form with dimensions 10–100 times larger than the With synchrotron x-ray diffraction, it is in principle pos- initial islands. The grain density is considerably smaller than sible to measure facet angles if the facets are well defined at the initial stage of growth. In both the in-plane and the and have dimensions of tens of nanometers or larger. Cluster out-of-plane direction the number of preferred orientations faceting results in the appearance of intensity rods in recip- and the mosaic spread increases. rocal space parallel to the facet normal9 analogous to the Our observations suggest three distinct stages of growth. appearance of crystal truncation rods as a result of the pres- In the initial stage, small monocrystalline islands nucleate at ence of a crystal surface. An example is shown in Fig. 4. the substrate surface. Growth of these islands proceeds until Three profiles are shown, recorded in the surface-parallel full coverage. In the second stage, overgrowth of large clus- direction along a principal axis at different heights in recip- ters bounded by well-defined facets occurs. Since these clus- rocal space. The central peak in the profiles is the crystal ters cover several uncorrelated initial islands, a decrease in truncation rod as a consequence of the surface. On both sides the in-plane texture is expected. This decrease is, for in- of the central peak, minor peaks are visible. These side peaks stance, evident in the observed increase of the in-plane mo- form a line of intensity that makes an angle of 55° with the saic spread. The third stage of growth is characterized by surface. The peak broadening due to the orientation distribu- ¯ growth of 201 slabs over the facets. tion prohibits the observation of facet angles smaller than The model for the second and third stages of growth can 40°. The diffraction measurements can therefore not confirm be made more quantitative by describing the clusters with a the presence of facets with angles smaller than 40° as ob- modified unit cell. This cell is built up from unit blocks served in the AFM studies. defined by the in-plane 102 and b axis, and the c axis. In this new description, several (h 0 l) facets can be formed, IV. DISCUSSION with only small values of h and l. For example, the 14° facet corresponds to a ¯01 facet with a terrace width of two unit 2 Film growth on SrTiO 3 001 initially proceeds in the 3D cells followed by a step of one unit cell height. The 100 island growth mode Volmer-Weber mode . The typical is- facet corresponds to the 55° faceting as measured with x-ray land size is 50–200 nm with an island height of about 10 nm. diffraction. The angles of 7°, 14°, 18°, 22°, 30°, and 39° as The islands are monocrystalline and show clear epitaxial be- observed in AFM measurements are identified as ¯04 , 1 havior: the fourfold symmetry of the substrate surface results ¯ ¯ 102 , 101 , 403 , 101 , and 401 facets, respectively. in four crystallographic blue-bronze orientations. Islands Note that this model predicts the clusters to be asymmetric ¯ grow in the 201 direction with the b axis along the princi- when viewed along the b axis Fig. 5 a . The growth of
- 5. 12 534 A. J. STEINFORT et al. 57 FIG. 5. A model for the cluster growth. The second stage of growth as described in the text is illustrated in the upper panel. Various facet angles are schematically shown in a , which correspond to the angles determined from AFM data b . The third stage of growth is illustrated ¯ in the lower panel. The growth of 201 slabs over the cluster facets is schematically shown in c . The overgrowth is confirmed by STM images of a cluster d showing different periodicities perpendicular to the b axis. ¯ 201 slabs over the faceted grains is schematically shown in V. CONCLUSIONS Fig. 5 c . The angles between the ¯01 slabs and the surface 2 Highly textured films are grown on SrTiO 3 001 sub- are consistent with the x-ray diffraction data Fig. 3 b . strates. At the initial growth, heteroepitaxial monocrystalline The overgrowth of the slabs is also confirmed by STM islands form with a weak substrate-film bonding. The blue measurements.10 In Fig. 5 d an STM image of a cluster is bronze is fully relaxed, and orients with the in-plane b axis shown. In this image periodic line structures are observed. In to the principal axes of the substrate. An orientation distri- these lines the b-axis periodicity is present with a period of bution of 1.1° around these directions is observed. On thick ¯ 0.75 nm. The lines are the end points of tilted 201 slabs as films, grains are considerably larger and the orientation illustrated in Fig. 5 c . The periodicity perpendicular to the b spread increases. The major part of the grains remains ori- axis is therefore determined by the facet angle over which ented with the b axis along the principal axes of the sub- overgrowth occurs. The horizontal distance between 201 ¯ strate. A minor part of grains have additional orientations of slabs is equal to d (2 01) /sin(tilt angle) with d (2 01) 0.83 nm. ¯ ¯ 27° and 45° with respect to the SrTiO 3 100 . In the out-of- In Fig. 5 d we observe periodicities of 2.45 and 1.43 nm plane direction, the thick films show additional orientations. between the lines. These distances correspond to tilt angles The b axis remains oriented in-plane, but besides the ¯ surface-parallel 201 slabs, a tilt of the slabs is observed. A of 22° and 39°. We have made many STM images of blue- bronze clusters. Most of the clusters contain a periodicity in correlation between the faceting of the clusters and the pre- a direction perpendicular to the b axis. In all cases, we could ferred out-of-plane orientations is found. The data are fully ¯ explained with a model including growth of 201 slabs over identify a low-index facet angle that corresponds to the ob- served period. facets of the clusters. The model indicates that the correlation The overgrowth results in a correlation length that is length perpendicular to the b axis is smaller than the dimen- smaller than the cluster size. This conclusion is consistent sions of the grains. This observation is consistent with elec- with our electrical transport measurements on blue-bronze trical transport data, which show that the energy gap mea- films. In general, we find an energy gap that is lower than the sured in films grown on SrTiO 3 001 substrates is largely observed values 520 K in bulk blue bronze. Films grown independent on the apparent grain size as deduced from SEM on Al2 O3 012 show a systematic decrease of the energy gap pictures. with decreasing grain size. Films grown at high temperatures ACKNOWLEDGMENTS with large grains have an energy gap close to the bulk value. For films with submicron grains, the gap is reduced by 30%. The authors would like to thank P. W. F. Rutten and Such a dependence is absent for films grown on C. A. W. Bal for their careful AFM work, and K. R. Koops SrTiO 3 (001): no matter how large the grain size, the appar- for the support by the STM measurements. We also want ent gap deduced from electric transport measurements is al- to thank M. Nielsen and J. Baker for the assistance on most constant around 400 K . Extrapolation of the results the diffraction experiments at the DESY synchrotron obtained on the Al 2 O 3 012 substrates then yields that the in Hamburg. This work has been supported by The Nether- grains seen by SEM on SrTiO 3 (001) must consist of smaller lands Foundation for Fundamental Research on Matter clusters. FOM .
- 6. 57 EPITAXIAL FILM GROWTH OF THE CHARGE- . . . 12 535 1 ¨ G. Gruner, Density Waves in Solids Addison-Wesley, Reading Low-Dimensional Electronic Properties of Molybdenum MA, 1994 . Bronzes and Oxides, edited by C. Schlenker Kluwer, New 2 P. Monceau, in Electronic Properties of Inorganic Quasi-One York, 1989 , pp. 159–257. Dimensional Compounds, edited by P. Monceau Reidel, Dor- 7 W. J. Schutte and J. L. de Boer, Acta Crystallogr., Sect. B: Struct. drecht, 1985 , Vol. 2. Crystallogr. Cryst. Chem. 49, 579 1993 . 3 R. Peierls, Quantum Theory of Solids Oxford University Press, 8 A. J. Steinfort, Ph.D. thesis, Delft, The Netherlands, 1998 . Oxford, 1955 , p. 108. 9 A. J. Steinfort, P. M. L. O. Scholte, A. Ettema, F. Tuinstra, M. 4 H. S. J. van der Zant, O. C. Mantel, C. Dekker, J. E. Mooij, and Nielsen, E. Landemark, D.-M. Smilgies, R. Feidenhans’l, G. C. Træholt, Appl. Phys. Lett. 68, 3823 1996 . Falkenberg, L. Seehofer, and R. L. Johnson, Phys. Rev. Lett. 77, 5 O. C. Mantel, H. S. J. van der Zant, A. J. Steinfort, C. Dekker, C. 2009 1996 . Træholt, and H. W. Zandbergen, Phys. Rev. B 55, 4817 1997 . 10 6 A. J. Steinfort and H. S. J. van der Zant unpublished . C. Schlenker, J. Dumas, C. Escribe-Filippini, and H. Guyot, in