Financial analysis mining and metallurgical company norilsk nickel ojsc or gmk norilsk nickel is a producer of base and precious metals. the company's main products are nickel and palladium
•
0 likes•509 views


Recommended
Recommended
More Related Content
What's hot
What's hot (11)
Viewers also liked
Viewers also liked (20)
Similar to Financial analysis mining and metallurgical company norilsk nickel ojsc or gmk norilsk nickel is a producer of base and precious metals. the company's main products are nickel and palladium
Similar to Financial analysis mining and metallurgical company norilsk nickel ojsc or gmk norilsk nickel is a producer of base and precious metals. the company's main products are nickel and palladium (20)
More from BCV
More from BCV (20)
Recently uploaded
Recently uploaded (20)
Financial analysis mining and metallurgical company norilsk nickel ojsc or gmk norilsk nickel is a producer of base and precious metals. the company's main products are nickel and palladium
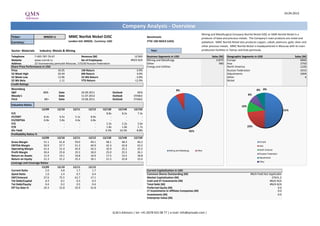
- 1. 24.04.2013 Company Analysis - Overview Mining and Metallurgical Company Norilsk Nickel OJSC or GMK Norilsk Nickel is a Ticker: MNOD LI MMC Norilsk Nickel OJSC Benchmark: producer of base and precious metals. The Company's main products are nickel and Currency: London Intl: MNOD, Currency: USD FTSE 100 INDEX (UKX) palladium. MMC Norilsk Nickel also produces copper, cobalt, platinum, gold, silver and other precious metals. MMC Norilsk Nickel is headquartered in Moscow with its main Sector: Materials Industry: Metals & Mining Year: production facilities in Taimyr and Kola peninsula. Telephone 7-495-787-76-67 Revenue (M) 12'065 Business Segments in USD Sales (M) Geographic Segments in USD Sales (M) Website www.nornik.ru No of Employees #N/A N/A Mining and Metallurgy 11075 Europe 6066 Address 22 Voznesensky pereulok Moscow, 115230 Russian Federation Other 990 Asia 2750 Share Price Performance in USD Energy and Utilities North America 1226 Price 16.05 1M Return -3.9% Russian Federation 1015 52 Week High 20.44 6M Return 4.0% Adjustments 1004 52 Week Low 13.96 52 Wk Return -3.8% Other 4 52 Wk Beta 1.11 YTD Return -12.9% Nickel Credit Ratings Bloomberg - 8% 8% 0% S&P BBB- Date 26.09.2011 Outlook NEG Moody's - Date 11.07.2012 Outlook STABLE 8% Fitch BB+ Date 19.08.2011 Outlook STABLE Valuation Ratios 10% 12/09 12/10 12/11 12/12 12/13E 12/14E 12/15E 51% P/E - - - - 8.8x 8.2x 7.3x EV/EBIT 8.4x 6.5x 5.1x 8.0x - - - EV/EBITDA 6.8x 5.8x 4.6x 6.8x - - - P/S - - - - 2.2x 2.2x 2.0x P/B - - - - 1.8x 1.8x 1.7x 23% Div Yield - - - - 9.3% 10.3% 8.8% 92% Profitability Ratios % 12/09 12/10 12/11 12/12 12/13E 12/14E 12/15E Gross Margin 51.1 61.8 59.0 49.1 48.1 48.3 46.2 Europe EBITDA Margin 50.9 57.7 51.3 40.9 42.3 42.8 43.2 Asia Operating Margin 41.4 51.4 45.9 34.3 35.9 35.2 35.2 North America Mining and Metallurgy Other Profit Margin 30.4 25.8 25.5 18.0 25.0 25.5 26.1 Russian Federation Return on Assets 11.9 14.1 16.8 10.9 17.5 15.5 18.8 Adjustments Return on Equity 21.3 21.2 25.3 18.1 21.5 22.8 23.4 Other Leverage and Coverage Ratios 12/09 12/10 12/11 12/12 Current Ratio 2.0 4.8 1.7 1.7 Current Capitalization in USD Quick Ratio 1.0 2.4 0.7 0.4 Common Shares Outstanding (M) #N/A Field Not Applicable EBIT/Interest 27.6 75.5 61.7 17.1 Market Capitalization (M) 27631.2 Tot Debt/Capital 0.3 0.1 0.3 0.3 Cash and ST Investments (M) #N/A N/A Tot Debt/Equity 0.4 0.2 0.5 0.4 Total Debt (M) #N/A N/A Eff Tax Rate % 24.3 22.8 25.9 31.8 Preferred Equity (M) 0.0 LT Investments in Affiliate Companies (M) 0.0 Investments (M) 0.0 Enterprise Value (M) Q.M.S Advisors | tel: +41 (0)78 922 08 77 | e-mail: info@qmsadv.com |
- 2. Company Analysis - Analysts Ratings MMC Norilsk Nickel OJSC Target price in USD Broker Recommendation Buy and Sell Recommendations vs Price and Target Price Price Brokers' Target Price 25 30 100% 6% 5% 5% 7% 7% 7% 6% 6% 7% 7% 13% 18% 25 80% 20 37% 20 44% 42% 24% 40% 15 60% 67% 64% 15 75% 10 81% 87% 87% 87% 40% 10 5 59% 58% 0 50% 53% Morgan Stanley Barclays Otkritie Capital Gazprombank UFS-Finance Investment Credit Suisse JPMorgan HSBC Sberbank CIB Societe Generale BCS Aton LLC VTB Capital TKB Capital Alfa-Bank Goldman Sachs Renaissance Capital Deutsche Bank 47% 20% 5 27% 29% Company 19% 13% 7% 7% 7% 0% 0 avr.12 mai.12 juin.12 juil.12 août.12 sept.12 oct.12 nov.12 déc.12 janv.13 févr.13 mars.13 Buy Hold Sell Price Target Price Date Buy Hold Sell Date Price Target Price Broker Analyst Recommendation Target Date 29-Mar-13 58% 37% 5% 24-Apr-13 16.05 19.82 Gazprombank NATALIA SHEVELEVA overweight 20.00 24-Apr-13 28-Feb-13 53% 42% 5% 23-Apr-13 15.53 19.82 Morgan Stanley DMITRIY KOLOMYTSYN Underwt/In-Line 11.00 23-Apr-13 31-Jan-13 50% 44% 6% 22-Apr-13 15.78 20.55 HSBC VLADIMIR ZHUKOV neutral 16.50 21-Apr-13 31-Dec-12 59% 24% 18% 19-Apr-13 15.74 20.84 Deutsche Bank ERIK DANEMAR hold 20.00 19-Apr-13 30-Nov-12 47% 40% 13% 18-Apr-13 15.50 20.84 Alfa-Bank BARRY EHRLICH equalweight 17.30 16-Apr-13 31-Oct-12 29% 64% 7% 17-Apr-13 15.25 20.84 Sberbank CIB MIKHAIL STISKIN hold 18.32 16-Apr-13 28-Sep-12 27% 67% 7% 16-Apr-13 15.68 21.18 UFS-Finance Investment Company ILYA BALAKIREV buy 23.60 16-Apr-13 31-Aug-12 19% 75% 6% 15-Apr-13 15.89 21.47 Societe Generale ABHISHEK SHUKLA buy 23.00 15-Apr-13 31-Jul-12 13% 81% 6% 12-Apr-13 16.57 21.58 Credit Suisse SEMYON MIRONOV outperform 19.60 3-Apr-13 29-Jun-12 7% 87% 7% 11-Apr-13 16.76 21.58 Goldman Sachs YULIA CHEKUNAEVA neutral/neutral 21.00 15-Mar-13 31-May-12 7% 87% 7% 10-Apr-13 17.17 21.48 Otkritie Capital DENIS GABRIELIK buy 19.70 15-Mar-13 30-Apr-12 7% 87% 7% 9-Apr-13 17.07 21.48 JPMorgan YURIY A VLASOV neutral 19.10 21-Feb-13 8-Apr-13 16.59 21.60 Barclays VLADIMIR SERGIEVSKIY overweight 22.50 14-Feb-13 5-Apr-13 16.48 21.60 Renaissance Capital BORIS KRASNOJENOV buy 23.00 28-Jan-13 4-Apr-13 16.60 21.60 BCS KIRILL CHUYKO buy 23.00 18-Jan-13 3-Apr-13 16.73 21.60 VTB Capital NIKOLAY SOSNOVSKIY hold 20.00 21-Dec-12 2-Apr-13 16.85 21.81 Aton LLC DINNUR GALIKHANOV sell 14.60 4-Dec-12 1-Apr-13 16.89 21.81 TKB Capital MARIA KALVARSKAIA buy 27.00 11-Jan-11 29-Mar-13 16.89 21.81 28-Mar-13 16.89 21.81 27-Mar-13 16.65 21.81 26-Mar-13 16.51 21.81 25-Mar-13 16.27 21.72 22-Mar-13 16.71 21.72 21-Mar-13 16.76 21.59 20-Mar-13 16.74 21.59 19-Mar-13 16.59 21.70 18-Mar-13 16.65 21.70 15-Mar-13 17.21 21.70 14-Mar-13 17.35 21.57 Q.M.S Advisors | tel: +41 (0)78 922 08 77 | e-mail: info@qmsadv.com |
- 3. 24.04.2013 MMC Norilsk Nickel OJSC Company Analysis - Ownership Ownership Type Ownership Statistics Geographic Ownership Distribution Geographic Ownership 1% Shares Outstanding (M) #N/A Field Not Applicable Others 100.00% 0% 0% 0% 0% Float 0.00% 0% 0% Short Interest (M) 0.00% Short Interest as % of Float 0.00% Days to Cover Shorts 0.00% Institutional Ownership 0.00% Retail Ownership 0.00% Insider Ownership Others 0.00% Institutional Ownership Distribution Others 100.00% 100% 0.00% 0.00% Institutional Ownership Retail Ownership Insider Ownership 0.00% Pricing data is in USD Others 0.00% Others Others Top 20 Owners: TOP 20 ALL Institutional Ownership Holder Name Position Position Change Market Value % of Ownership Report Date Source Country VANGUARD GROUP INC 8'318'711 -446'840 133'515'312 0.48% 31.12.2012 MF-AGG UNITED STATES 0% 0% 0% BARING INTERNATIONAL 8'137'574 8'137'574 130'608'063 0.47% 31.12.2012 13F BRITAIN 0% BNP PARIBAS INV PART 5'129'290 1'274'754 82'325'105 0.30% 28.02.2013 ULT-AGG FRANCE FRANKLIN RESOURCES 5'073'960 75'900 81'437'058 0.29% 31.12.2012 ULT-AGG UNITED STATES BARING ASSET MANAGEM 4'797'930 944'039 77'006'777 0.28% 31.12.2012 MF-AGG IRELAND JP MORGAN 4'561'641 25'615 73'214'338 0.26% 28.02.2013 ULT-AGG VAN ECK ASSOCIATES C 4'434'338 52'940 71'171'125 0.26% 23.04.2013 ULT-AGG UNITED STATES BLACKROCK 4'352'197 432'194 69'852'762 0.25% 22.04.2013 ULT-AGG UNITED STATES DWS INVESTMENT SA 3'536'560 300'000 56'761'788 0.21% 28.02.2013 MF-AGG LUXEMBOURG GRANTHAM MAYO VAN OT 3'337'724 0 53'570'470 0.19% 31.05.2012 MF-AGG UNITED STATES 100% ALLIANZ ASSET MANAGE 2'533'017 903'464 40'654'923 0.15% 31.03.2013 ULT-AGG GERMANY ALLIANCE BERNSTEIN 2'528'259 900'371 40'578'557 0.15% 28.02.2013 ULT-AGG UNITED STATES TEMPLETON INVESTMENT 2'453'764 0 39'382'912 0.14% 31.12.2012 MF-AGG BRITAIN SEB 2'103'863 7'738 33'767'001 0.12% 31.12.2012 ULT-AGG Others Others PICTET CONSEIL EN IN 1'655'244 819'149 26'566'666 0.10% 31.01.2013 MF-AGG LUXEMBOURG CARNEGIE FONDER AB/S 1'573'000 0 25'246'650 0.09% 28.02.2013 MF-AGG SWEDEN THAMES RIVER CAPITAL 1'504'605 0 24'148'910 0.09% 30.09.2012 MF-AGG BRITAIN STATE STREET 1'373'744 -1'964 22'048'591 0.08% 23.04.2013 ULT-AGG UNITED STATES PRINCIPAL FINANCIAL 1'179'718 451'070 18'934'474 0.07% 31.03.2013 ULT-AGG UNITED STATES PICTET & CIE 1'157'555 1'157'555 18'578'758 0.07% 31.01.2013 MF-AGG SWITZERLAND Top 5 Insiders: Holder Name Position Position Change Market Value % of Ownership Report Date Source Q.M.S Advisors | tel: +41 (0)78 922 08 77 | e-mail: info@qmsadv.com |
- 4. Company Analysis - Financials I/IV MMC Norilsk Nickel OJSC Financial information is in USD (M) Equivalent Estimates Periodicity: Fiscal Year 12/02 12/03 12/04 12/05 12/06 12/07 12/08 12/09 12/10 12/11 12/12 12/13E 12/14E 12/15E Income Statement Revenue 3'133 5'201 7'033 7'169 11'550 17'119 13'980 8'542 12'775 14'122 12'065 12'301 12'833 13'838 - Cost of Goods Sold 1'774 2'873 3'179 2'994 3'158 5'882 7'626 4'177 4'883 5'793 6'145 Gross Income 1'360 2'328 3'854 4'175 8'392 11'237 6'354 4'365 7'892 8'329 5'920 5'912 6'201 6'386 - Selling, General & Admin Expenses 568 751 866 841 1'090 3'878 1'869 830 1'325 1'851 1'777 (Research & Dev Costs) 40 14 20 18 19 Operating Income 792 1'577 2'988 3'334 7'302 7'359 4'485 3'535 6'567 6'478 4'143 4'415 4'518 4'876 - Interest Expense 109 40 68 83 67 284 397 128 87 105 242 - Foreign Exchange Losses (Gains) -17 -15 12 25 -65 -146 397 141 22 334 -214 - Net Non-Operating Losses (Gains) -174 213 355 110 523 -514 3'964 -40 -324 393 972 Pretax Income 874 1'339 2'553 3'116 6'777 7'735 -273 3'306 6'782 5'646 3'143 3'933 4'198 4'425 - Income Tax Expense 290 493 696 838 1'805 2'459 282 802 1'548 1'460 1'000 Income Before XO Items 584 846 1'857 2'278 4'972 5'276 -555 2'504 5'234 4'186 2'143 - Extraordinary Loss Net of Tax 0 0 0 -74 -993 0 0 -147 2'145 560 0 - Minority Interests -8 -16 -21 -3 -24 -51 -106 51 -209 22 -27 Diluted EPS Before XO Items Net Income Adjusted* 592 862 1'878 2'281 4'996 5'327 4'279 2'651 5'442 4'164 3'119 3'071 3'269 3'610 EPS Adjusted 1.83 1.96 2.21 Dividends Per Share 1.50 1.66 1.41 Payout Ratio % 24.6 33.6 16.4 12.3 7.7 14.9 48.2 20.7 0.82 0.85 0.64 Total Shares Outstanding Diluted Shares Outstanding EBITDA 1'215 2'029 3'528 3'912 7'888 8'296 5'788 4'352 7'370 7'240 4'932 5'202 5'487 5'983 *Net income excludes extraordinary gains and losses and one-time charges. Q.M.S Advisors | tel: +41 (0)78 922 08 77 | e-mail: info@qmsadv.com |
- 5. Company Analysis - Financials II/IV Periodicity: 12/02 12/03 12/04 12/05 12/06 12/07 12/08 12/09 12/10 12/11 12/12 12/13E 12/14E 12/15E Balance Sheet Total Current Assets 3265.99906 3701.64305 3967 5553 5205 12510 7059 8408 12974 6569 6814 + Cash & Near Cash Items 262 958 1'346 922 2'178 4'008 1'995 3'632 5'405 1'627 1'037 + Short Term Investments 94 136 + Accounts & Notes Receivable 212 361 290 278 534 661 278 683 995 970 697 + Inventories 1'826 1'503 1'442 1'301 1'471 2'108 1'959 1'990 2'246 2'623 3'197 + Other Current Assets 873 744 889 3'052 1'022 5'733 2'827 2'103 4'328 1'349 1'883 Total Long-Term Assets 6'424 7'633 9'665 9'177 11'074 23'186 13'764 14'352 10'935 12'343 14'160 + Long Term Investments 104 163 1'407 690 2'615 2'982 523 Gross Fixed Assets 6'731 8'190 9'276 8'985 10'892 19'432 18'071 18'548 19'730 19'477 23'100 Accumulated Depreciation 415 920 1'424 1'840 2'758 4'451 7'334 7'531 10'577 9'892 11'173 + Net Fixed Assets 6'315 7'270 7'852 7'145 8'134 14'981 10'737 11'017 9'153 9'585 11'927 + Other Long Term Assets 4 199 406 1'342 325 5'223 2'504 3'335 1'782 2'758 2'233 Total Current Liabilities 1'468 1'638 1'383 1'594 1'251 6'434 2'126 4'112 2'697 3'830 3'969 + Accounts Payable 211 156 151 170 191 352 281 243 374 346 449 + Short Term Borrowings 453 267 552 357 158 3'973 872 2'986 1'256 2'754 2'526 + Other Short Term Liabilities 804 1'215 680 1'067 902 2'109 973 883 1'067 730 994 Total Long Term Liabilities 956 1'088 1'606 1'739 1'892 7'441 6'912 3'893 3'238 3'860 4'065 + Long Term Borrowings 146 182 657 635 632 4'103 5'568 2'378 1'575 2'401 2'497 + Other Long Term Borrowings 810 906 949 1'104 1'260 3'338 1'344 1'515 1'663 1'459 1'568 Total Liabilities 2'425 2'726 2'989 3'333 3'143 13'875 9'038 8'005 5'935 7'690 8'034 + Long Preferred Equity 0 0 0 0 0 0 0 0 0 0 0 + Minority Interest 101 346 366 334 319 2'318 1'054 1'080 598 120 109 + Share Capital & APIC 688 751 792 9 619 1'398 1'398 1'398 1'519 1'519 1'519 + Retained Earnings & Other Equity 6'476 7'511 9'485 11'054 12'198 18'105 9'333 12'277 15'857 9'583 11'312 Total Shareholders Equity 7'265 8'609 10'643 11'397 13'136 21'821 11'785 14'755 17'974 11'222 12'940 Total Liabilities & Equity 9'690 11'335 13'632 14'730 16'279 35'696 20'823 22'760 23'909 18'912 20'974 Book Value Per Share 8.78 8.90 9.41 Tangible Book Value Per Share Q.M.S Advisors | tel: +41 (0)78 922 08 77 | e-mail: info@qmsadv.com |
- 6. Company Analysis - Financials III/IV Periodicity: 12/02 12/03 12/04 12/05 12/06 12/07 12/08 12/09 12/10 12/11 12/12 12/13E 12/14E 12/15E Cash Flows Net Income 592 862 1'878 2'355 5'989 5'327 -449 2'600 3'298 3'604 2'170 2'763 2'984 3'419 + Depreciation & Amortization 423 451 540 578 586 937 1'303 817 803 762 789 + Other Non-Cash Adjustments -276 133 -3'412 -3'913 -655 1'026 -309 586 1'826 996 1'071 + Changes in Non-Cash Capital -127 208 3'498 3'974 -273 75 370 -560 -410 -658 -595 Cash From Operating Activities 611 1'655 2'504 2'994 5'647 7'365 915 3'443 5'517 4'704 3'435 + Disposal of Fixed Assets 4 21 57 38 46 88 88 38 33 23 10 + Capital Expenditures -353 -440 -618 -773 -743 -1'140 -2'360 -1'061 -1'728 -2'201 -2'692 -2'441 -2'324 -2'216 + Increase in Investments -40 -142 0 0 + Decrease in Investments 191 5 0 0 + Other Investing Activities -271 -60 -1'467 -720 1'075 -11'732 2'730 513 249 300 -233 Cash From Investing Activities -470 -617 -2'028 -1'455 378 -12'784 458 -510 -1'446 -1'878 -2'915 + Dividends Paid -170 -147 -618 -201 -1'079 -849 -1'670 -1'208 -1'234 -960 + Change in Short Term Borrowings -660 -292 -36 85 -482 + Increase in Long Term Borrowings 228 175 872 112 10'183 3'723 113 628 3'694 2'478 + Decrease in Long Term Borrowings -20 -213 -197 -417 -11 -3'915 -5'240 -1'193 -3'048 -1'351 -2'666 + Increase in Capital Stocks 0 0 0 0 1'705 1'246 0 + Decrease in Capital Stocks 0 0 0 -1'457 -999 -29 -8'995 0 + Other Financing Activities -109 16 47 -64 -2'198 1'838 -2'617 -78 -111 36 38 Cash From Financing Activities -731 -461 68 -1'942 -4'769 7'257 -5'804 -1'187 -2'034 -6'604 -1'110 Net Changes in Cash -590 577 544 -403 1'256 1'838 -4'431 1'746 2'037 -3'778 -590 Free Cash Flow (CFO-CAPEX) 258 1'214 1'886 2'221 4'904 6'225 -1'445 2'382 3'789 2'503 743 Free Cash Flow To Firm 331 1'239 1'935 2'282 4'953 6'419 2'479 3'856 2'581 908 Free Cash Flow To Equity -190 905 2'582 2'039 4'457 12'581 -2'874 1'340 1'402 4'869 565 Free Cash Flow per Share Q.M.S Advisors | tel: +41 (0)78 922 08 77 | e-mail: info@qmsadv.com |
- 7. Company Analysis - Financials IV/IV Periodicity: 12/02 12/03 12/04 12/05 12/06 12/07 12/08 12/09 12/10 12/11 12/12 12/13E 12/14E 12/15E Ratio Analysis Valuation Ratios Price Earnings 8.8x 8.2x 7.3x EV to EBIT 7.7x 3.8x 8.4x 6.5x 5.1x 8.0x EV to EBITDA 6.8x 3.0x 6.8x 5.8x 4.6x 6.8x Price to Sales 2.2x 2.2x 2.0x Price to Book 1.8x 1.8x 1.7x Dividend Yield 9.3% 10.3% 8.8% Profitability Ratios Gross Margin 43.4% 44.8% 54.8% 58.2% 72.7% 65.6% 45.5% 51.1% 61.8% 59.0% 49.1% 48.1% 48.3% 46.2% EBITDA Margin 38.8% 39.0% 50.2% 54.6% 68.3% 48.5% 41.4% 50.9% 57.7% 51.3% 40.9% 42.3% 42.8% 43.2% Operating Margin 25.3% 30.3% 42.5% 46.5% 63.2% 43.0% 32.1% 41.4% 51.4% 45.9% 34.3% 35.9% 35.2% 35.2% Profit Margin 18.9% 16.6% 26.7% 32.8% 51.9% 31.1% -3.2% 30.4% 25.8% 25.5% 18.0% 25.0% 25.5% 26.1% Return on Assets 6.1% 8.2% 15.0% 16.6% 38.6% 20.5% -1.6% 11.9% 14.1% 16.8% 10.9% 17.5% 15.5% 18.8% Return on Equity 8.9% 11.2% 20.3% 22.1% 50.2% 33.0% -3.0% 21.3% 21.2% 25.3% 18.1% 21.5% 22.8% 23.4% Leverage & Coverage Ratios Current Ratio 2.22 2.26 2.87 3.48 4.16 1.94 3.32 2.04 4.81 1.72 1.72 Quick Ratio 0.39 0.89 1.18 0.75 2.17 0.73 1.07 1.05 2.37 0.68 0.44 Interest Coverage Ratio (EBIT/I) 7.27 39.40 43.94 40.17 108.99 25.91 11.30 27.62 75.48 61.70 17.12 Tot Debt/Capital 0.08 0.05 0.10 0.08 0.06 0.27 0.35 0.27 0.14 0.31 0.28 Tot Debt/Equity 0.08 0.05 0.11 0.09 0.06 0.37 0.55 0.36 0.16 0.46 0.39 Others Asset Turnover 0.32 0.50 0.56 0.51 0.74 0.66 0.49 0.39 0.55 0.66 0.60 Accounts Receivable Turnover 14.07 18.41 21.62 25.24 28.45 28.65 29.78 17.78 15.23 14.37 14.48 Accounts Payable Turnover 6.63 13.05 20.31 17.78 18.44 24.01 23.62 16.06 16.66 17.14 16.90 Inventory Turnover 0.95 1.72 2.16 2.18 2.28 3.29 3.75 2.12 2.31 2.38 2.11 Effective Tax Rate 33.1% 36.8% 27.3% 26.9% 26.6% 31.8% 24.3% 22.8% 25.9% 31.8% Q.M.S Advisors | tel: +41 (0)78 922 08 77 | e-mail: info@qmsadv.com |
- 8. Company Analysis - Peers Comparision MMC NORILSK POLYUS GOLD IMPALA TECK RESOURCES- EVRAZ PLC BHP BILLITON LTD UNITED CO RUSAL XSTRATA PLC ANGLO AMER PLC LONMIN PLC MAGNITOGORSK SEVERSTAL NLMK OAO MECHEL RIO TINTO LTD ADR OJSC PLATINUM B Latest Fiscal Year: 12/2012 12/2012 06/2012 12/2012 12/2012 12/2012 12/2012 09/2012 12/2012 12/2012 06/2012 12/2012 12/2012 12/2012 12/2012 52-Week High 20.44 384.30 39.34 5.70 1'310.00 1'201.00 2'440.00 568.60 12.70 470.00 17'600.00 69.86 264.00 39.90 72.30 52-Week High Date 25.01.2013 30.04.2012 20.02.2013 26.04.2012 01.02.2013 01.02.2013 02.05.2012 02.05.2012 02.05.2012 14.09.2012 15.01.2013 17.09.2012 27.04.2012 10.01.2013 14.02.2013 52-Week Low 13.96 151.10 30.09 3.81 787.60 760.47 1'540.00 226.96 6.70 233.00 10'845.00 45.51 111.30 24.10 48.37 52-Week Low Date 01.06.2012 18.04.2013 12.07.2012 02.04.2013 27.11.2012 27.06.2012 18.04.2013 09.11.2012 15.04.2013 17.04.2013 15.04.2013 04.04.2013 23.04.2013 23.04.2013 30.08.2012 Daily Volume 3'278'994 3'241'562 16'783'219 4'595'000 15'793 4'406'533 3'018'744 1'024'259 11'494'300 1'967'720 1'045'689 4'623'300 693'255 9'034'012 6'203'716 Current Price (4/dd/yy) 16.05 166.30 31.70 3.94 918.00 989.80 1'616.50 267.60 7.20 255.80 12'014.00 54.09 119.70 25.60 54.68 52-Week High % Change -21.5% -56.7% -19.4% -30.9% -29.9% -17.6% -33.8% -52.9% -43.3% -45.6% -31.7% -22.6% -54.7% -35.8% -24.4% 52-Week Low % Change 15.0% 10.1% 5.4% 3.4% 16.6% 30.2% 5.0% 17.9% 7.5% 9.8% 10.8% 18.9% 7.5% 6.2% 13.0% Total Common Shares (M) - 1'339.9 5'297.6 15'193.0 3'032.2 3'002.7 1'391.0 381.8 11'006.0 837.7 615.8 5'993.2 416.3 582.3 1'847.0 Market Capitalization 27'631 2'449 158'638 59'860 174'996 29'721 22'529 1'521 80'455 214'288 75'954 324'174 49'828 14'926 86'882 Total Debt 5'023.0 8'169.0 28'330.0 11'334.0 348.3 17'067.0 16'760.0 736.0 3'867.0 5'709.5 3'609.0 4'631.7 9'870.1 7'195.0 26'819.0 Preferred Stock - - - - - - - - - - - - 25.3 - - Minority Interest 109.0 200.0 1'215.0 - 282.6 2'339.0 6'130.0 257.0 155.0 20.8 2'307.0 (32.9) 362.3 176.0 11'156.0 Cash and Equivalents 1'037.0 1'320.0 4'781.0 490.0 1'038.3 1'983.0 9'094.0 315.0 424.0 1'750.1 1'193.0 1'058.2 295.0 3'267.0 7'320.0 Enterprise Value - 10'788 194'666 18'554 5'152 62'800 48'193 3'001 6'154 10'788 80'872 13'839 11'546 19'514 119'939 Valuation Total Revenue LFY 12'065.0 14'726.0 72'226.0 10'891.0 2'848.1 31'618.0 28'761.0 1'614.0 9'328.0 14'103.7 27'593.0 12'156.6 11'274.9 10'343.0 50'967.0 LTM 12'065.0 14'726.0 66'950.0 10'891.0 2'028.1 31'618.0 28'761.0 1'614.0 9'328.0 14'103.7 27'342.0 12'156.6 11'274.9 10'126.0 50'967.0 CY+1 12'301.2 14'735.6 67'569.0 11'064.4 - 33'840.4 34'519.9 1'621.9 9'462.2 14'606.9 32'481.6 12'518.1 11'482.4 9'828.8 55'585.9 CY+2 12'832.7 15'475.0 73'914.3 11'619.3 - 35'525.1 36'176.5 1'995.0 10'023.3 15'369.4 37'931.1 13'450.3 11'466.8 10'752.2 61'445.4 EV/Total Revenue LFY 2.8x 0.9x 3.3x 1.9x 4.1x 2.2x 2.0x 1.6x 0.8x 1.0x 3.9x 1.3x 1.1x 2.1x 3.1x LTM 2.8x 0.9x 3.5x 1.9x 6.7x 2.2x 2.0x 1.6x 0.8x 1.0x 3.9x 1.3x 1.1x 2.1x 3.1x CY+1 2.5x 0.7x 2.9x 1.6x - 1.8x 1.5x 1.5x 0.6x 0.7x 2.5x 1.1x 1.0x 2.0x 2.2x CY+2 2.5x 0.7x 2.6x 1.5x - 1.7x 1.4x 1.2x 0.6x 0.7x 2.2x 1.0x 1.0x 1.8x 1.9x EBITDA LFY 4'932.0 1'599.0 33'421.0 1'223.0 1'426.1 8'122.0 7'682.0 776.0 1'218.0 2'127.4 7'300.0 1'900.5 462.4 3'736.0 15'486.0 LTM 4'932.0 1'599.0 27'133.0 1'223.0 673.9 8'122.0 7'682.0 776.0 1'218.0 2'127.4 5'736.0 1'900.5 462.4 3'508.0 15'486.0 CY+1 5'201.9 2'102.6 28'726.6 1'221.2 - 9'266.4 9'657.0 182.5 1'317.7 2'252.8 6'759.4 2'044.6 1'538.3 3'245.5 21'006.8 CY+2 5'487.1 2'415.1 33'552.1 1'417.8 - 10'563.3 10'177.3 418.0 1'485.8 2'403.5 8'936.5 2'322.0 1'510.4 3'945.0 23'251.3 EV/EBITDA LFY 6.8x 7.9x 7.1x 16.7x 8.2x 8.5x 7.4x 3.2x 6.1x 6.7x 14.6x 8.2x 27.6x 5.7x 10.2x LTM 6.8x 7.9x 8.7x 16.7x 17.4x 8.5x 7.4x 3.2x 6.1x 6.7x 18.6x 8.2x 27.6x 6.0x 10.2x CY+1 6.0x 5.0x 6.7x 14.8x - 6.7x 5.3x 13.1x 4.6x 4.8x 12.0x 6.7x 7.4x 6.1x 5.7x CY+2 5.8x 4.2x 5.7x 12.3x - 5.7x 5.1x 5.7x 3.9x 4.3x 9.2x 5.8x 7.4x 5.0x 5.0x EPS LFY - -0.36 3.61 0.02 - 1.26 2.59 0.36 - - 6.85 - - 2.59 4.06 LTM - -0.23 1.83 -0.02 2.19 0.40 -1.13 -1.08 -0.01 0.85 2.40 0.10 -3.93 2.33 -1.63 CY+1 1.83 0.16 2.53 0.06 - 1.21 2.17 0.05 0.00 1.00 5.24 0.15 (0.62) 2.14 5.72 CY+2 1.96 0.31 3.05 0.07 - 1.45 2.61 0.26 0.02 1.10 8.48 0.18 0.11 2.79 6.62 P/E LFY - - 17.9x - 13.3x 37.8x - - - 9.5x 50.1x 17.3x - 11.0x - LTM - - 11.7x - - 12.0x 9.8x 11.4x - - 50.0x - - 11.0x - CY+1 8.8x 15.9x 12.9x 9.1x - 12.4x 11.4x 90.8x 57.2x 8.2x 22.9x 11.5x - 12.0x 9.8x CY+2 8.2x 8.1x 10.7x 7.0x - 10.4x 9.5x 15.5x 12.7x 7.4x 14.2x 9.4x 33.7x 9.2x 8.5x Revenue Growth 1 Year (14.6%) (10.2%) 0.7% (11.4%) 18.5% (6.7%) (5.9%) (19.0%) 0.2% (10.8%) (16.7%) 3.6% (10.1%) (10.2%) (15.8%) 5 Year (4.4%) - 6.8% - 28.0% 3.5% 13.5% (1.6%) 2.6% 17.8% 0.9% 6.9% 9.2% 9.2% 11.2% EBITDA Growth 1 Year (31.9%) (42.8%) (12.1%) (55.7%) 38.9% (30.3%) (32.5%) 89.7% (2.7%) (40.6%) (36.9%) (15.7%) (81.2%) (30.4%) (41.1%) 5 Year (9.9%) - 8.0% (23.3%) 47.8% (5.7%) (5.8%) (2.5%) (12.0%) (10.3%) (13.0%) (11.0%) (22.8%) 5.7% 8.1% EBITDA Margin LTM 40.9% 10.9% 40.5% 11.2% 38.5% 25.7% 26.7% 48.1% 13.1% 15.1% 21.0% 15.6% 4.1% 34.6% 30.4% CY+1 42.3% 14.3% 42.5% 11.0% - 27.4% 28.0% 11.2% 13.9% 15.4% 20.8% 16.3% 13.4% 33.0% 37.8% CY+2 42.8% 15.6% 45.4% 12.2% - 29.7% 28.1% 21.0% 14.8% 15.6% 23.6% 17.3% 13.2% 36.7% 37.8% Leverage/Coverage Ratios Total Debt / Equity % 39.1% 157.9% 43.0% 103.8% 8.3% 38.4% 44.5% 29.6% 40.0% 79.4% 7.2% 41.6% 313.1% 40.4% 57.2% Total Debt / Capital % 28.0% 60.3% 29.7% 50.9% 7.2% 26.7% 27.7% 21.1% 28.3% 44.2% 6.4% 29.5% 73.6% 28.6% 31.6% Total Debt / EBITDA 1.018x 5.109x 1.308x 9.267x 0.302x 2.101x 2.182x 0.948x 3.175x 2.684x 0.720x 2.437x 21.346x 2.094x 1.732x Net Debt / EBITDA 0.808x 4.283x 1.120x 8.867x -0.446x 1.857x 0.998x 0.543x 2.827x 1.861x 0.447x 1.880x 20.708x 1.253x 1.259x EBITDA / Int. Expense 20.380x 2.479x 44.266x 1.637x 62.969x 20.458x 7.080x 17.244x 5.462x 4.825x 21.283x 27.760x 0.691x 6.026x 14.848x Credit Ratings S&P LT Credit Rating BBB- - A+ - - BBB+ *- BBB - NR BB+ - BBB- - BBB A- S&P LT Credit Rating Date 26.09.2011 - 15.11.2010 - - 29.11.2012 04.04.2013 - 20.01.2010 21.06.2012 - 23.07.2008 - 16.04.2010 18.04.2011 Moody's LT Credit Rating - - (P)A1 - - - Baa1 - - Ba1 - - - Baa2 - Moody's LT Credit Rating Date - - 15.11.2010 - - - 23.02.2009 - - 07.06.2012 - - - 17.11.2010 - Q.M.S Advisors | tel: +41 (0)78 922 08 77 | e-mail: info@qmsadv.com |