
Recomendados
Recomendados
Más contenido relacionado
La actualidad más candente
La actualidad más candente (20)
Destacado
Destacado (19)
Similar a The International Journal of Engineering and Science (The IJES)
Similar a The International Journal of Engineering and Science (The IJES) (20)
Último
Último (20)
The International Journal of Engineering and Science (The IJES)
- 1. The International Journal Of Engineering And Science (IJES) ||Volume||2 ||Issue|| 9||Pages|| 01-07||2013|| ISSN(e): 2319 – 1813 ISSN(p): 2319 – 1805 www.theijes.com The IJES Page 1 Application of Response Surface Methodology in Fermentation Process variables Optimization for the Production of L -Glutamic acid by Immobilized cells of Corynebacterium glutamicum 1 Dr.R.Srinu Venkat Rao, 2 Dr.Ch.A.I.Raju, 3 Dr.A.V.N.Swamy 1 Principal, Sreenivasa College of Engineering& Technology, Kurnool-518218, A.P., INDIA. 2 Associate Professor, Department of Chemical Engineering, AU College of Engineering, Visakhapatnam-530003, A.P., INDIA. 3 Professor, Depatment of Chemical Engineering, JNTUA College of Engineering, Anantapur-515002, A.P., INDIA ---------------------------------------------------------------ABSTRACT-------------------------------------------------------- Response Surface methodology (RSM) was employed to study the effects of the four fermentation process variables namely pH, temperature, Glucose concentration and agitation rate for the production of L-Glutamic acid by immobilization cells of Corynabacterium glutamicumATCC13032.Among eight variables four significantly effecting parameters studied by using Central Composite Design (CCD).The predicted optimal sets of conditions for the maximum percentage yield of Glutamic acid were as follows pH-5.8855,Temperature - 29.860 C,Glucose Concentration -100.91g/L and Agitation rate -160.48 rpm. The determination coefficient (R2 ) was 0.99988, which ensures adequate credibility of this model. By scaling up fermentation from flask to bioreactor, we obtained promising results. KEYWORDS: L-Glutamic acid, Immobilized cells, Central composite design (CCD), Sodium alginate, Fermentation and Corynebacterium glutamicum ATCC 13032 ---------------------------------------------------------------------------------------------------------------------------------------- Date of Submission: 16, January, 2013 Date of Acceptance: 30, September 2013 --------------------------------------------------------------------------------------------------------------------------------------- I. INTRODUCTION Amino acids are the basic biomolecules of proteins which are the most important macromolecules for the functions of human biochemical systems (Rubina .N et.al 2008) .L-Glutamic acid is one of the Non-essential amino acids which is having wide spectrum of commercial use as flavor enhancer, food additives and infusion compounds (Amin .G et.al, 1993).Physical conditions such as temperature ,pH, agitation rate or shaking speed, inoculums size and fermentation time plays an important role in the fermentation process(Rubina.N.et.al 2008). Response surface methodology is mainly based on statistical technique and it has been successfully used to optimize and model biochemical and biotechnological processes (Balusu.et.al, 2005, Zhang.j.et.al, 2007 and Bernal.C.et.al, 2006 Shih IL et.al, 2006), The application of the response surface methodology in fermentation process led to the improvement of yield of L-glutamic acid. In this experiment, statistical optimization of physical conditions was investigated for the production of L-Glutamic acid by immobilized cells of Corynebacterium glutamicum by using response surface methodology (RSM).Significant factors were optimized with central composite design .CCD is an efficient method to calculate the significance of the various conditions, interactions between fermentation parameters and optimal level for each parameter (Rubin .N et.al, 2008). Central composite design (CCD) is one of the response surface methodologies (Chakravarthi et.al, 2002) to obtain the maximum percentage yield of L-Glutamic acid. II. MATERIALS AND METHODS The organism employed throughout in this experimentation was Corynebacterium glutamicum ATCC 13032 obtained from Institute of Microbial Technology, Chandigarh (India) .The culture was maintained on the agar slants of PASB medium containing composition (g/L) of peptone- 5,Agar -20, Sodium chloride-5 and Beef extract-3.The pH of the medium adjusted to 7 and incubated at 370 C for 24 hours
- 2. Application of Response Surface Methodology in… www.theijes.com The IJES Page 2 A Completely grown slant of 24 hours old Corynebacterium glutamicum and were scrapped off and suspended in 0.01 M citrate buffer (pH-7.0). The cell suspension was shaken thoroughly to break up the cell aggregates. The cell count was determined by plating each mL of the cell suspension, on solid agar medium. The cell counts were adjusted in the range of 10-5 to 10-9 cells per mL. The cells were grown for 24 h at 30°C in 250 mL Erlenmeyer flasks containing 50 mL of inoculation medium on a rotary shaker at 160 rpm. The cells were separated from the inoculation medium by centrifugation and washed thoroughly with 0.01 M citrate buffer (pH 7.0) Fermentations conditions were maintained at Temperature - 30°C, pH-6.0, Agitation rate -160rpm, Glucose concentration-100g/L, Aeration rate -1.0 vvm Biotin Concentration -1.0g/L and Fermentation time – 96 hours. Among these parameters only significant parameters has been taken out for the optimization of the production L-Glutamic acid. Preparation of Sodium Alginate Beads The cell suspension was gradually added to the ether sterilized sodium alginate (3%w/v) and mixed thoroughly with sterile glass rod. The mixture was extruded as drops into a solution ofCaCl2 (0.5 M). Bead size was controlled by gauge number of the hypodermic needle used during extrusion. The beads were cured in the same solution at room temperature for an hour and stored in a freshly prepared 0.1 M CaCl2 solution at 4°C. Analytical Methods Estimation of reducing sugars was done by DNS method (Miller G.L, 1959). Thin layer chromatography (Silica gel G, solvent mixture: n-butanol: glacial acetic acid: water in a ratio 4:1:1 v/v) was used for the qualitative estimation of L-glutamic acid (Miller G.L, 1959) and it was determined quantitatively using a ninhydrin color reaction (Spies J.R, 1957). III. RESULTS AND DICISCUSSIONS Optimization for immobilized cells using Response Surface Methodology (RSM) In the present study, the levels of four process independent variables (pH, Temperature, Agitation rate and glucose concentration) are analyzed using Central Composite Design (CCD) for % yield of Glutamic acid using immobilized cells are shown in table -3.1 Table 3.1: Levels of different process variables in coded and un-coded form for % yield of Glutamic acid using immobilized cells The parameters that have greater influence over the response are to be identified so as to find the optimum condition for the production of glutamic acid. For optimization, the regression equation is obtained by using STATISTICA Software 6.0 version. The percentage yield of glutamic acid (Y) is function of pH (X1), Temperature (X2), Agitation rate (X3) and Glucose concentration (X4). The multiple regression analysis of the experimental data has yield the following equation: Y = –6.42604 + 0.70325 X1 + 0.22663 X2 + 0.00335 X3 + 0.02127 X4 – 0.05929 X1 2 –0.00380 X2 2 – 0.00001 X3 2 – 0.00010 X4 2 + 0.00000 X1X2 + 0.00001 X1X3 – 0.00006 X1X4 – 0.00000 X2X3 + 0.00001 X2X4 – 0.00000 X3X4 ----- (3.1) Table-3.2 represents the results obtained in CCD. The response obtained in the form of analysis of variance (ANOVA) from regression eq.3.1 is put together in table–3.3. Fischer‟s „F-statistics‟ value is defined as MSmodel/MSerror, where MS is mean square. Fischer‟s „F-statistics‟ value, having a low probability „p‟ value, indicates high significance. Variable Name Range and levels -2 -1 0 1 2 X1 pH 5 5.5 6 6.5 7 X2 Temperature, o C 26 28 30 32 34 X3 Agitation rate, rpm 80 120 160 200 240 X4 Glucose concentration, g/L 80 90 100 110 120
- 3. Application of Response Surface Methodology in… www.theijes.com The IJES Page 3 Table 3.2: Results from CCD for % yield of Glutamic acid by Immobilized cells Run no. X1 X1, pH X2 X2, T X3 X3, A. T. X4 X4, G. C. % yield of glutamic acid Experimental Predicted 1 -1 5.5 -1 28 -1 120 -1 90 0.3188 0.318863 2 -1 5.5 -1 28 -1 120 1 110 0.3228 0.323246 3 -1 5.5 -1 28 1 200 -1 90 0.3198 0.319946 4 -1 5.5 -1 28 1 200 1 110 0.3238 0.323629 5 -1 5.5 1 32 -1 120 -1 90 0.3148 0.314562 6 -1 5.5 1 32 -1 120 1 110 0.3192 0.319446 7 -1 5.5 1 32 1 200 -1 90 0.3150 0.315346 8 -1 5.5 1 32 1 200 1 110 0.3196 0.319529 9 1 6.5 -1 28 -1 120 -1 90 0.3056 0.306113 10 1 6.5 -1 28 -1 120 1 110 0.3098 0.309296 11 1 6.5 -1 28 1 200 -1 90 0.3082 0.307796 12 1 6.5 -1 28 1 200 1 110 0.3096 0.310279 13 1 6.5 1 32 -1 120 -1 90 0.3018 0.301813 14 1 6.5 1 32 -1 120 1 110 0.3052 0.305496 15 1 6.5 1 32 1 200 -1 90 0.3032 0.303196 16 1 6.5 1 32 1 200 1 110 0.3064 0.306179 17 -2 5.0 0 30 0 160 0 100 0.3238 0.323558 18 2 7.0 0 30 0 160 0 100 0.2975 0.297458 19 0 6.0 -2 26 0 160 0 100 0.3134 0.313158 20 0 6.0 2 34 0 160 0 100 0.3048 0.304758 21 0 6.0 0 30 -2 80 0 100 0.3030 0.302725 22 0 6.0 0 30 2 240 0 100 0.3045 0.304492 23 0 6.0 0 30 0 160 -2 80 0.3245 0.324425 24 0 6.0 0 30 0 160 2 120 0.3320 0.331792 25 0 6.0 0 30 0 160 0 100 0.3698 0.369800 26 0 6.0 0 30 0 160 0 100 0.3698 0.369800 27 0 6.0 0 30 0 160 0 100 0.3698 0.369800 28 0 6.0 0 30 0 160 0 100 0.3698 0.369800 29 0 6.0 0 30 0 160 0 100 0.3698 0.369800 30 0 6.0 0 30 0 160 0 100 0.3698 0.369800 Experimental conditions [Coded Values] and observed response values of central composite design with 24 factorial runs, 6- central points and 8- axial points. Table 3.3: ANOVA of % yield of Glutamic acid for entire quadratic model Source of variation SS df Mean square(MS) F-value P > F Model 0.017492 14 0.0012494 1.07130669 0.00000 Error 0.000002 15 0.001166266 Total 0.017494 Df- degree of freedom; SS- sum of squares; F- factor F; P- probability. R2 =0.99988; R2 (adj):0.99978
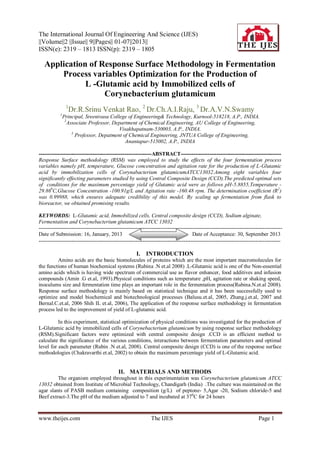
- 4. Application of Response Surface Methodology in… www.theijes.com The IJES Page 4 Table 3.4: Estimated regression coefficients for % yield of Glutamic acid Terms Regression coefficient Standard error of the coefficient t-value P-value Mean/Interc. -6.42604 0.033923 -189.430 0.000000 (1)pH (L) 0.70325 0.004774 147.323 0.000000 pH (Q) -0.05929 0.000280 -211.677 0.000000 (2)Tempertaure, o C (L) 0.22663 0.001285 176.372 0.000000 Tempertaure, o C (Q) -0.00380 0.000018 -217.211 0.000000 (3)Agitation Rate, rpm (L) 0.00335 0.000052 64.860 0.000000 Agitation Rate, rpm (Q) -0.00001 0.000000 -236.311 0.000000 (4)Glucose Concentration, g/L (L) 0.02127 0.000228 93.255 0.000000 Glucose Concentration, g/L( Q) -0.00010 0.000001 -148.843 0.000000 1L by 2L 0.00000 0.000092 0.000 1.000000a 1L by 3L 0.00001 0.000005 1.636 0.122639a 1L by 4L -0.00006 0.000018 -3.272 0.005145 2L by 3L -0.00000 0.000001 -0.818 0.426154a 2L by 4L 0.00001 0.000005 1.363 0.192885a 3L by 4L -0.00000 0.000000 -1.909 0.075624 a insignificant (P ≥ 0.05) The ANOVA of the regression model is sufficiently great, as proven from the Fisher‟s F-test (Fmodel = 1.07130669) and has a very low probability value (Pmodel > F=0.000000). Besides, the computed F-value [F0.05 (14.15) = MSmodel/MSerror = 1.07130669] is almost near when compared to F-value (F0.05 (14.15) tabulars = 2.42) at 5% level, suggesting that the treatment differences are sufficiently great. Student‟s t-test can implicate regression coefficient of the parameter. It is noted from table-3.4 that more significant corresponding coefficient term can be possessed by having high „t‟ value and low „P‟ value. By analyzing „t‟ and „p‟ values from table-5.7, X1, X2, X3, X4, X1 2 , X2 2 , X3 2 , X4 2 , X3X4 and X1X4, have high importance to explain the individual and interaction effects of independent variables on biosorption of cobalt to anticipate the response. Rest of the terms (X1X2, X1X3 ,X2X3, X2X4)are undistinguished in eq.3.1 and are not needed to explain production of glutamic acid. The model is reduced to the following form by excluding undistinguished terms in eq.3.1. Y = –6.42604 + 0.70325 X1 + 0.22663 X2 + 0.00335 X3 + 0.02127 X4 – 0.05929 X1 2 –0.00380 X2 2 – 0.00001 X3 2 – 0.00010 X4 2 – 0.00006 X1X4 – 0.00000 X3X4 ------- (3.2) A positive sign of the coefficient represents an interactive effect i.e., response (% yield of glutamic acid) steps up with increase in effect, whereas a negative sign implies an incompatible effect that means response lowers with an increase in effect. Measure of the model‟s variability to the responses indicated is presented by correlation coefficient (R2 ). As R2 ––> 1, model is inviolable and the response is estimated better. In our study, R2 = 0.99988 suggests that 0.012 % of the total variations are not adequately explained by the model. Statistical relevance of the ratio of mean due to regression and mean square due to residual error is tested with the help of ANOVA. F-values implicate that % yield of glutamic acid can be sufficiently explained by the model equation. If „P’ value is lower than 0.05, the model is considered to be statistically significant at the 95 % confidence level. All the linear and square terms of all variables (P < 0.05) are in good agreement (table 3.4) in comparison to the interaction terms X1X2 = 1.00000, X1X3 = 0.122639, X2X3 = 0.426154 and X2X4 = 0.192885. Interpretation of residual graphs: Normal probability plot (NPP) is a graphical technique used for analyzing whether or not a data set is normally distributed to greater extent. The difference between the observed and predicted values from the regression is termed as residual. Fig. 3.1 exhibits normal probability plot for the present data. It is evident that the experimental data are reasonably aligned implying normal distribution.
- 5. Application of Response Surface Methodology in… www.theijes.com The IJES Page 5 Fig. 3.1 Normal probability plot for % yield of glutamic acid Interaction effects of variables Three-dimensional view of response surface contour plots [Fig. 3.2 (a) to 3.2 (f)] exhibit % yield of glutamic acid using immobilized cells for different combinations of dependent variables. All the plots are delineated as a function of two factors at a time, imposing other factors fixed at zero level. It is evident from response surface contour plots that the % yield of glutamic acid is minimal at low and high levels of the variables. This behavior conforms that there is a presence of optimum for the input variables in order to maximize % yield. The role played by all the variables is so vital in % yield of glutamic acid and seen clearly from the plots. The predicted optimal sets of conditions for maximum % yield of glutamic acid are: pH = 5.8895 Temperature = 29.8626 o C Agitation rate = 160.4807 rpm Glucose Concentration = 100.9101 g/L % Yield of glutamic acid = 0.3706795 The experimental optimum values are compared in table-3.5. The experimental values are in close agreement with those from CCD. Table 3.5: Comparison between optimum values from Experimentation and CCD Variable Experimental CCD pH 6 5.8895 Temperature, o C 30 29.8626 Agitation rate, rpm 160 160.4807 Glucose Concentration, g/L 100 100.9101 % Yield of glutamic acid 0.3513 0.3706795
- 6. Application of Response Surface Methodology in… www.theijes.com The IJES Page 6 Fig. 3.2 (a) Surface contour plot for the effects of pH and temperature on % yield of glutamic acid Fig. 3.2 (b) Surface contour plot for the effects of pH and agitation rate on % yield of glutamic acid Fig. 3.2 (c) Surface contour plot for the effects of pH and glucose concentration on % yield of glutamicacid Fig. 3.2(d) Surface contour plot for the effects of temperature and agitation rate on % yield of glutamic acid
- 7. Application of Response Surface Methodology in… www.theijes.com The IJES Page 7 Fig. 3.2 (e) Surface contour plot for the effects of temperature and glucose concentration on % yield of glutamic acid Fig. 3.2 (f) Surface contour plot for the effects of agitation rate and glucose concentration on % yield of glutamic acid IV. CONCLUSIONS RSM was performed to optimize the fermentation parameters for the L-Glutamic acid production by immobilized cells of Corynebacterium glutamicum ATCC 13032. A significant quadratic polynomial obtained by the central composite design (CCD) was very useful in determining the optimum parameters that have significant effects on L-Glutamic acid production. Under optimal conditions, the percentage of L-Glutamic acid produced was 0.3706 .Results of this study clearly indicate that optimization by CCD approach is an effective way of optimizing the L-Glutamic acid production REFERENCES [1]. Amin, G., A.F. Shahaby and Khalaf Allah, (1993). Glutamic acid by product synthesis by immobilised cells of the bacterium Corynebacterium glutamicum. Biotechnol. Lett., 15; 1129-1132. [2]. Balusu R, Paduru RR, Kuravi SK, Seenayya G, Reddy G. (2005) Optimization of critical medium components using response surface methodology for ethanol production from cellulosic biomass by Clostridium thermocellum SS19. Process Biochem. 40:3025-3030. [3]. Bernal C, Diaz I, Coello N. (2006) Response surface methodology for the optimization of keratinase production in culture medium containing feathers produced by Kocuria rosea. CanadianJ Microbiol. 52: 445-450 [4]. Chakravarti, R., Sahai, V., 2002. Optimization of compactinproductioninchemically defined production medium byPenicillium citrinum using statistical methods. Process Biochem., 38(4):481-486. [5]. Miller, G.L. (1959) Use of dinitro salicyclic acid reagent for determination of reducing sugars. Anal. Chem., 31: 426-428. [6]. Rubina N, Quartulain Syed and Muhammad Nadeem (2008) “Statistical optimization of process variables foe L-lysine production by Corynebacterium glutamicum”. Turkish Journal of biochemistry 33 (2); 50-57 [7]. Shih IL, Shen MH. (2006) Application of response surface methodology to optimize production of poly-ε-lysine by Streptomycesalbulus IFO 14147. Enzyme Microbial Technol. 39: 15-21 [8]. Spies, J.R. (1957) Colorimetric procedures for amino acid. Methods Enzyme,3:468-471 [9]. Zhang J, Gao N. (2007) Application of response surface methodology in medium optimization for pyruvic acid production of Torulopsis glabrata TP19 in batch fermentation. J Zhejiang UniSci. 8: 98-104