
Recomendados
Más contenido relacionado
Similar a Correlation between brightness of light and photosynthesis lab
Similar a Correlation between brightness of light and photosynthesis lab (17)
Más de 14382
Último
Último (20)
Correlation between brightness of light and photosynthesis lab
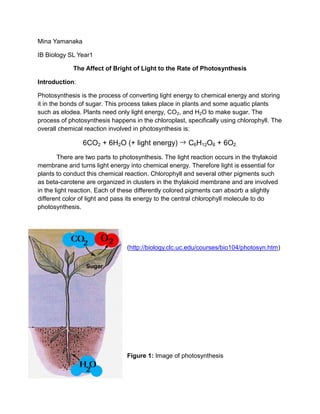
- 1. Mina Yamanaka IB Biology SL Year1 The Affect of Bright of Light to the Rate of Photosynthesis Introduction: Photosynthesis is the process of converting light energy to chemical energy and storing it in the bonds of sugar. This process takes place in plants and some aquatic plants such as elodea. Plants need only light energy, CO2, and H2O to make sugar. The process of photosynthesis happens in the chloroplast, specifically using chlorophyll. The overall chemical reaction involved in photosynthesis is: 6CO2 + 6H2O (+ light energy) C6H12O6 + 6O2. There are two parts to photosynthesis. The light reaction occurs in the thylakoid membrane and turns light energy into chemical energy. Therefore light is essential for plants to conduct this chemical reaction. Chlorophyll and several other pigments such as beta-carotene are organized in clusters in the thylakoid membrane and are involved in the light reaction. Each of these differently colored pigments can absorb a slightly different color of light and pass its energy to the central chlorophyll molecule to do photosynthesis. (http://biology.clc.uc.edu/courses/bio104/photosyn.htm) Figure 1: Image of photosynthesis
- 2. DESIGN Research question: What is the relationship between the rate of photosynthesis of an aquatic plant and the amount of light given to it? Hypothesis: If the amount of light given to the elodea plant is increased, then the rate of photosynthesis will be accelerated and vice versa. Variables: Variable Type How Brightness of light Independent Distance of lamp closer/farther to the plant Rate of photosynthesis Dependent Counting the number of bubbles created within a given time 0.25% sodium hydrogen Controlled Add exactly the same carbonate solution amount of substance in the (concentration) same amount of water 0.25% sodium hydrogen Controlled Pour the same amount of carbonate solution water into the test tube (Amount) Time Controlled Five minutes for each trial Temperature Controlled Maintained at the same temperature through trials Surrounding condition Controlled Dark room Materials: - 1000ml Beaker - Stirring rod - Test tube - Thermometer - Two Elodea plants taken from the same - Timer piece - Knife - Lamp - Ruler - Sodium bicarbonate - Electronic balance - Masking Tape - Graduated cylinder Figure 2: experimental set up Procedure:
- 3. 1. Prepare 0.25% sodium hydrogen carbonate solution by mixing 0.25g of baking soda weighed by electronic balance and 100ml water measured by graduated cylinder. 2. Take a big piece of elodea plant from the fish tank. Get two branches similar in appearance from the piece. 3. Set the lamp, light on 4. Fill the 1000ml beaker with tap water and also put the thermometer in. Place it in front of the lamp. 5. Set the timer to 5 minutes. 6. Slightly cut the end of the elodea by a knife.Place it in the test tube and cover them completely with the baking soda solution. Put the test tubein the 1000ml beaker. 7. Immediately start the timer. Observe and record the number of oxygen bubbles that Elodea generates in five minutes. 8. Place the beaker further and mark the location with masking tape. Repeat steps 4 through 7. 9. Record all data, 3 trials for each 3different distance. DATA COLLECTION Table 1: Number of bubblesvs Distance of Elodea form the Light bulb Number of bubbles in 5 minutes Trials Distance from the light bulb (cm) 1st 2nd 3rd Average 10 209 125 80 138 24.5 23 16 46 28.3 36.5 5 8 2 5 Table 1: As shown in the table above, the more number of bubbles are observed when the plant is exposed to a brighter light. Sample calculation: In order to calculate average number of oxygen bubbles generated within five minutes, add all trials and divide it by the number of trials which in this case is 3: = = 138 Table 2: Qualitative Observation of the Oxygen Bubbles
- 4. Oxygen Bubbles from Elodea plant Distance from Interval of bubbles generated Size of the bubbles the light bulb 10cm Short; constant and very Tiny bubbles rapidly generated 24.5cm Longer; constant but slowly Medium sized bubbles generated 36.5cm Very long; bubbles generated Medium sized bubbles very slowly Table 2: the table above indicates the fact that the quality of bubbles varies when generated under different brightness of the light. Table 3: Rate of Photosynthesis vs Brightness of the Light by Distance Number of bubbles per second Trials Distance from the light bulb (cm) 1st 2nd 3rd Average Uncertainty 10 0.70 0.41 0.30 0.46 ±0.2 24.5 0.08 0.05 0.15 0.09 ±0.05 36.5 0.02 0.03 0.01 0.02 ±0.01 Table 3: the table above shows the data in table 1 converted into the rate of photosynthesis by calculation. The number of uncertainty of distance 10cm being too big is noticeable. Sample calculation In order to calculate the rate of photosynthesis per second, the number of oxygen bubbles isdivided by the time took to get that number of bubbles in seconds Rate of photosynthesis = number of oxygen bubbles = 138 = 0.46 bubbles / sec Time in seconds 300 Sample calculation
- 5. For it is inevitable for the values of bubbles counted to have some errors, uncertainty needs to be calculated. The uncertainty can be calculated by this formula = = 0.2 Graph 1: Rate of Photosynthesis vs Distance of the Light bulb from the Plant Figure 3: the graph above clearly displays that the rate of photosynthesis declines, as the elodea plant gets further away to the lamp. In other word, the rate oh photosynthesis declines as the brightness given to the plant is decreased. Evaluation
- 6. Weakness point What How to improve Temperature The target temperature could Use Temperature controlled bath not be maintained at all time Bubbles The size of the bubbles Repeat the trialover and over until the same generated were not always the size of bubbles show up same Elodea Fatigue of the elodea plant Conduct the lab not in row but give a certain might have caused inaccuracy amount of break to the plants of the data Observation Some bubbles might have Person timing should be more concentrating missed during the counting on it and let the other person be responsible process for counting the bubbles Conclusion: The experiment has verified the hypothesis, “If the amount of light given to the elodea plant is increased, then the rate of photosynthesis will be increased and vice versa”. According to figure 3, it is obvious that the rate of photosynthesis increased as the distance between the elodea plant and the lamp was closer together, which is the same as the brighter the light is given to the plant, the bigger the rate of photosynthesis becomes.This is because the light energy is directly used when the plant is converting the carbon dioxide and water into sugar, so the more intense the brightness of the light helps to go through the chemical process rapidly and efficiently, andthe reverse is also true. Through this investigation, I realized the importance of the existence of plants in the environment. The plants play a vital role of the cycle of gas in the atmosphere by generating oxygen into the air and consuming the carbon dioxide that are in the air. If there were no plant on the earth, organisms would die from the lack of oxygen and choke them to death. We should work harder on preserving the existing plants as well as increasing the number of plants so that there will always be plenty of oxygen to breathe in!