
Recomendados
Más contenido relacionado
La actualidad más candente
La actualidad más candente (20)
Destacado
Destacado (11)
Similar a Stock Chart (CCI indicator)
Similar a Stock Chart (CCI indicator) (20)
Último
Último (20)
Stock Chart (CCI indicator)
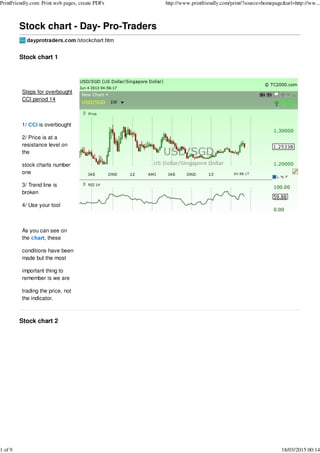
- 1. Stock chart - Day- Pro-Traders Stock chart 1 Steps for overbought CCI period 14 1/ is overbought 2/ Price is at a resistance level on the stock charts number one 3/ Trend line is broken 4/ Use your tool As you can see on the , these conditions have been made but the most important thing to remember is we are trading the price, not the indicator. Stock chart 2 PrintFriendly.com: Print web pages, create PDFs http://www.printfriendly.com/print/?source=homepage&url=http://ww... 1 of 9 18/03/2015 00:14
- 2. Double top is a validation of a resistance level. The price was rejected twice at the same level. A strong bearish signal after the validation is a gift. Use your tool to enter the trade like a pro. If you are selling, pay attention to the nearest support level. As the price is falling, it is seeking a better support level. Manage the trade carefully and do not allow and a winning trade, to turn into a losing one. Notice the first support level (yellow horizontal line) on the second stock chart Stock chart 3 Notice on the stock chart number three, the period 14 is overbought, but the price is rising. Overbought does not mean sell. The market can remain overbought for a long period. Learn to trade the CCI flawlessly. CCI is often overbought during the first and the third Elliott wave. Many traders do miss the trend because they are trading indicators instead of trading the individual financial instrument. To achieve consistent winning trade, one must first recognize his or her common trading mistakes and seek to avoid them. This is the first step to avoid losing consistently. Stock chart 4 PrintFriendly.com: Print web pages, create PDFs http://www.printfriendly.com/print/?source=homepage&url=http://ww... 2 of 9 18/03/2015 00:14
- 3. Notice the ABCD chart on the stock chart number four. CCI 14 was oversold the first time at B. Price starts going up. Watch out for resistance levels whenever you are buying. Cautious traders always take profit at resistance levels if they BUY or they will move their stop loss to secure their profit. Do the same. At C, a strong signal was activated. Price starts going down for the second time and reaches D. In theory, AB = CD. Note that the theory is not always the reality of the messy market. Price went down first, with a strong bearish momentum. Notice that it stopped at a support level. The BC is a rally in a downtrend. The downtrend was not finished and this was confirmed when the price broke below B. First white line highlights AB. Second white indicates CD. You may share this page on Tweeter or Facebook and etc.. Stock chart 5 PrintFriendly.com: Print web pages, create PDFs http://www.printfriendly.com/print/?source=homepage&url=http://ww... 3 of 9 18/03/2015 00:14
- 4. Notice the surge in the bullish momentum as the 14 reaches the overbought zone on the stock chart number five. Did you recognize that sharp peak? It is bullish. Now price displayed a higher low and turned around. This is an invitation to BUY. Smart traders responded even though the CCI indicator is already in the overbought zone. Notice they all respected the nearest resistance level and took profit. In an uptrend the price will exhibit higher lows and higher highs, until it fails to display a new higher high and the trend line is broken. The music has changed. Do check the higher time frame to confirm the validity of the resistance level. It is the same story over and over. Keep your eyes wide open and be patient. No rush, stay calm. Feel free to share this page on Twitter or Facebook Stock chart 6 PrintFriendly.com: Print web pages, create PDFs http://www.printfriendly.com/print/?source=homepage&url=http://ww... 4 of 9 18/03/2015 00:14
- 5. This is stock 6. Notice how the price was consolidating but was displaying higher lows at the same time. When the price is consolidating, it is called a balanced market or low volatility period. A consolidation that leads to a break out to the up side or to an uptrend is an accumulation zone. Smart money was busy buying during the accumulation period. On the other hand a distribution takes place during a consolidation period that leads to a break down or to a downtrend. Institution were quietly selling when the price was oscillating between two levels. One defined resistance level and one defined support level. Do not try to predict the direction of the trend. Be patient. The price will first break above the range but will drop to retest it. Remember this: 1/ Break....Retest....Turn around Stock chart 7 PrintFriendly.com: Print web pages, create PDFs http://www.printfriendly.com/print/?source=homepage&url=http://ww... 5 of 9 18/03/2015 00:14
- 6. Markets move in five waves plus abc corrective waves. Understanding and mastering the Elliott wave theory is essential. One can not avoid the subject of wave principle. This is the heart beat of the market. Whether, one is using or any other indicator, it is crucial to grasp the Elliott wave theory. For more about Elliott wave, please visit www.24elliottwaves.com. Notice on stock chart 7, the CCI 14 was overbought at the end of the fifth wave. Notice the bearish divergence. In theory, the market is considered overbought at the end of the fifth wave in an uptrend and oversold at the end of the fifth wave in a downtrend. One will always wait for a strong confirmation before selling or buying. Trading is not gambling and gambling is not trading. Wait for a clear cut valid signal without cutting corners. Stock chart 8 PrintFriendly.com: Print web pages, create PDFs http://www.printfriendly.com/print/?source=homepage&url=http://ww... 6 of 9 18/03/2015 00:14
- 7. The price does not always trend. Traders can easily swing trade during consolidation times. Understanding the market patterns (not price patterns) will assist traders in adopting the most suitable trading strategies. Oscillators such as , CCI, give excellent signals in consolidation periods. Be aware that the price does not consolidate forever. It is important to manage the trade carefully. Always use stop loss and apply the five per cent money management rules. Though, this is a low volatility period, it is possible to see few volatile days as the price quickly move from one level to the next defined level. The movement between these two levels can be fast sometimes. The price does not have to reach the next level. Do not assume anything. Keep your eyes on the ball (the price). Do not forget the median line of the horizontal channel. Stock chart 9 PrintFriendly.com: Print web pages, create PDFs http://www.printfriendly.com/print/?source=homepage&url=http://ww... 7 of 9 18/03/2015 00:14
- 8. CCI 14 reaches the overbought region for the first time (notice the yellow vertical line). Now draw your horizontal warning line (white line on the ). Priority is for buying above the horizontal line and selling below it. There is no need to guess it or force your intention on the price. Just keep your eyes on it and use your trading tools (TSTW24, TSTW SYS 08 or TSTW SYS 008). Note that the price broke above the line for one day and retest it the second day. Do not trade like old fashion traders by jumping into quick conclusions. However, on the third day, you want to watch it because it can fly away. And it did. If you miss it, do not cry or call your mother. Stay calm. It came back again to retest it before going up. As always watch the resistance levels when you are buying and pay attention to the support levels when you are selling. Price can change direction at these levels. Bank your profit or move your stop loss to secure your profit. It is your profit, do not allow anybody to take it from you. Trading with charts for absolute returns Stock chart 10 PrintFriendly.com: Print web pages, create PDFs http://www.printfriendly.com/print/?source=homepage&url=http://ww... 8 of 9 18/03/2015 00:14
- 9. The madness of trading the indicators is visible on this chart. Notice the red days. Some traders were selling instead of buying. If one wants to sell in an up trend, one has to day trade carefully. One does not want to sell in a bullish zone. The trend line in not broken. When the is above 100, the bullish momentum is strong. That is the theory. A strong bullish momentum leads to resistances, trend lines or channels being broken to the up side. One should also recall the definition of an uptrend. Higher lows and higher highs. SOMETIMES THE PRICE CAN SUDDEN FALL WITHOUT PRIOR WARNING. These are sharp corrections. They usually take place at major resistance levels at the end of the fifth Elliott wave. They are also the consequence of previous markets' manipulations and distortions. Please take time to master Elliott wave at www.24elliottwaves.com Click on the chart to open a CCI page. PrintFriendly.com: Print web pages, create PDFs http://www.printfriendly.com/print/?source=homepage&url=http://ww... 9 of 9 18/03/2015 00:14