

Recomendados
Recomendados
Más contenido relacionado
La actualidad más candente
La actualidad más candente (17)
Destacado
Destacado (20)
Similar a Home sales increased last year january 2012
Similar a Home sales increased last year january 2012 (20)
Más de Matt Collinge
Más de Matt Collinge (16)
Home sales increased last year january 2012
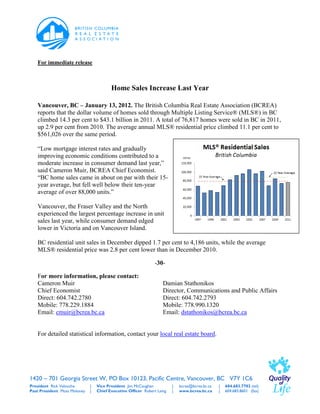
- 1. For immediate release Home Sales Increase Last Year Vancouver, BC – January 13, 2012. The British Columbia Real Estate Association (BCREA) reports that the dollar volume of homes sold through Multiple Listing Service® (MLS®) in BC climbed 14.3 per cent to $43.1 billion in 2011. A total of 76,817 homes were sold in BC in 2011, up 2.9 per cent from 2010. The average annual MLS® residential price climbed 11.1 per cent to $561,026 over the same period. “Low mortgage interest rates and gradually improving economic conditions contributed to a moderate increase in consumer demand last year,” said Cameron Muir, BCREA Chief Economist. “BC home sales came in about on par with their 15- year average, but fell well below their ten-year average of over 88,000 units.” Vancouver, the Fraser Valley and the North experienced the largest percentage increase in unit sales last year, while consumer demand edged lower in Victoria and on Vancouver Island. BC residential unit sales in December dipped 1.7 per cent to 4,186 units, while the average MLS® residential price was 2.8 per cent lower than in December 2010. -30- For more information, please contact: Cameron Muir Damian Stathonikos Chief Economist Director, Communications and Public Affairs Direct: 604.742.2780 Direct: 604.742.2793 Mobile: 778.229.1884 Mobile: 778.990.1320 Email: cmuir@bcrea.bc.ca Email: dstathonikos@bcrea.bc.ca For detailed statistical information, contact your local real estate board. 1420 – 701 Georgia Street W, PO Box 10123, Pacific Centre, Vancouver, BC V7Y 1C6 President Rick Valouche | Vice President Jim McCaughan | bcrea@bcrea.bc.ca | 604.683.7702 (tel) Past President Moss Moloney | Chief Executive Officer Robert Laing | www.bcrea.bc.ca | 604.683.8601 (fax)
- 2. Home Sales Increase Last Year . . . Page 2 December 2011 Residential Average Price, Active Listings and Sales-to-Active-Listings Data by Board Average Price Active Listings Sales-to-Active-Listings December 2011 December 2010 December 2011 December 2010 December 2011 December 2010 Board % Residential Residential Residential Residential Residential Residential % change Sales to Active Sales to Active Average Price Average Price Active Listings Active Listings change Listings Listings ($) ($) (Units) (Units) (%) (%) BC Northern 204,911 192,971 6.2 1,893 2,258 -16.2 11.1 8.2 Chilliwack 281,485 264,266 6.5 1,330 1,179 12.8 9.0 10.2 Fraser Valley 498,989 444,258 12.3 5,958 6,479 -8.0 13.7 12.7 Greater Vancouver 689,057 700,773 -1.7 12,082 10,739 12.5 14.1 18.1 Kamloops 293,282 288,009 1.8 1,614 1,414 14.1 6.4 6.9 Kootenay 285,725 256,013 11.6 3,386 2,362 43.4 6.4 3.9 Okanagan 392,450 393,512 -0.3 4,605 4,667 -1.3 5.6 4.8 Mainline Powell River 205,906 275,732 -25.3 186 179 3.9 8.6 6.1 South Okanagan 280,599 282,308 -0.6 1,528 1,567 -2.5 5.4 2.7 Northern Lights 288,015 175,403 64.2 199 202 -1.5 16.6 18.8 Vancouver Island 315,536 318,537 -0.9 4,495 4,298 4.6 6.9 8.3 Victoria 469,484 496,814 -5.5 2,901 2,441 18.8 11.1 13.3 Provincial 509,570 523,990 -2.8 40,177 37,785 6.3 10.4 11.3 Totals* *Numbers may not add due to rounding December 2011 BC Residential Multiple Listing Service® Data by Board Dollar Volume (000s) Units December 2011 December 2010 December 2011 December 2010 Board Residential Sales Residential Sales % change Residential Sales Residential Sales % change ($) ($) (Units) (Units) BC Northern 43,031 35,700 20.5 210 185 13.5 Chilliwack 33,778 31,712 6.5 120 120 0.0 Fraser Valley 407,175 366,069 11.2 816 824 -1.0 Greater Vancouver 1,171,397 1,361,601 -14.0 1,700 1,943 -12.5 Kamloops 30,208 28,225 7.0 103 98 5.1 Kootenay 62,002 23,809 160.4 217 93 133.3 Okanagan Mainline 100,860 88,147 14.4 257 224 14.7 Powell River 3,295 3,033 8.6 16 11 45.5 South Okanagan 23,290 12,139 91.9 83 43 93.0 Northern Lights 9,505 6,665 42.6 33 38 -13.2 Vancouver Island 97,816 113,081 -13.5 310 355 -12.7 Victoria 150,704 160,968 -6.4 321 324 -0.9 Provincial Totals* 2,133,061 2,231,148 -4.4 4,186 4,258 -1.7 * Numbers may not add due to rounding **NOTE: The Northern Lights Real Estate Board (NLREB) became part of the South Okanagan Real Estate Board (SOREB) on January 1, 2011. 1420 – 701 Georgia Street W, PO Box 10123, Pacific Centre, Vancouver, BC V7Y 1C6 President Rick Valouche | Vice President Jim McCaughan | bcrea@bcrea.bc.ca | 604.683.7702 (tel) Past President Moss Moloney | Chief Executive Officer Robert Laing | www.bcrea.bc.ca | 604.683.8601 (fax)
- 3. Home Sales Increase Last Year . . . Page 3 December 2011 Year-to-Date BC Residential Multiple Listing Service® Data by Board Dollar Volume (000s) Unit Sales Average Price Board % % % 2011 2010 2011 2010 change 2011 2010 change change ($) ($) ($) ($) BC Northern 852,364 775,307 9.9 3,891 3,676 5.8 219,061 210,911 3.9 Chilliwack 600,808 622,151 -3.4 2,025 2,046 -1.0 296,695 304,081 -2.4 Fraser Valley 7,401,232 6,306,709 17.4 14,727 13,977 5.4 502,562 451,221 11.4 Greater Vancouver 25,681,188 21,048,756 22.0 32,936 31,144 5.8 779,730 675,853 15.4 Kamloops 625,800 644,426 -2.9 2,077 2,121 -2.1 301,300 303,831 -0.8 Kootenay 557,911 546,078 2.2 2,049 1,995 2.7 272,285 273,723 -0.5 Okanagan Mainline 1,834,991 1,908,501 -3.9 4,831 4,838 -0.1 379,837 394,481 -3.7 Powell River 69,856 64,278 8.7 313 270 15.9 223,183 238,067 -6.3 South Okanagan 405,980 430,560 -5.7 1,317 1,346 -2.2 308,261 319,881 -3.6 Northern Lights 110,616 104,423 5.9 511 509 0.4 216,470 205,154 5.5 Vancouver Island 2,078,910 2,142,695 -3.0 6,367 6,549 -2.8 326,513 327,179 -0.2 Victoria 2,876,688 3,112,634 -7.6 5,773 6,169 -6.4 498,300 504,561 -1.2 Provincial Totals* 43,096,345 37,706,516 14.3 76,817 74,640 2.9 561,026 505,178 11.1 * Numbers may not add due to rounding BCREA represents 11 member real estate boards and their approximately 18,000 REALTORS® on all provincial issues, providing an extensive communications network, standard forms, economic research and analysis, government relations, applied practice courses and continuing professional education (cpe). To demonstrate the profession’s commitment to improving Quality of Life in BC communities, BCREA supports policies that encourage economic vitality, provide housing opportunities, respect the environment and build communities with good schools and safe neighbourhoods. For detailed statistical information, contact your local real estate board. MLS® is a cooperative marketing system used only by Canada’s real estate boards to ensure maximum exposure of properties listed for sale. 1420 – 701 Georgia Street W, PO Box 10123, Pacific Centre, Vancouver, BC V7Y 1C6 President Rick Valouche | Vice President Jim McCaughan | bcrea@bcrea.bc.ca | 604.683.7702 (tel) Past President Moss Moloney | Chief Executive Officer Robert Laing | www.bcrea.bc.ca | 604.683.8601 (fax)