BUDGETING AND FINANCIAL MANAGEMENT
Public budgeting and financial management are concerned with allocating limited resources to problems that governments and other public organizations face. Just as you establish a personal budget to track your income and expenses and, just as businesses create budgets to aid in decisions affecting profits and losses, so do public organizations employ budgets to help in planning and management. Public organizations must carefully and responsibly manage large amounts of money and other resources—taking in taxes and other revenues, purchasing goods and services, investing surplus funds, and managing debt wisely.
From the point of view of the manager or citizen trying to influence public policy, the budget is an extremely important tool for planning and control. To manage public programs effectively, you must be able to manage resources, both practically and politically. In this chapter we focus on the budget process from the standpoint of the individual public manager, examining how budget decisions are made and how you can influence budgetary outcomes. Although much of the budget process is highly charged politically, specific technical knowledge about budgeting systems will give you a distinct advantage.
The elaborate systems that public organizations have developed to manage their fiscal affairs are relatively recent. Prior to 1900, revenues were easily sufficient to cover the expenses of government, and financial management was merely record keeping. As the scope of government grew and new demands were placed on its resources, the need for more sophisticated systems of decision making became apparent. Moreover, repeated instances of corruption and waste made more effective control over the public's resources necessary.
In establishing its executive budget process through the Budgeting and Accounting Act of 1921, the federal government followed the lead of several local and state governments that had already taken similar actions. This municipal reform movement emphasized the budget process as a means of bringing order to public spending; consequently, by the 1920s, most big cities had established a formal budget process. Similar developments were also occurring at the state level. In 1910, Ohio became the first state to require an executive budget; within the next decade, similar actions took place in most other states. At the federal level, a special Commission on Economy and Efficiency, known as the Taft Commission, recommended establishing an executive budget in 1912; the recommendation was implemented nearly a decade later.
Since the 1920s, the federal budget has grown in both size and complexity, as have budgets at the state and local levels. This growth means that budgeting and financial management have come to involve far more than keeping a record of income and expenses. Today, how government spends its money affects many other areas of the economy; consequently, the budget is an instrument of fisc ...
Micro-Scholarship, What it is, How can it help me.pdf
BUDGETING AND FINANCIAL MANAGEMENTPublic budgeting and financi.docx
1. BUDGETING AND FINANCIAL MANAGEMENT
Public budgeting and financial management are concerned with
allocating limited resources to problems that governments and
other public organizations face. Just as you establish a personal
budget to track your income and expenses and, just as
businesses create budgets to aid in decisions affecting profits
and losses, so do public organizations employ budgets to help in
planning and management. Public organizations must carefully
and responsibly manage large amounts of money and other
resources—taking in taxes and other revenues, purchasing goods
and services, investing surplus funds, and managing debt
wisely.
From the point of view of the manager or citizen trying to
influence public policy, the budget is an extremely important
tool for planning and control. To manage public programs
effectively, you must be able to manage resources, both
practically and politically. In this chapter we focus on the
budget process from the standpoint of the individual public
manager, examining how budget decisions are made and how
you can influence budgetary outcomes. Although much of the
budget process is highly charged politically, specific technical
knowledge about budgeting systems will give you a distinct
advantage.
The elaborate systems that public organizations have developed
to manage their fiscal affairs are relatively recent. Prior to
1900, revenues were easily sufficient to cover the expenses of
government, and financial management was merely record
keeping. As the scope of government grew and new demands
were placed on its resources, the need for more sophisticated
systems of decision making became apparent. Moreover,
repeated instances of corruption and waste made more effective
control over the public's resources necessary.
In establishing its executive budget process through the
2. Budgeting and Accounting Act of 1921, the federal government
followed the lead of several local and state governments that
had already taken similar actions. This municipal reform
movement emphasized the budget process as a means of
bringing order to public spending; consequently, by the 1920s,
most big cities had established a formal budget process. Similar
developments were also occurring at the state level. In 1910,
Ohio became the first state to require an executive budget;
within the next decade, similar actions took place in most other
states. At the federal level, a special Commission on Economy
and Efficiency, known as the Taft Commission, recommended
establishing an executive budget in 1912; the recommendation
was implemented nearly a decade later.
Since the 1920s, the federal budget has grown in both size and
complexity, as have budgets at the state and local levels. This
growth means that budgeting and financial management have
come to involve far more than keeping a record of income and
expenses. Today, how government spends its money affects
many other areas of the economy; consequently, the budget is
an instrument of fiscal policy. Moreover, the budget is a
primary expression of government priorities; it constitutes a
record of the decisions that are made concerning various public
policies.
Networking
General information on budgeting and financial management
can be found at www.gasb.org and at www.nasbo.org.
The Budget as an Instrument of Fiscal Policy
Budgets express the public policy choices of governments and
others. Among these are choices with respect to the impact of
the public sector on the economy. Fiscal policy is concerned
with the impact of government taxation and spending on the
economy generally. Before the Great Depression, little attention
was paid to how the federal budget affected the economy, which
was presumably regulated by the business cycle. Periods of
economic growth featuring inflation and high employment were
followed by periods of recession or depression featuring
3. deflation and unemployment. Meanwhile, the federal
government sought to balance its budget each year—that is, to
make revenues and expenditures approximately equal.
Economists soon began to realize, however, that this pattern of
government spending was influencing the economy in a negative
way. In periods of economic growth, government revenues
naturally increased. In an effort to balance the budget, taxes
could be lowered to the level of expenditures; in periods of
economic decline, the budget was balanced by lowering
spending to meet the lower revenues. The unanticipated result
was to increase citizens' income during good times and decrease
their income in bad times—just the opposite of what would be
desirable. Government taxation and spending had the effect of
accentuating economic instability.
Economists such as the British scholar John Maynard Keynes
argued, in contrast, that all else being equal, positive
government action could lead to greater economic stability. A
key to Keynes's analysis was the relationship between inflation
and unemployment. Keynes noted that periods of rapid
economic growth are typically accompanied by high inflation,
which is harmful to individuals because it lowers their
purchasing power, especially if they are on fixed incomes. On
the other hand, periods of economic decline are typically
accompanied by high unemployment, which not only hurts
individuals but also lowers revenues for government. In either
case, government action aimed at achieving greater stability
might be both possible and desirable.
There are many ways the federal government can influence the
economy, but one important way is simply by varying its own
spending or, somewhat more indirectly, by raising or lowering
taxes. The capacity of government spending patterns to
influence the economy so dramatically is not hard to understand
if you recognize the enormous role of government in the
economy. The gross domestic product (GDP), the rate of
inflation, and the rate of unemployment are the key indicators
of economic health. Gross domestic product, a measure of total
4. economic output, is measured by the market value of goods and
services. Almost three-quarters of our current GDP is private in
nature, but about one-quarter (about 24.7 percent in 2010) is
based on government spending. Based on revenues, the U.S.
federal government is the single largest organization in the
world, almost 10 times the size of Walmart, Exxon, or Chevron
(top three in the Fortune 500). Obviously, decisions at the
federal level play an important role in the health and stability of
the economy generally.
The key relationships are these: (1) If the economy is
experiencing rapid growth—with high inflation and low
unemployment—the government might seek to “cool off” the
economy by taking money out of the economy through lowering
spending, raising taxes, or both. This limits private demand and
slows economic growth. On the other hand, (2) if the economy
is experiencing recession or depression—with falling prices and
high unemployment—the government might want to stimulate
the economy by putting more money into circulation, through
increasing spending, lowering taxes, or both. This stimulates
private demand and increases economic growth. Creating a
surplus, as might occur in the first case, would help restrain
private spending during prosperity; creating a deficit, as might
occur in the second case, might stimulate spending during a
recession.
Cumulative state and local spending also affects the economy.
State and local government expenditures constitute close to 12
percent of the GDP and must be taken into account in
discussions of fiscal policy. If the federal government cuts
taxes, but also cuts aid to states and localities, those
governments may find it necessary to raise taxes themselves,
thus offsetting any economic gains caused by lower federal
taxes.
Patterns of spending in many states and in major cities do have
some effect on the local economy, and consequently, state and
local officials are becoming more cognizant of their role in
fiscal policy and especially economic development. These
5. governments, however, often don't have the tools or authority to
make certain kinds of decisions. For example, all the states
except Vermont have either constitutional or statutory
provisions requiring a balanced budget. (Various political
leaders, especially Republicans in Congress, have recently
called for a balanced budget amendment at the federal level as a
way to eliminate deficit spending; however, at this point, no
legislation has passed.) Such a proposal, though attractive in a
symbolic sense, would limit the flexibility of the federal
government in seeking to influence the economy. In any case, it
is clear that the budget process has important effects on the
economy that must be anticipated when structuring overall
patterns of public spending.
The Budget as an Instrument of Public Policy
Although the overall pattern of spending represented in a
government budget has an important effect on the economy,
individual entries in the budget represent important choices
with respect to public policies of all types. The budget is,
essentially, a measure of support (or lack of support) for
specific programs. Those in favor are funded; those out of favor
are not. For this reason, discussions of budgetary priorities are
of special importance to political leaders, government officials
at all levels, and representatives of various interests in society.
As a manager, you will need to understand both where the
money comes from and where the money goes.
Where the Money Comes From
Governments obtain funds either from their own sources or
through transfers from other governments to operate programs
deemed important. There are a variety of ways governments can
raise their own revenues, including levying taxes and charging
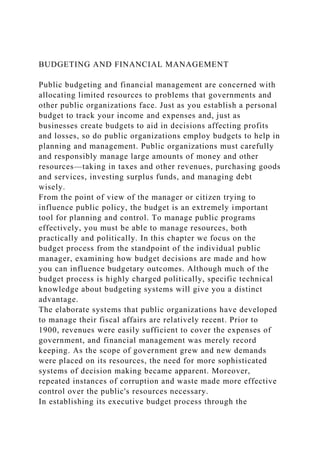
individuals or groups for specific services (see Figure 5.1).
Because all public programs are affected by the way
governments raise revenues, and because revenue administration
is itself an important part of public administration, you will find
it helpful to understand the way taxes are structured.
6. Developing tax policies requires attention not only to the level
of taxes being taken from individuals or groups, but also to the
fairness, efficiency, and simplicity of the tax system. Everyone
agrees that the tax system should be fair and that everyone
should pay his or her “fair share.” But what exactly does that
mean? Some argue that people should pay according to the
benefits they receive; others argue that those who have a greater
ability to pay should in fact pay more.
FIGURE 5.1
The Federal Government Receipts: Fiscal Year 2011
SOURCE: Analytical Perspectives, Budget of the US
Government, FY 2013 (Table 15.1 Receipts by Source—
Summary, p. 187), retrieved March 19, 2012,
from www.whitehouse.gov/sites/default/files/omb/budget/fy201
3/assets/receipts.pdf.
One way to approach the issue is to think in terms of the
relationship between one's tax rate and one's income (vertical-
equity concept). A tax structure is proportional (or “flat”) if it
taxes everyone at the same effective tax rate. If an effective tax
rate is applied to a $20,000 income (yielding $2,000) and the
same rate is applied to a $200,000 income (yielding $20,000),
even though the amounts differ, the tax is proportional to the
amount of income. A tax is progressive if it taxes those with
higher income at a higher effective tax rate. Income tax is often
cited as progressive. For example, a person with a $20,000
income and tax rate of 10 percent will pay $2,000 in taxes;
another individual with a $200,000 income might be taxed at 10
percent for the first $20,000 (yielding $2,000), 20 percent for
the next $80,000 (yielding $16,000), and 50 percent for the
remaining $100,000 of income (yielding $50,000). The total tax
paid on $200,000 will be $68,000, or an effective rate of 34
percent. Finally, a tax is regressive (such as sales taxes) if it
taxes those with lower incomes at a proportionally higher
7. effective rate than those with higher incomes. For example, if
an individual with a $20,000 income buys a car and pays $500
in taxes, then the effective tax rate for this individual relative to
his income is 2.5 percent. If another individual with a $200,000
income buys the same car and pays $500 in taxes, then the
effective tax rate for that individual relative to his income is
0.25 percent.
Individual Income Tax All methods of taxation involve
application of a tax rate to a particular tax base; the product of
these yields tax revenue. The individual income tax is the single
most important tax in our country. It calls for individuals to add
up all income from taxable sources, reduce that amount by
certain deductions or exemptions, and then apply a tax rate to
that base to arrive at the individual's income tax. The current
federal income tax, for example, applies rates between 10 and
35 percent to six income brackets.
All advanced industrial nations use some form of income tax. In
the United States, income tax is the primary source of revenue
for the federal government and is used to a lesser extent in
many states and some cities. In most cases, a higher rate is
applied to higher incomes, making the income tax a progressive
tax. For nearly thirty years after its passage in 1913, the federal
income tax applied only to a fairly small number of high-income
people. With the advent of World War II, deductions were
reduced significantly and higher rates applied.
Managing the task of collecting income tax from everyone in
the country is obviously difficult. Yet the Internal Revenue
Service (IRS) has developed a relatively efficient mechanism
for collection and does so at a cost of about one-half of 1
percent of the revenues produced. Key to the existing system is
the requirement that each individual calculate his or her own tax
liability. IRS auditors then select a few returns for closer
inspection, concentrating on those with unusual features. The
extent of compliance with tax regulations in this country,
though far from complete, is considered comparatively high.
Corporation Income Tax The corporation income tax, also a
8. progressive tax, actually predates the individual income tax by
several years and, for most of the last century, was a key source
of federal revenue. Its proponents justify it as a way of taxing
capital accumulation that is not specifically distributed to
individuals. Moreover, the corporation income tax is needed to
support the individual income tax; without it, individuals could
simply keep their income in corporations and avoid paying
income taxes. Though most states have corporation income
taxes, the tax is far more substantial at the federal level,
currently at 35 percent, though there are many proposals to
reduce the corporate tax in return for closing loopholes in the
tax. Yet, even before these proposals, corporation income tax
has been declining in contrast to other sources of revenue.
Where it once yielded more revenue than the individual income
tax, the corporation income tax has declined to only about one-
tenth of federal revenues.
Payroll Taxes Taxes on payrolls support a variety of Social
Security and other social insurance programs, such as
unemployment compensation and medical care for the aged. (Do
not confuse these specific taxes with the general income taxes
that may be deducted from a payroll check.) These programs are
primarily financed by taxes paid either by the employer or by
the employer and employee in equal amounts. Payroll taxes
overall are regressive because there is a flat rate, with no
deductions or exemptions, and maximum amounts above which
taxes are not required. Payroll taxes at the federal level, which
support social insurance, now constitute the second largest
source of federal revenue.
Sales and Excise Taxes Both sales and excise taxes are applied
to goods and services. Sales taxes are applied to a broad range
of goods and services at either retail or wholesale levels and are
a popular source of income at state and local levels. There are
significant variations in sales tax rates and in items covered by
sales taxes—for example, some jurisdictions exempt food,
clothing, and medicine from sales tax. Excise taxes are applied
to the sale of specific commodities such as gasoline, tobacco, or
9. alcohol; they are the primary form of consumption tax at the
federal level. Typically, excise taxes are applied at specific
rates (such as two cents per gallon of gasoline), but they may be
applied to the total sales price. Some excise taxes are, in effect,
user charges that help support particular activities. Gasoline
taxes, for instance, are typically used to support highway
construction and maintenance. A major issue concerning sales
and excise taxes is that of equity. Because the poor consume a
greater portion of their income than the rich, the burden of
consumption taxes tends to fall more heavily on the poor, so the
taxes are regressive. These taxes also tend to penalize certain
groups, such as those with large families or those just starting a
household. On the other hand, these taxes tend to provide more
stable revenues, something that is especially important at state
and local levels.
Property Taxes Taxes on personal property are widely used at
the local level and provide about half of local government
revenues. Administration of a property tax involves assessment
of an individual's property, most often land and buildings, and
then the application of a tax rate. About half the revenue
generated by the property tax derives from residential property
and half from businesses. Although the property tax is a
proportional tax, it is progressive in its effect (those who spend
more on housing pay more), administration is difficult and has
often not been highly professional. Moreover, recent tax
limitations have severely restricted the capacity of local
governments to raise additional revenue through the property
tax.
Other Revenue Sources There are, of course, a variety of other
sources of government revenues. Whereas public organizations
have often charged fees for the use of specific government
services, recent limitations on other tax revenues have made
such charges increasingly attractive, especially at the local
level. For example, fees for the use of parks and recreational
facilities are becoming increasingly important. Another recent
development in terms of revenues at the state level is the use of
10. lotteries. Nearly half the states and several local governments
now conduct lotteries, which provide a highly visible, but
relatively small and unstable, source of funds. Lotteries are also
highly regressive in their effect (because poorer citizens tend to
play the lotteries more); indeed, they are more regressive than
even the sales tax.
Nonprofit organizations, which lack the power to tax, derive
revenues from quite different sources and, indeed, engage in a
wide variety of efforts to support their programs. Obviously,
membership organizations depend in large measure on member
dues for revenue, but such organizations, along with many
others, have recently sought to diversify revenues. Although
grant funding remains an important source of revenue for many
nonprofit organizations, recent reductions in federal social
service programs have seriously limited grant opportunities for
many nonprofits. Additional sources of funds include donations
(from individuals, corporations, and foundations), sales of
goods and services (from books to coffee cups), and joint
enterprises involving commercial firms (such as insurance plans
or “affinity” credit cards).
Networking
For the budget of the United States, and how to get to the
budgets of other governments, see the Department of the
Treasury at www.ustreas.gov. For details on the current fiscal
year federal budget and access to historical budget data, go
to www.gpoaccess.gov/usbudget/index.html.
Where the Money Goes
While government revenue figures are staggering, they hardly
match up to the demands on governments at all levels. There
simply isn't enough money to meet every need or cure every
problem, even if money alone were the solution. Instead,
difficult choices must be made each year about which programs
will be funded and at what levels. The choices made through the
public policy process are reflected in the government's budget.
The budget, therefore, stands as a record of the government's
11. priorities.
What Would You Do?
You are the director of motor vehicle registration for your state.
Your agency, with offices scattered across the state, is
responsible for registration and licensing of cars, trucks, and
other motor vehicles. About six months into the fiscal year, the
governor announces that all state agencies will have to finish
the fiscal year with expenditures 5 percent less than originally
budgeted. You have already spent half your yearly budget
allocation, so the reduction means you actually have to cut
spending by 10 percent over the next six months. What would
you do?
But government priorities are always shifting. As new
conditions arise, new programs are proposed and old programs
are expanded or contracted. The emphasis the federal
government gives to various areas sometimes has reflected the
condition of the country and the world, as in the large
percentage of national resources devoted to national defense
during periods of international conflict.
We can also trace budgetary changes over shorter time spans to
see the policy priorities of various presidents, governors,
mayors, or other public officials. Restrictions, however, have
been built into the federal budget over the years that somewhat
limit the choices any president or Congress can make. For
example, Congress has passed a variety of entitlement
programs that provide specified benefits to those who meet
certain eligibility requirements. For example, legislation might
provide benefits to people above a certain age or below a
certain income level. The implication, supported by several
judicial rulings, is that individuals are entitled to or have a right
to certain benefits (primarily social welfare benefits).
For these programs, Congress essentially agrees to provide
whatever money is necessary from year to year to ensure a
certain level of benefits to all eligible people. Legislation is
typically written so that new action is not required each year to
keep the program going. Only a projection of likely
12. beneficiaries is needed to determine the level of expenditures
for a given year. Unless Congress takes specific steps to limit
benefits or eligibility—something that legislators are reluctant
to do—funding of these programs is practically automatic.
These programs vary in size over time. In a recession, for
example, unemployment would be high, and spending for
unemployment compensation would rise. Similarly, the
changing character of the population—for example, a larger
number of older Americans—would also change the amount of
money required to provide benefits to that group. Moreover,
most entitlement programs have now been indexed to the cost of
living (or related measures) so that benefit levels automatically
rise with inflation. (Over the past decade, Congress has passed
major expansions of indexing in Social Security and Medicare.)
Expenditures for entitlement programs thus increase almost
every year. The Congressional Budget Office (CBO) projects
that under current law, federal spending on Medicare and
Medicaid measured as a share of GDP will rise from 4 percent
in 2007 to 12 percent in 2050 and 19 percent in 2082—which,
as a share of the economy, is roughly equivalent to the total
amount that the federal government spends today (CBO, 2007).
Such programs constituted just over 50 percent of the proposed
fiscal year 2013 federal budget, with Social Security amounting
to 20 percent of the entire budget. When they are combined with
farm price supports (also indexed), interest on the national debt
(which must be paid), and expenditures based on previous
commitments, these so-called uncontrollable
expenditures constitute almost two-thirds of the federal budget.
The remainder of the federal budget might be
termed discretionary spending; meaning the president and
Congress are open to make changes in this relatively small
portion of the budget. This includes defense spending (about 18
percent) and domestic discretionary spending (only about 19
percent). These are the areas that generate the most difficult
policy choices.
From Deficits to Surplus and Back
13. A great deal of political debate in the 1980s and early 1990s
centered on strategies for controlling the federal deficit.
However, by 2000, a booming economy and fiscal measures
taken by Congress in the late 1990s changed the debate from
how to control the deficit to ways to spend a growing budget
surplus. To understand this change in fortune, it may be helpful
to examine some of the deficit reduction methods employed by
the federal government during the past decades.
Let's begin with the deficit. As noted, traditional economic
theory does not necessarily disapprove of public borrowing;
indeed, there may be benefits to deficit spending in particular
years. But at some point, a growing deficit becomes
unmanageable, especially as interest payments become a
substantial part of government spending. Large deficits are
generally thought to limit both short-term and long-term
economic recovery, especially because they limit private
investment. Moreover, large deficits contribute to an
understandable lack of public confidence concerning their
political leaders' ability to deal effectively with the budget.
The budget deficits of the Reagan years were substantial. The
administration's accumulated debt exceeded that of all previous
administrations combined. By 1984 it became clear that if no
further actions were taken to reduce the deficit, by the end of
the Reagan years, the accumulated deficit would total over $2.6
trillion. Interest payments alone would require one out of every
six federal dollars. Facing this prospect, Congress passed the
Gramm-Rudman-Hollings Act of 1985. Under this legislation,
deficit targets were set for each of the next five budget years
and aimed at reducing the deficit to zero in 1990 (though a later
amendment pushed the target to 1992). Unfortunately, the
president and Congress were overly optimistic in their economic
projections and employed several questionable budget
techniques to evade the restraints set by Gramm-Rudman-
Hollings.
With the deficit still out of control in 1990, President Bush and
14. Congress faced very difficult budget deliberations. For the 1990
budget, the Gramm-Rudman-Hollings law had targeted an
annual deficit of no more than $110 billion. By October, when
the fiscal year began, there was still no agreement on the
budget. (As we will see, it is not unusual for a federal fiscal
year to begin before the year's budget is approved.)
Consequently, automatic, across-the-board spending cuts were
applied to all federal agencies.
Finally, in late November, a deficit-reduction plan was
approved that would bring the projected deficit below the
Gramm-Rudman-Hollings target. The plan that was agreed to,
however, contained a number of provisions that appeared to be
budgetary “smoke and mirrors.” The biggest reduction item was
to simply maintain for another 130 days the across-the-board
cuts that had been imposed in October. Many observers read
this as a failure of the administration and Congress to come to
grips with the hard choices that deficit reduction requires.
As part of the budget agreement, the Budget Enforcement Act
(BEA) was passed to police the deficit even further. The BEA
set annual ceilings on several categories of discretionary
spending, with violation of the caps requiring across-the-board
cuts. BEA also required that legislative actions affecting
mandatory spending not increase the deficit in any year. (This is
known as the “pay as you go” provision.) Though these
provisions seem to have had the desired effect on the budget
process, the deficit continued to grow, driven in part by
incorrect economic assumptions and in part by increased
spending for healthcare programs and the savings and loan
bailout.
Networking
Check out the National Debt Clock
at www.brillig.com/debt_clock and the Department of the
Treasury's FAQs about the budget
at http://www.treasury.gov/Pages/default.aspx.
In 1997, the Clinton administration led a bipartisan effort in
Congress to pass yet another landmark piece of legislation
15. aimed at balancing the federal budget. The budget agreement
was originally scheduled to eliminate the deficit by 2002,
phasing in $121 billion in spending cuts over a five-year period.
Much of the savings were planned to come from reductions in
Medicare payments to health providers and hospitals. An
additional $55 billion was to have been saved each year through
mandates imposed on future spending bills. The budget
agreement also featured $95 billion in tax cuts over the five
years, including credits for higher education, relief for families
with children, and reductions in capital gains.
When President Clinton signed the measure into law, few would
have imagined that in less than three years the Congressional
Budget Office would be projecting a budget surplus. But the
federal government turned the tide, thanks to a variety of
factors—including old-fashioned good luck. One of the most
significant contributors to the government's change in fortune
came in the “dot-com” craze of 1999–2000, as thousands of
Internet companies went public on the stock market, leading to
a dramatic increase in tax revenues and an overall expansion in
the American economy. Reductions in military spending in the
wake of the cold war also helped, as the government was able to
invest its resources in more productive areas (Uchitelle, 2000,
p. A1). The net outcome was a projected surplus of $81 billion,
scheduled to materialize during the next decade. This is a far
cry from the crisis years of the early 1980s.
The Bush Tax Plan President George W. Bush seized upon the
opportunity afforded by this emerging surplus to advance one of
the key themes in his election platform: a reduction in federal
taxes. Given the estimates early in the year from both the
Congressional Budget Office and the president's Office of
Management and Budget, few could stand in the way of the new
administration's drive for sweeping tax reform.
The administration's original plan called for a $1.6 trillion cut
in the federal income tax, but even the president's most ardent
supporters on Capitol Hill cautioned that it would be extremely
difficult to pass such an enormous reduction plan. Recognizing
16. the importance of a victory on his administration's first key
policy initiative, President Bush worked with lawmakers to pare
down the original proposal and gain the necessary votes. The
final measure, which was signed into law on June 7, 2001,
featured a $1.3 trillion tax cut to be phased in over the next
decade and a fundamental restructuring of federal income taxes.
Supporters of the plan said that reducing the tax burden on the
American public, particularly with the projected federal surplus,
was a way to return “an overcharge” to taxpayers and to curb
federal spending. For example, House Majority Leader Dick
Armey said, “The addicts are going to have to take the cure.
We're no longer going to get stoned on the other people's
money” (Stevenson, 2001, p. A1). Proponents also argued that
the tax rebates, which the IRS began sending out in the summer
of 2001, would help to stimulate an economy that had declined
sharply in the preceding months.
Some of the central elements of the Bush plan included reducing
personal income tax rates, phasing out the estate tax, increasing
the child tax credit (and expanding the number of low-income
families eligible for this credit), and increasing the contribution
limits to 401(k) and individual retirement accounts. For
nonprofits, the tax reduction plan that finally passed Congress
lacked many of the provisions from the original Bush proposal
that would have encouraged increases in charitable giving.
Critics of the Bush tax plan in the governmental sector
predicted that it would prove to be too much, too soon. Senator
Tom Daschle, who became majority leader when the Democrats
took control of the Senate in June 2001, said, “We think this is
good short-term politics. [But] it is disastrous long-term policy”
(Stevenson, 2001, p. 26). Daschle and others suggested that the
plan would not leave enough in reserve to cover the cost of
upgrading the military, much less the substantial reforms to
Social Security and Medicare that remained on the horizon. And
even the president's own economic advisers moved away from
their original optimism, saying that the more cautionary
estimates of the federal surplus, which were released just weeks
17. after the tax plan became law, would require Congress to revisit
some of its main provisions.
Even so, President Bush succeeded in pushing through three
more major tax cuts aimed at reducing revenue by $1.9 trillion
over a ten-year period. Unfortunately, the surplus did not
materialize, and spending far outstripped revenue to produce
high levels of debt. During the Bush administration, economic
recessions, terrorist attacks, and corporate scandals, coupled
with the tax cuts and new spending for military action in Iraq
and Afghanistan, put the federal government further and further
into debt. Instead of the surplus forecasted at the beginning of
the Bush administration, there were federal budget deficits each
year beginning in 2002, and in January 2009, just before
President Bush left office, the Congressional Budget Office
projected a deficit of $1.2 trillion for FY 2009 based on a
continuation of the Bush administration policies and the effects
of the financial collapse of 2008 (Tritch, 2011). Overall, under
the Bush administration the total federal debt increased from
$5.7 trillion in January 2001 to $10.7 trillion in December 2008
(United States Department of the Treasury).
Obama and Economic Recovery The deep recession spurred by
the financial collapse in 2008 framed the context for the
incoming Obama administration. One of President Obama's first
acts was to sign into law the American Recovery and
Reinvestment Act (ARRA) in February 2009, a $787 billion
economic stimulus package that included spending on job
preservation and creation, health care, education, and energy;
investments in infrastructure; tax breaks; expanded
unemployment benefits; and a host of other programs designed
to halt further economic deterioration.
The new president, who began his term with a budget deficit
that was larger than any since World War II, set out in his 2010
budget proposal to capitalize on what he called a “once in a
generation” opportunity to reverse “an era of profound
irresponsibility that engulfed both private and public
institutions” (OMB 2009, p. 1). The budget proposal included
18. measures intended to help jumpstart the economy and stabilize
the country's financial system, including appropriations to buy
toxic bank assets, expand a consumer loan program, and
continue funding for the Troubled Asset Relief Program
(TARP), a program that was signed into law by President Bush
in October 2008 to address the subprime mortgage crisis by
buying assets and equity from financial institutions. President
Obama's 2010 budget proposal also addressed the overhaul of
the nation's healthcare system and called for investments in
clean energy, education, and the country's infrastructure
(Calmes, 2009).
One of the issues facing the Obama administration early on was
whether to extend the tax cuts enacted under President Bush,
which were set to expire in December 2010. Critics of the cuts
argued that these cuts spurred an increase in income inequality,
that they played a pivotal role in the budget deficits that began
in 2002, and that, contrary to predictions, they failed to
encourage economic growth. Others, however, contended that
the tax cuts created higher marginal rates for the very wealthy
and actually generated an increase in federal tax receipts from
2004 to 2007. After a great deal of debate, during which it was
projected that extending the cuts through 2020 would add more
than $3 trillion to the national debt, these cuts were extended
for two years.
The Obama budget proposal for FY 2013, released early in 2012
and totaling $3.8 trillion, called for $4 trillion in cuts over ten
years and $1.5 trillion in tax hikes for households earning more
than $250,000. It included $7.5 billion in administrative cuts
and increased funding for education, rail and road construction,
electric cars, and general research and development. Provisions
included ending the Bush tax cuts, restoring the estate tax to
2009 levels, increasing the tax rate on dividends for the
wealthy, and instituting the “Buffet Rule,” which would subject
those earning more than $1 million to a tax rate of at least 30
percent (Lee & Paletta, 2012). The budget also called for
elimination of tax breaks for oil and gas companies; caps on
19. discretionary spending; reforms to Medicare, Medicaid, and
other health programs; and mandatory savings in a variety of
areas. An analysis by the Congressional Budget Office noted
that under the 2013 budget proposal, the deficit for 2012 would
equal $1.3 trillion, or 8.1 percent of GDP. This would decline to
$977 billion in 2013, or 6.1 percent of GDP; fall further relative
to GDP in subsequent years to 2.5 percent in 2017; and then
increase to 3.0 percent of GDP by 2022. The estimated
accumulated federal debt as of the end of FY 2011 (September
30, 2011) was $14.8 trillion, for which the government incurred
$454 billion in interest expenses during FY 2011 (United States
Department of the Treasury). President Obama's proposed 2013
budget put forward a balanced plan of spending cuts and
revenue increases that reduce the deficit by more than $4
trillion over the next decade, including $1 trillion in spending
cuts he signed into law in the summer of 2012.
For an outline of the issues that these presidents have struggled
with, see the box “Exploring Concepts: Issues in
Budgeting”.Exploring Concepts
ISSUES IN BUDGETING
1. The fiscal health of the federal government, particularly in
light of unprecedented deficits
2. The struggles of state and local governments to balance their
budgets in both the short term and the longer term
3. Pressures on spending at all levels of government,
particularly focused on two areas—health care spending, which
affects all levels of government, and education spending, the
effects of which are felt primarily at the state and local level
4. Concerns about revenue structure and reliance on various
sources, particularly intergovernmental revenues and sales tax
revenues
5. The problems created by the need to deal with (and finance)
an aging infrastructure
6. The influence of financial and performance data on budgeting
decisions
20. 7. Institutional and organizational responses to the management
of the finance and budget function
SOURCE: Phillip G. Joyce and Scott Pattison, “Public
Budgeting in 2020: Return to Equilibrium, or Continued
Mismatch between Demands and Resources?” Public
Administration Review 70 (2010): s24–s32.
State and Local Expenditures
Expenditure comparisons at the state and local levels are
complicated by our system of intergovernmental transfers. In
education, for example, the federal government provides money
directly to individuals (in the form of student grants and loans),
but it also transfers large sums to state and local governments.
States spend money directly (for colleges and universities), but
they also transfer money received from the federal government
and some raised at the state level to local governments,
primarily to support education. Consequently, local
governments provide less than 30 percent of the money spent on
education in this country and actually are involved in spending
70 percent of that money.
State and local revenues come from several sources, taxes being
foremost among these (see Figure 5.2). The majority of tax
receipts collected for state and local governments are sales and
gross receipts taxes (34.1 percent), property taxes (33.4
percent), and individual income taxes (21.3 percent) (U.S.
Census, 2009). But, of course, as we would expect, state and
local revenues declined significantly during the recession.
Overall, tax revenue declined 4.5 percent in 2009, to $1.3
trillion. Individual and corporate income taxes saw the largest
declines in 2009, at 11.3 percent and 19.2 percent, respectively
(U.S. Census, 2009). This has caused governments at the state
and local level to experience significant fiscal stress and to
limit spending in vital areas such as education and health care.
Other areas of spending are significant, too. If we include
21. intergovernmental transfers spent at the state and local levels in
our calculations of state and local spending, the following
patterns emerge: States spend the greatest portion of their funds
on education, with public welfare next, followed by highways,
health, and natural resources. At the local level, the largest
amount again is spent on education, with health, public works,
and social welfare next. Because of intergovernmental transfers,
federal fiscal policies can have a significant impact on state and
local governments. Cuts at the federal level directly affect not
only federal agencies, but also state and local governments that
depend on federal funding. In fact, in a statement by the
National Council of State Legislatures, states have an
“incalculable stake” in the manner in which the federal
government balances its budget
(see www.ncsl.org/statefed/fedbud.htm#FederalGrants).
FIGURE 5.2
State and Local Revenues, Fiscal Year 2009
NOTE: Total exceeds 100 percent because of sampling errors.
SOURCE: U.S. Census Bureau, Appendix Table A-1, State and
Local Government Finances Summary 2009, retrieved March 19,
2012,
from http://www2.census.gov/govs/estimate/09_summary_report
.pdf.The Budget as a Managerial Tool
As a public manager, you will find that the budget process is
critical to your success and that of your agency, quite simply
because it establishes the level of funding for your programs. A
variety of steps are required to enable an agency to spend
money. First, legislation must be passed and signed by the chief
executive to authorize the program. This authorizing
legislation permits the establishment or continuation of a
particular program or agency. (Authorizing legislation usually
covers multiple years or is even open-ended, although some
programs, such as the space program, require new authorization
22. each year.) Next come appropriations, whereby the legislature
sets aside funds and creates budget authority for the funds'
expenditure. Only after both steps have been taken can an
agency spend money in pursuit of its stated objectives.
In most cases, governments use a fiscal year as their basic
accounting period. The federal fiscal year begins on October 1
and runs through September 30 of the following year. The fiscal
year carries the name of the year in which it ends; thus, fiscal
year 2013, or FY 2013, begins October 1, 2012, and ends
September 30, 2013. States and localities differ widely in terms
of fiscal years; some follow the federal pattern, whereas others
start July 1 (as did the federal government until 1976). Still
others match the fiscal year to the calendar year. Kentucky and
a few other states actually have a two-year-long fiscal year
because their legislatures meet and pass a budget only every
other year.
The fiscal year is the key period in which money is spent, but a
variety of steps must be taken before and after the fiscal year
that can affect an agency's expenditures. The budget must be
developed, typically by the chief executive (president,
governor, mayor) and transmitted to the legislature; it must be
approved by the legislature (hopefully) prior to the beginning of
the fiscal year; it must be executed during the fiscal year; and it
must be reviewed and audited following the fiscal year. At any
given point in the budget cycle, there are actually several
budgets being worked on. While one budget is being executed
(say, FY 2012), another (FY 2013) is being formulated and
approved, while another, (FY 2011) is being audited.
Budget Formulation
In the federal government and in many state and local
jurisdictions, the chief executive has primary responsibility for
preparing the budget. The budget cycle (see Figure 5.3)
typically begins with a letter from a central budget office to
agencies outlining the timetable for preparing the budget,
23. transmitting forms for use in the process, and indicating any
policy concerns of special priority for the fiscal year. The
agencies then prepare their own budget requests and forward
them to the central budget office for review (see the box “Take
Action: Financial Management: The Program Manager's Role”).
Often a series of meetings (or sometimes hearings) are held to
negotiate differences in the views of the central budget office
(reflecting the priorities of the chief executive) and the
agencies. Finally, the budget document is prepared by the
central budget office and transmitted by the chief executive to
the legislature for approval.