SlideShare una empresa de Scribd logo
1 de 1
I BALANCE SHEET Bank Bank Bank Group Group Group
31st Mar, 2012 31st Dec 2012 31st Mar 2013 31st Mar 2012 31st Dec 2012 31st Mar 2013
Unaudited Audited Unaudited Unaudited Audited Unaudited
Shs ‘000’ Shs ‘000’ Shs ‘000 Shs ‘000’ Shs ‘000’ Shs ‘000’
A ASSETS
1 Cash (both Local & Foreign) 172,528 171,683 144,173 172,535 215,514 173,063
2 Balances due from Central Bank of Kenya 585,437 1,572,266 1,033,658 585,437 1,572,266 1,069,392
3 Kenya Government and other securities held for dealing purposes - - - - - -
4 Financial Assets at fair value through profit and loss - - - - - -
5 Investment Securities: - - - - - -
a) Held to Maturity: 2,659,010 3,901,037 3,649,223 2,659,010 3,952,452 3,800,072
a. Kenya Government securities 2,272,064 3,572,430 3,310,696 2,272,064 3,623,845 3,461,545
b. Other securities 386,946 328,607 338,527 386,946 328,607 338,527
b) Available for sale: 817,077 1,609,883 1,898,564 817,077 1,609,883 1,898,564
a. Kenya Government securities 817,077 1,609,883 1,898,564 817,077 1,609,883 1,898,564
b. Other securities - - - - - -
6 Deposits and balances due from local banking institutions 300,546 86,166 42,812 307,252 93,796 825,676
7 Deposits and balances due from banking institutions abroad 308,978 458,064 748,438 308,978 987,724 748,438
8 Tax recoverable 16,880 26,805 26,805 18,603 28,665 28,763
9 Loans and advances to customers (net) 7,448,532 9,789,658 9,568,144 7,448,532 10,133,792 9,923,181
10 Balances due from banking institutions in the group 1,611 3,597 3,800 1,611 - 0
11 Investments in associates 177,482 - - 178,908 - -
12 Investments in subsidiary companies 217,850 612,519 818,158 - - -
13 Investments in joint ventures - - - - - -
14 Investment properties - - - - - -
15 Property and equipment 445,701 470,376 493,117 447,382 481,200 504,222
16 Prepaid lease rentals - - - - -
17 Intangible assets 30,306 57,611 57,288 283,310 283,781 283,029
18 Deferred tax asset - 8,852 8,852 5,342 4,762 4,762
19 Retirement benefit asset - - - -
20 Other assets 386,049 302,262 511,948 399,654 334,000 566,990
21 TOTAL ASSETS 13,567,987 19,070,779 19,004,980 13,633,631 19,697,835 19,826,152
- - - - - -
B LIABILITIES - - - - - -
22 Balances due to Central Bank of Kenya - - - - - -
23 Customer deposits 11,386,423 15,255,406 15,667,541 11,361,914 15,529,235 16,135,429
24 Deposits and balances due to local banking institutions - 609,039 16,688 - 652,025 59,356
25 Deposits and balances due to foreign banking institutions - - - - - -
26 Other money market deposits - - - - - -
27 Borrowed funds - 759,919 737,210 - 759,919 737,210
28 Balances due to banking institutions in the group 42,824
29 Tax payable 30,926 - 30,712 30,926 7,083 30,712
30 Dividends payable - - - - - -
31 Deferred tax liability 3,114 - - - - -
32 Retirement benefit liability - - - - - -
33 Other liabilities 373,972 334,806 396,681 394,645 385,431 482,699
34 TOTAL LIABILITIES 11,794,435 16,959,170 16,891,656 11,787,485 17,333,693 17,445,405
C SHARE HOLDERS’ FUNDS - - - - - -
35 Paid up/Assigned capital 1,050,000 1,050,000 1,050,000 1,050,000 1,050,000 1,050,000
36 Share premium /(discount) - - - - - -
37 Revaluation reserves (74,558) (4,919) (74,865) (74,558) (23,302) (74,865)
38 Retained earnings/Accumulated losses 730,330 972,506 1,044,167 771,999 961,531 1,036,646
39 Statutory loan loss reserves 67,780 94,022 94,022 67,780 102,736 94,022
40 Other Reserves - - - - - -
41 Proposed dividends - - - - - -
42 Capital grants - - - 30,925 273,177 274,944
43 TOTAL SHAREHOLDERS’ FUNDS 1,773,552 2,111,609 2,113,324 1,846,146 2,364,142 2,380,747
44 TOTAL LIABILITIES AND SHAREHOLDERS’ FUNDS 13,567,987 19,070,779 19,004,980 13,633,631 19,697,835 19,826,152
II PROFIT AND LOSS ACCOUNT - - - - - -
1.0 INTEREST INCOME - - - - - -
1.1 Loans and advances 396,112 1,713,948 415,005 396,112 1,739,705 433,232
1.2 Government securities 72,449 420,939 140,724 72,449 422,236 143,042
1.3 Deposits and placements with banking institutions 5,805 46,165 5,559 5,805 59,425 22,308
1.4 Other Interest income 11,462 43,629 9,919 11,477 43,688 10,242
1.5 Total interest income 485,828 2,224,681 571,206 485,843 2,265,054 608,823
2.0 INTEREST EXPENSE - - - - - -
2.1 Customer deposits 286,571 1,325,631 308,398 286,319 1,330,726 318,002
2.2 Deposits and placement from banking institutions 699 7,668 3,792 699 7,668 3,983
2.3 Other interest expenses 32 16,070 17,423 32 16,070 17,462
2.4 Total interest expenses 287,302 1,349,369 329,612 287,050 1,354,464 339,448
3.0 NET INTEREST INCOME/ (LOSS) 198,526 875,312 241,593 198,793 910,590 269,376
4.0 NON-INTEREST INCOME - - - - - -
4.1 Fees and commissions on loans and advances 28,727 96,158 30,691 28,727 96,158 33,528
4.2 Other fees and commissions 40,413 174,933 53,812 40,413 183,040 54,970
4.3 Foreign exchange trading income/(Loss) 40,732 160,494 32,906 40,732 161,864 33,586
4.4 Dividend Income 315 315 - 315 315 -
4.5 Other income 3,305 74,699 11,759 9,325 48,702 19,544
4.6 Total Non-interest income 113,492 506,599 129,168 119,512 490,079 141,627
5.0 TOTAL OPERATING INCOME 312,018 1,381,911 370,761 318,305 1,400,669 411,003
6.0 OTHER OPERATING EXPENSES - - - - - -
6.1 Loan loss provision 23,699 24,219 29,000 23,699 31,113 33,962
6.2 Staff costs 91,866 436,162 125,602 94,397 466,037 144,321
6.3 Directors’ emoluments 5,040 23,250 5,100 5,040 23,410 5,199
6.4 Rental charges 10,686 49,964 11,372 11,223 54,474 14,220
6.5 Depreciation charge on property and equipment 6,858 30,987 12,707 6,947 32,590 13,689
6.6 Amortisation charges 1,679 7,973 2,684 1,859 9,211 3,075
6.7 Other operating expenses 69,803 252,111 81,923 70,723 258,295 88,945
6.8 Total Other Operating Expenses 209,631 824,666 268,389 213,888 875,130 303,409
7.0 Profit/(loss) before tax and exceptional items 102,387 557,245 102,373 104,417 525,539 107,594
8.0 Exceptional items
9.0 Profit/(loss) after exceptional items 102,387 557,245 102,373 104,417 525,539 107,594
10.0 Current tax 30,926 130,402 30,712 30,926 147,363 30,712
11.0 Deferred tax - 2,960 - - (2,467) -
12.0 Profit/(loss) after tax and exceptional items 71,461 423,883 71,661 73,491 380,643 76,882
13.0 Other Comprehensive Income
13.1 Gains/(Losses) from translating the financial statements of foreign
operations
- - - - (30,808) 17,646
13.2 Fair value changes in available for sale financial assets - 69,639 (4,919) - 69,639 (4,919)
13.3 Revaluation surplus on Property , plant and equipment - - - - - -
13.4 Share of other comprehensive income of associates - - - - - -
13.5 Income tax relating to components of other comprehensive income - - - - - -
14.0 Other Comprehensive Income for the year net of tax - 69,639 (4,919) - 38,831 12,727
15.0 Total comprehensive income for the year 71,461 493,522 66,742 73,491 419,474 89,609
16.0 EARNINGS PER SHARE-BASIC & DILUTED 0.68 4.04 0.68 0.70 3.63 0.73
17.0 DIVIDEND PER SHARE-DECLARED - 0.80 - - 0.80 -
III OTHER DISCLOSURES - - - - -
1.0 NON-PERFORMING LOANS AND ADVANCES - - - - - -
(a) Gross Non-performing loans and advances 307,373 433,403 435,555 307,373 433,403 498,758
(b) Less: Interest in Suspense 75,910 98,308 109,490 75,910 98,308 125,164
(c) Total Non-Performing Loans and Advances(a-b) 231,463 335,095 326,065 231,463 335,095 373,594
(d) Less: Loan Loss Provision 133,987 130,326 130,326 133,987 130,326 152,272
(e) Net Non-Performing Loans and Advances(c-d) 97,476 204,769 195,739 97,476 204,769 221,322
(f) Discounted Value of Securities 97,476 204,769 195,739 97,476 204,769 221,322
(g) Net NPLs Exposure(e-f) - - - - - -
2.0 INSIDER LOANS AND ADVANCES - - - - - -
(a) Directors, Shareholders and Associates 39,164 39,769 37,351 39,164 39,769 43,242
(b) Employees 94,659 161,650 172,358 94,659 161,650 172,454
(c) Total Insider Loans and Advances and other facilities 133,823 201,419 209,709 133,823 201,419 215,696
3.0 OFF-BALANCE SHEET ITEMS - - - - - -
(a) Letters of credit, guarantees, acceptances 2,758,463 2,926,305 3,154,505 2,758,463 2,926,305 3,157,650
(b) Forwards, swaps and options 485,108 695,190 1,047,932 485,108 695,190 1,047,932
(c) Other contingent liabilities 976,656 305,819 441,701 976,656 305,819 441,701
(d) Total Contingent Liabilities 4,220,227 3,927,314 4,644,138 4,220,227 3,927,314 4,647,283
4.0 CAPITAL STRENGTH - - - - - -
(a) Core capital 1,567,118 1,644,815 1,475,008 1,567,118 1,644,815 1,475,008
(b) Minimum Statutory Capital 700,000 1,000,000 1,000,000 700,000 1,000,000 1,000,000
(c) Excess/ (Dificiency)(a-b) 867,118 644,815 475,008 867,118 644,815 475,008
(d) Supplementary Capital 67,780 94,022 94,022 67,780 94,022 94,022
(e) Total Capital(a+d) 1,634,898 1,738,837 1,569,030 1,634,898 1,738,837 1,569,030
(f) Total risk weighted assets 9,800,142 12,078,548 11,490,652 9,800,142 12,078,548 11,490,652
(g) Core Capital/Total deposits Liabilities 13.76% 10.78% 9.41% 13.76% 10.78% 9.41%
(h) Minimum statutory Ratio 8.0% 8.0% 8.0% 8.0% 8.0% 8.0%
(I) Excess/(Deficiency)(g-h) 5.8% 2.8% 1.4% 5.8% 2.8% 1.4%
(j) Core Capital/total risk weighted assets 16.0% 13.6% 12.8% 16.0% 13.6% 12.8%
(k) Minimum StatutoryRatio 8.0% 8.0% 8.0% 8.0% 8.0% 8.0%
(l) Excess(Deficiency)(j-k) 8.0% 5.6% 4.8% 8.0% 5.6% 4.8%
(m) Total Capital/total risk weighted assets 16.7% 14.4% 13.7% 16.7% 14.4% 13.7%
(n) Minimum statutory Ratio 12.0% 12.0% 12.0% 12.0% 12.0% 12.0%
(o) Excess/(Deficiency)(m-n) 4.7% 2.4% 1.7% 4.7% 2.4% 1.7%
14 LIQUIDITY - - - - - -
14.1 (a) Liquidity Ratio 38.0% 42.5% 45.7% 38.0% 42.5% 45.7%
14.2 (b) Minimum Statutory Ratio 20.0% 20.0% 20.0% 20.0% 20.0% 20.0%
14.3 (c) Excess(Deficiency)(a-b) 18.0% 22.5% 25.7% 18.0% 22.5% 25.7%
UNAUDITED FINANCIAL STATEMENTS AND OTHER DISCLOSURES AS AT 31ST MARCH 2013
AUTHORIZATION: The above financial statements and disclosures are extracts of unaudited financial records of the bank.
MESSAGE FROM THE DIRECTORS: The financial statements are extracts from the books of the institution. The complete set of quarterly financial statements, statutory and qualitative disclosures can
be accessed on the institution’s website www.abcthebank.com. They may also be accessed at the institution’s head office located at Mezzanine Floor, ABC Bank Koinange Street.
Signed: Shamaz Savani MANAGING DIRECTOR	 Joseph K. Muiruri DIRECTOR

Más contenido relacionado

La actualidad más candente

slm SuppFinInfo1Qtr07W33652A_2156_N_993
slm SuppFinInfo1Qtr07W33652A_2156_N_993slm SuppFinInfo1Qtr07W33652A_2156_N_993
slm SuppFinInfo1Qtr07W33652A_2156_N_993finance42
 
Separate financial Statements 2009
Separate financial Statements 2009Separate financial Statements 2009
Separate financial Statements 2009Edison S.p.A.
 
Class 2-group-2-finance-mgnt
Class 2-group-2-finance-mgntClass 2-group-2-finance-mgnt
Class 2-group-2-finance-mgntCherry Renae
 
Liberty%20Tax%20Finanial%20Statements%20-%20FY%202006
Liberty%20Tax%20Finanial%20Statements%20-%20FY%202006Liberty%20Tax%20Finanial%20Statements%20-%20FY%202006
Liberty%20Tax%20Finanial%20Statements%20-%20FY%202006finance41
 
Brazil legal guide
Brazil legal guideBrazil legal guide
Brazil legal guidelvillela
 
walgreen 2008 Proxy Statement
walgreen 2008 Proxy Statementwalgreen 2008 Proxy Statement
walgreen 2008 Proxy Statementfinance4
 
Conference Call 4Q13
Conference Call 4Q13Conference Call 4Q13
Conference Call 4Q13ItauRI
 
Symantec 2005_Proxy
Symantec  2005_ProxySymantec  2005_Proxy
Symantec 2005_Proxyfinance40
 
.credit-suisse Annual Report Part 2 Financial report 1999 / 2000
.credit-suisse Annual Report Part 2 Financial report 1999 / 2000.credit-suisse Annual Report Part 2 Financial report 1999 / 2000
.credit-suisse Annual Report Part 2 Financial report 1999 / 2000QuarterlyEarningsReports2
 
.credit-suisse Annual Report Part 3 Financial report 1999 / 2000 continued
.credit-suisse Annual Report Part 3 Financial report 1999 / 2000 continued.credit-suisse Annual Report Part 3 Financial report 1999 / 2000 continued
.credit-suisse Annual Report Part 3 Financial report 1999 / 2000 continuedQuarterlyEarningsReports2
 
카드 재무제표 2015_영
카드 재무제표 2015_영카드 재무제표 2015_영
카드 재무제표 2015_영Hyundai Finance
 
AT&T Financial and Operational Results
AT&T Financial and Operational ResultsAT&T Financial and Operational Results
AT&T Financial and Operational Resultsfinance1
 
dow chemical 2007 Proxy Statement
dow chemical 2007 Proxy Statementdow chemical 2007 Proxy Statement
dow chemical 2007 Proxy Statementfinance5
 
quest diagnostics Proxy_statement_final
quest diagnostics Proxy_statement_finalquest diagnostics Proxy_statement_final
quest diagnostics Proxy_statement_finalfinance34
 
카드 감사보고서 영문
카드 감사보고서 영문카드 감사보고서 영문
카드 감사보고서 영문Hyundai Finance
 

La actualidad más candente (17)

slm SuppFinInfo1Qtr07W33652A_2156_N_993
slm SuppFinInfo1Qtr07W33652A_2156_N_993slm SuppFinInfo1Qtr07W33652A_2156_N_993
slm SuppFinInfo1Qtr07W33652A_2156_N_993
 
Separate financial Statements 2009
Separate financial Statements 2009Separate financial Statements 2009
Separate financial Statements 2009
 
Class 2-group-2-finance-mgnt
Class 2-group-2-finance-mgntClass 2-group-2-finance-mgnt
Class 2-group-2-finance-mgnt
 
Liberty%20Tax%20Finanial%20Statements%20-%20FY%202006
Liberty%20Tax%20Finanial%20Statements%20-%20FY%202006Liberty%20Tax%20Finanial%20Statements%20-%20FY%202006
Liberty%20Tax%20Finanial%20Statements%20-%20FY%202006
 
Brazil legal guide
Brazil legal guideBrazil legal guide
Brazil legal guide
 
walgreen 2008 Proxy Statement
walgreen 2008 Proxy Statementwalgreen 2008 Proxy Statement
walgreen 2008 Proxy Statement
 
Conference Call 4Q13
Conference Call 4Q13Conference Call 4Q13
Conference Call 4Q13
 
Symantec 2005_Proxy
Symantec  2005_ProxySymantec  2005_Proxy
Symantec 2005_Proxy
 
.credit-suisse Annual Report Part 2 Financial report 1999 / 2000
.credit-suisse Annual Report Part 2 Financial report 1999 / 2000.credit-suisse Annual Report Part 2 Financial report 1999 / 2000
.credit-suisse Annual Report Part 2 Financial report 1999 / 2000
 
.credit-suisse Annual Report Part 3 Financial report 1999 / 2000 continued
.credit-suisse Annual Report Part 3 Financial report 1999 / 2000 continued.credit-suisse Annual Report Part 3 Financial report 1999 / 2000 continued
.credit-suisse Annual Report Part 3 Financial report 1999 / 2000 continued
 
카드 재무제표 2015_영
카드 재무제표 2015_영카드 재무제표 2015_영
카드 재무제표 2015_영
 
AT&T Financial and Operational Results
AT&T Financial and Operational ResultsAT&T Financial and Operational Results
AT&T Financial and Operational Results
 
Forcast Model
Forcast ModelForcast Model
Forcast Model
 
dow chemical 2007 Proxy Statement
dow chemical 2007 Proxy Statementdow chemical 2007 Proxy Statement
dow chemical 2007 Proxy Statement
 
CON-WP08 pdf
CON-WP08 pdfCON-WP08 pdf
CON-WP08 pdf
 
quest diagnostics Proxy_statement_final
quest diagnostics Proxy_statement_finalquest diagnostics Proxy_statement_final
quest diagnostics Proxy_statement_final
 
카드 감사보고서 영문
카드 감사보고서 영문카드 감사보고서 영문
카드 감사보고서 영문
 

Similar a Unaudited Financial Statements and Other Disclosures As At 31st March 2013

Williams sonoma model
Williams sonoma model Williams sonoma model
Williams sonoma model Trishala Rasya
 
Axiata quarterly report 20130830
Axiata quarterly report 20130830Axiata quarterly report 20130830
Axiata quarterly report 20130830Millennial Mobility
 
Guaranty Trust Bank financial report 2009
Guaranty Trust Bank financial report 2009Guaranty Trust Bank financial report 2009
Guaranty Trust Bank financial report 2009Michael Olafusi
 
2014 Annual Report - Separate financial statements February 18, 2015]
2014 Annual Report - Separate financial statements February 18, 2015]2014 Annual Report - Separate financial statements February 18, 2015]
2014 Annual Report - Separate financial statements February 18, 2015]Edison S.p.A.
 
Hci con audit_report_2012_final
Hci con audit_report_2012_finalHci con audit_report_2012_final
Hci con audit_report_2012_finalHyundai Finance
 
Kn datasheets q3 2009_2
Kn datasheets q3 2009_2Kn datasheets q3 2009_2
Kn datasheets q3 2009_2Neha Tayal
 
Mc Donald Financial Analysis Project
Mc Donald Financial Analysis Project Mc Donald Financial Analysis Project
Mc Donald Financial Analysis Project Mai Nguyen
 
Apresentação 1T06
Apresentação 1T06Apresentação 1T06
Apresentação 1T06RiRossi
 
Balance Sheet Analysis of Tata Motors.pptx
Balance Sheet Analysis of Tata Motors.pptxBalance Sheet Analysis of Tata Motors.pptx
Balance Sheet Analysis of Tata Motors.pptxShantilal Hajeri
 
S&W Second Quarter Fiscal 2018 Financial Results
S&W Second Quarter Fiscal 2018 Financial Results S&W Second Quarter Fiscal 2018 Financial Results
S&W Second Quarter Fiscal 2018 Financial Results Agropages Com
 
regions SUPP 4Q/07
regions SUPP 4Q/07regions SUPP 4Q/07
regions SUPP 4Q/07finance25
 
regions SUPP 4Q 07
regions SUPP 4Q 07regions SUPP 4Q 07
regions SUPP 4Q 07finance25
 

Similar a Unaudited Financial Statements and Other Disclosures As At 31st March 2013 (20)

NFLX-model.pdf
NFLX-model.pdfNFLX-model.pdf
NFLX-model.pdf
 
Williams sonoma model
Williams sonoma model Williams sonoma model
Williams sonoma model
 
Axiata quarterly report 20130830
Axiata quarterly report 20130830Axiata quarterly report 20130830
Axiata quarterly report 20130830
 
UAC annual report 2018
UAC annual report 2018UAC annual report 2018
UAC annual report 2018
 
Ekiti State 2010 Accountant General Report
Ekiti State 2010 Accountant General ReportEkiti State 2010 Accountant General Report
Ekiti State 2010 Accountant General Report
 
Ekiti State Financial Report for the year 2014
Ekiti State Financial Report for the year 2014Ekiti State Financial Report for the year 2014
Ekiti State Financial Report for the year 2014
 
Guaranty Trust Bank financial report 2009
Guaranty Trust Bank financial report 2009Guaranty Trust Bank financial report 2009
Guaranty Trust Bank financial report 2009
 
Work sample
Work sampleWork sample
Work sample
 
Ekit State Financial Report for the year 2012
Ekit State Financial Report for the year 2012Ekit State Financial Report for the year 2012
Ekit State Financial Report for the year 2012
 
2014 Annual Report - Separate financial statements February 18, 2015]
2014 Annual Report - Separate financial statements February 18, 2015]2014 Annual Report - Separate financial statements February 18, 2015]
2014 Annual Report - Separate financial statements February 18, 2015]
 
Ekiti State Financial Report for the year 2013
Ekiti State Financial Report for the year 2013Ekiti State Financial Report for the year 2013
Ekiti State Financial Report for the year 2013
 
Hci con audit_report_2012_final
Hci con audit_report_2012_finalHci con audit_report_2012_final
Hci con audit_report_2012_final
 
Kn datasheets q3 2009_2
Kn datasheets q3 2009_2Kn datasheets q3 2009_2
Kn datasheets q3 2009_2
 
Mc Donald Financial Analysis Project
Mc Donald Financial Analysis Project Mc Donald Financial Analysis Project
Mc Donald Financial Analysis Project
 
Apresentação 1T06
Apresentação 1T06Apresentação 1T06
Apresentação 1T06
 
Larsen & toubro.ppt_25
Larsen & toubro.ppt_25Larsen & toubro.ppt_25
Larsen & toubro.ppt_25
 
Balance Sheet Analysis of Tata Motors.pptx
Balance Sheet Analysis of Tata Motors.pptxBalance Sheet Analysis of Tata Motors.pptx
Balance Sheet Analysis of Tata Motors.pptx
 
S&W Second Quarter Fiscal 2018 Financial Results
S&W Second Quarter Fiscal 2018 Financial Results S&W Second Quarter Fiscal 2018 Financial Results
S&W Second Quarter Fiscal 2018 Financial Results
 
regions SUPP 4Q/07
regions SUPP 4Q/07regions SUPP 4Q/07
regions SUPP 4Q/07
 
regions SUPP 4Q 07
regions SUPP 4Q 07regions SUPP 4Q 07
regions SUPP 4Q 07
 

Más de ABC Bank Kenya

Summary of business opportunities
Summary of business opportunitiesSummary of business opportunities
Summary of business opportunitiesABC Bank Kenya
 
Consumer Protection Act Brief
Consumer Protection Act BriefConsumer Protection Act Brief
Consumer Protection Act BriefABC Bank Kenya
 
Supply Chain Finance Support Facility Project Briefing Note
Supply Chain Finance Support Facility Project Briefing NoteSupply Chain Finance Support Facility Project Briefing Note
Supply Chain Finance Support Facility Project Briefing NoteABC Bank Kenya
 
ABC Bank Products and Services Catalogue
ABC Bank Products and Services Catalogue ABC Bank Products and Services Catalogue
ABC Bank Products and Services Catalogue ABC Bank Kenya
 
Economic Survey 2013 Highlights
Economic Survey 2013 HighlightsEconomic Survey 2013 Highlights
Economic Survey 2013 HighlightsABC Bank Kenya
 
Nairobi Securities Exchange Overview in the month of May 2013
Nairobi Securities Exchange Overview in the month of May 2013Nairobi Securities Exchange Overview in the month of May 2013
Nairobi Securities Exchange Overview in the month of May 2013ABC Bank Kenya
 
ABC Vision January- March 2012
ABC Vision January- March 2012ABC Vision January- March 2012
ABC Vision January- March 2012ABC Bank Kenya
 
ABC Vision Diaspora Edition April 2013
ABC Vision Diaspora Edition April 2013 ABC Vision Diaspora Edition April 2013
ABC Vision Diaspora Edition April 2013 ABC Bank Kenya
 
ABC Vision Diaspora Edition February 2013
ABC Vision Diaspora Edition February 2013ABC Vision Diaspora Edition February 2013
ABC Vision Diaspora Edition February 2013ABC Bank Kenya
 
ABC Vision Diaspora Edition Jan 2013
ABC Vision Diaspora Edition Jan 2013ABC Vision Diaspora Edition Jan 2013
ABC Vision Diaspora Edition Jan 2013ABC Bank Kenya
 
ABC Vision Diaspora Edition August 2012
ABC Vision Diaspora Edition August 2012ABC Vision Diaspora Edition August 2012
ABC Vision Diaspora Edition August 2012ABC Bank Kenya
 
The ABC Vision Diaspora Edition August 2012
The ABC Vision Diaspora Edition August 2012The ABC Vision Diaspora Edition August 2012
The ABC Vision Diaspora Edition August 2012ABC Bank Kenya
 
The ABC Vision Diaspora Edition August 2012
The ABC Vision Diaspora Edition August 2012The ABC Vision Diaspora Edition August 2012
The ABC Vision Diaspora Edition August 2012ABC Bank Kenya
 
The ABC Vision Diaspora Edition Dec 2012
The ABC Vision Diaspora Edition Dec 2012The ABC Vision Diaspora Edition Dec 2012
The ABC Vision Diaspora Edition Dec 2012ABC Bank Kenya
 
ABC Vision Diaspora Edition Issue NO. 7
ABC Vision Diaspora Edition Issue NO. 7ABC Vision Diaspora Edition Issue NO. 7
ABC Vision Diaspora Edition Issue NO. 7ABC Bank Kenya
 

Más de ABC Bank Kenya (17)

3rdEdition2015
3rdEdition20153rdEdition2015
3rdEdition2015
 
Summary of business opportunities
Summary of business opportunitiesSummary of business opportunities
Summary of business opportunities
 
Budget Guide 2013
Budget Guide 2013Budget Guide 2013
Budget Guide 2013
 
Consumer Protection Act Brief
Consumer Protection Act BriefConsumer Protection Act Brief
Consumer Protection Act Brief
 
Supply Chain Finance Support Facility Project Briefing Note
Supply Chain Finance Support Facility Project Briefing NoteSupply Chain Finance Support Facility Project Briefing Note
Supply Chain Finance Support Facility Project Briefing Note
 
ABC Bank Products and Services Catalogue
ABC Bank Products and Services Catalogue ABC Bank Products and Services Catalogue
ABC Bank Products and Services Catalogue
 
Economic Survey 2013 Highlights
Economic Survey 2013 HighlightsEconomic Survey 2013 Highlights
Economic Survey 2013 Highlights
 
Nairobi Securities Exchange Overview in the month of May 2013
Nairobi Securities Exchange Overview in the month of May 2013Nairobi Securities Exchange Overview in the month of May 2013
Nairobi Securities Exchange Overview in the month of May 2013
 
ABC Vision January- March 2012
ABC Vision January- March 2012ABC Vision January- March 2012
ABC Vision January- March 2012
 
ABC Vision Diaspora Edition April 2013
ABC Vision Diaspora Edition April 2013 ABC Vision Diaspora Edition April 2013
ABC Vision Diaspora Edition April 2013
 
ABC Vision Diaspora Edition February 2013
ABC Vision Diaspora Edition February 2013ABC Vision Diaspora Edition February 2013
ABC Vision Diaspora Edition February 2013
 
ABC Vision Diaspora Edition Jan 2013
ABC Vision Diaspora Edition Jan 2013ABC Vision Diaspora Edition Jan 2013
ABC Vision Diaspora Edition Jan 2013
 
ABC Vision Diaspora Edition August 2012
ABC Vision Diaspora Edition August 2012ABC Vision Diaspora Edition August 2012
ABC Vision Diaspora Edition August 2012
 
The ABC Vision Diaspora Edition August 2012
The ABC Vision Diaspora Edition August 2012The ABC Vision Diaspora Edition August 2012
The ABC Vision Diaspora Edition August 2012
 
The ABC Vision Diaspora Edition August 2012
The ABC Vision Diaspora Edition August 2012The ABC Vision Diaspora Edition August 2012
The ABC Vision Diaspora Edition August 2012
 
The ABC Vision Diaspora Edition Dec 2012
The ABC Vision Diaspora Edition Dec 2012The ABC Vision Diaspora Edition Dec 2012
The ABC Vision Diaspora Edition Dec 2012
 
ABC Vision Diaspora Edition Issue NO. 7
ABC Vision Diaspora Edition Issue NO. 7ABC Vision Diaspora Edition Issue NO. 7
ABC Vision Diaspora Edition Issue NO. 7
 

Unaudited Financial Statements and Other Disclosures As At 31st March 2013

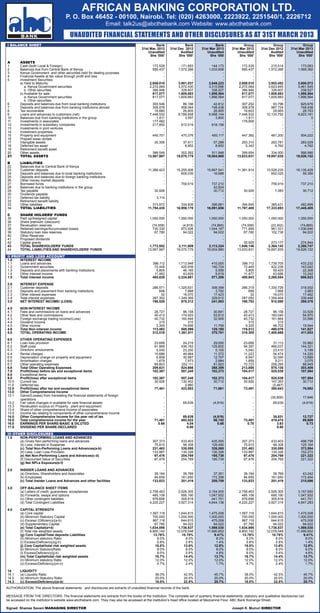
  • 1. I BALANCE SHEET Bank Bank Bank Group Group Group 31st Mar, 2012 31st Dec 2012 31st Mar 2013 31st Mar 2012 31st Dec 2012 31st Mar 2013 Unaudited Audited Unaudited Unaudited Audited Unaudited Shs ‘000’ Shs ‘000’ Shs ‘000 Shs ‘000’ Shs ‘000’ Shs ‘000’ A ASSETS 1 Cash (both Local & Foreign) 172,528 171,683 144,173 172,535 215,514 173,063 2 Balances due from Central Bank of Kenya 585,437 1,572,266 1,033,658 585,437 1,572,266 1,069,392 3 Kenya Government and other securities held for dealing purposes - - - - - - 4 Financial Assets at fair value through profit and loss - - - - - - 5 Investment Securities: - - - - - - a) Held to Maturity: 2,659,010 3,901,037 3,649,223 2,659,010 3,952,452 3,800,072 a. Kenya Government securities 2,272,064 3,572,430 3,310,696 2,272,064 3,623,845 3,461,545 b. Other securities 386,946 328,607 338,527 386,946 328,607 338,527 b) Available for sale: 817,077 1,609,883 1,898,564 817,077 1,609,883 1,898,564 a. Kenya Government securities 817,077 1,609,883 1,898,564 817,077 1,609,883 1,898,564 b. Other securities - - - - - - 6 Deposits and balances due from local banking institutions 300,546 86,166 42,812 307,252 93,796 825,676 7 Deposits and balances due from banking institutions abroad 308,978 458,064 748,438 308,978 987,724 748,438 8 Tax recoverable 16,880 26,805 26,805 18,603 28,665 28,763 9 Loans and advances to customers (net) 7,448,532 9,789,658 9,568,144 7,448,532 10,133,792 9,923,181 10 Balances due from banking institutions in the group 1,611 3,597 3,800 1,611 - 0 11 Investments in associates 177,482 - - 178,908 - - 12 Investments in subsidiary companies 217,850 612,519 818,158 - - - 13 Investments in joint ventures - - - - - - 14 Investment properties - - - - - - 15 Property and equipment 445,701 470,376 493,117 447,382 481,200 504,222 16 Prepaid lease rentals - - - - - 17 Intangible assets 30,306 57,611 57,288 283,310 283,781 283,029 18 Deferred tax asset - 8,852 8,852 5,342 4,762 4,762 19 Retirement benefit asset - - - - 20 Other assets 386,049 302,262 511,948 399,654 334,000 566,990 21 TOTAL ASSETS 13,567,987 19,070,779 19,004,980 13,633,631 19,697,835 19,826,152 - - - - - - B LIABILITIES - - - - - - 22 Balances due to Central Bank of Kenya - - - - - - 23 Customer deposits 11,386,423 15,255,406 15,667,541 11,361,914 15,529,235 16,135,429 24 Deposits and balances due to local banking institutions - 609,039 16,688 - 652,025 59,356 25 Deposits and balances due to foreign banking institutions - - - - - - 26 Other money market deposits - - - - - - 27 Borrowed funds - 759,919 737,210 - 759,919 737,210 28 Balances due to banking institutions in the group 42,824 29 Tax payable 30,926 - 30,712 30,926 7,083 30,712 30 Dividends payable - - - - - - 31 Deferred tax liability 3,114 - - - - - 32 Retirement benefit liability - - - - - - 33 Other liabilities 373,972 334,806 396,681 394,645 385,431 482,699 34 TOTAL LIABILITIES 11,794,435 16,959,170 16,891,656 11,787,485 17,333,693 17,445,405 C SHARE HOLDERS’ FUNDS - - - - - - 35 Paid up/Assigned capital 1,050,000 1,050,000 1,050,000 1,050,000 1,050,000 1,050,000 36 Share premium /(discount) - - - - - - 37 Revaluation reserves (74,558) (4,919) (74,865) (74,558) (23,302) (74,865) 38 Retained earnings/Accumulated losses 730,330 972,506 1,044,167 771,999 961,531 1,036,646 39 Statutory loan loss reserves 67,780 94,022 94,022 67,780 102,736 94,022 40 Other Reserves - - - - - - 41 Proposed dividends - - - - - - 42 Capital grants - - - 30,925 273,177 274,944 43 TOTAL SHAREHOLDERS’ FUNDS 1,773,552 2,111,609 2,113,324 1,846,146 2,364,142 2,380,747 44 TOTAL LIABILITIES AND SHAREHOLDERS’ FUNDS 13,567,987 19,070,779 19,004,980 13,633,631 19,697,835 19,826,152 II PROFIT AND LOSS ACCOUNT - - - - - - 1.0 INTEREST INCOME - - - - - - 1.1 Loans and advances 396,112 1,713,948 415,005 396,112 1,739,705 433,232 1.2 Government securities 72,449 420,939 140,724 72,449 422,236 143,042 1.3 Deposits and placements with banking institutions 5,805 46,165 5,559 5,805 59,425 22,308 1.4 Other Interest income 11,462 43,629 9,919 11,477 43,688 10,242 1.5 Total interest income 485,828 2,224,681 571,206 485,843 2,265,054 608,823 2.0 INTEREST EXPENSE - - - - - - 2.1 Customer deposits 286,571 1,325,631 308,398 286,319 1,330,726 318,002 2.2 Deposits and placement from banking institutions 699 7,668 3,792 699 7,668 3,983 2.3 Other interest expenses 32 16,070 17,423 32 16,070 17,462 2.4 Total interest expenses 287,302 1,349,369 329,612 287,050 1,354,464 339,448 3.0 NET INTEREST INCOME/ (LOSS) 198,526 875,312 241,593 198,793 910,590 269,376 4.0 NON-INTEREST INCOME - - - - - - 4.1 Fees and commissions on loans and advances 28,727 96,158 30,691 28,727 96,158 33,528 4.2 Other fees and commissions 40,413 174,933 53,812 40,413 183,040 54,970 4.3 Foreign exchange trading income/(Loss) 40,732 160,494 32,906 40,732 161,864 33,586 4.4 Dividend Income 315 315 - 315 315 - 4.5 Other income 3,305 74,699 11,759 9,325 48,702 19,544 4.6 Total Non-interest income 113,492 506,599 129,168 119,512 490,079 141,627 5.0 TOTAL OPERATING INCOME 312,018 1,381,911 370,761 318,305 1,400,669 411,003 6.0 OTHER OPERATING EXPENSES - - - - - - 6.1 Loan loss provision 23,699 24,219 29,000 23,699 31,113 33,962 6.2 Staff costs 91,866 436,162 125,602 94,397 466,037 144,321 6.3 Directors’ emoluments 5,040 23,250 5,100 5,040 23,410 5,199 6.4 Rental charges 10,686 49,964 11,372 11,223 54,474 14,220 6.5 Depreciation charge on property and equipment 6,858 30,987 12,707 6,947 32,590 13,689 6.6 Amortisation charges 1,679 7,973 2,684 1,859 9,211 3,075 6.7 Other operating expenses 69,803 252,111 81,923 70,723 258,295 88,945 6.8 Total Other Operating Expenses 209,631 824,666 268,389 213,888 875,130 303,409 7.0 Profit/(loss) before tax and exceptional items 102,387 557,245 102,373 104,417 525,539 107,594 8.0 Exceptional items 9.0 Profit/(loss) after exceptional items 102,387 557,245 102,373 104,417 525,539 107,594 10.0 Current tax 30,926 130,402 30,712 30,926 147,363 30,712 11.0 Deferred tax - 2,960 - - (2,467) - 12.0 Profit/(loss) after tax and exceptional items 71,461 423,883 71,661 73,491 380,643 76,882 13.0 Other Comprehensive Income 13.1 Gains/(Losses) from translating the financial statements of foreign operations - - - - (30,808) 17,646 13.2 Fair value changes in available for sale financial assets - 69,639 (4,919) - 69,639 (4,919) 13.3 Revaluation surplus on Property , plant and equipment - - - - - - 13.4 Share of other comprehensive income of associates - - - - - - 13.5 Income tax relating to components of other comprehensive income - - - - - - 14.0 Other Comprehensive Income for the year net of tax - 69,639 (4,919) - 38,831 12,727 15.0 Total comprehensive income for the year 71,461 493,522 66,742 73,491 419,474 89,609 16.0 EARNINGS PER SHARE-BASIC & DILUTED 0.68 4.04 0.68 0.70 3.63 0.73 17.0 DIVIDEND PER SHARE-DECLARED - 0.80 - - 0.80 - III OTHER DISCLOSURES - - - - - 1.0 NON-PERFORMING LOANS AND ADVANCES - - - - - - (a) Gross Non-performing loans and advances 307,373 433,403 435,555 307,373 433,403 498,758 (b) Less: Interest in Suspense 75,910 98,308 109,490 75,910 98,308 125,164 (c) Total Non-Performing Loans and Advances(a-b) 231,463 335,095 326,065 231,463 335,095 373,594 (d) Less: Loan Loss Provision 133,987 130,326 130,326 133,987 130,326 152,272 (e) Net Non-Performing Loans and Advances(c-d) 97,476 204,769 195,739 97,476 204,769 221,322 (f) Discounted Value of Securities 97,476 204,769 195,739 97,476 204,769 221,322 (g) Net NPLs Exposure(e-f) - - - - - - 2.0 INSIDER LOANS AND ADVANCES - - - - - - (a) Directors, Shareholders and Associates 39,164 39,769 37,351 39,164 39,769 43,242 (b) Employees 94,659 161,650 172,358 94,659 161,650 172,454 (c) Total Insider Loans and Advances and other facilities 133,823 201,419 209,709 133,823 201,419 215,696 3.0 OFF-BALANCE SHEET ITEMS - - - - - - (a) Letters of credit, guarantees, acceptances 2,758,463 2,926,305 3,154,505 2,758,463 2,926,305 3,157,650 (b) Forwards, swaps and options 485,108 695,190 1,047,932 485,108 695,190 1,047,932 (c) Other contingent liabilities 976,656 305,819 441,701 976,656 305,819 441,701 (d) Total Contingent Liabilities 4,220,227 3,927,314 4,644,138 4,220,227 3,927,314 4,647,283 4.0 CAPITAL STRENGTH - - - - - - (a) Core capital 1,567,118 1,644,815 1,475,008 1,567,118 1,644,815 1,475,008 (b) Minimum Statutory Capital 700,000 1,000,000 1,000,000 700,000 1,000,000 1,000,000 (c) Excess/ (Dificiency)(a-b) 867,118 644,815 475,008 867,118 644,815 475,008 (d) Supplementary Capital 67,780 94,022 94,022 67,780 94,022 94,022 (e) Total Capital(a+d) 1,634,898 1,738,837 1,569,030 1,634,898 1,738,837 1,569,030 (f) Total risk weighted assets 9,800,142 12,078,548 11,490,652 9,800,142 12,078,548 11,490,652 (g) Core Capital/Total deposits Liabilities 13.76% 10.78% 9.41% 13.76% 10.78% 9.41% (h) Minimum statutory Ratio 8.0% 8.0% 8.0% 8.0% 8.0% 8.0% (I) Excess/(Deficiency)(g-h) 5.8% 2.8% 1.4% 5.8% 2.8% 1.4% (j) Core Capital/total risk weighted assets 16.0% 13.6% 12.8% 16.0% 13.6% 12.8% (k) Minimum StatutoryRatio 8.0% 8.0% 8.0% 8.0% 8.0% 8.0% (l) Excess(Deficiency)(j-k) 8.0% 5.6% 4.8% 8.0% 5.6% 4.8% (m) Total Capital/total risk weighted assets 16.7% 14.4% 13.7% 16.7% 14.4% 13.7% (n) Minimum statutory Ratio 12.0% 12.0% 12.0% 12.0% 12.0% 12.0% (o) Excess/(Deficiency)(m-n) 4.7% 2.4% 1.7% 4.7% 2.4% 1.7% 14 LIQUIDITY - - - - - - 14.1 (a) Liquidity Ratio 38.0% 42.5% 45.7% 38.0% 42.5% 45.7% 14.2 (b) Minimum Statutory Ratio 20.0% 20.0% 20.0% 20.0% 20.0% 20.0% 14.3 (c) Excess(Deficiency)(a-b) 18.0% 22.5% 25.7% 18.0% 22.5% 25.7% UNAUDITED FINANCIAL STATEMENTS AND OTHER DISCLOSURES AS AT 31ST MARCH 2013 AUTHORIZATION: The above financial statements and disclosures are extracts of unaudited financial records of the bank. MESSAGE FROM THE DIRECTORS: The financial statements are extracts from the books of the institution. The complete set of quarterly financial statements, statutory and qualitative disclosures can be accessed on the institution’s website www.abcthebank.com. They may also be accessed at the institution’s head office located at Mezzanine Floor, ABC Bank Koinange Street. Signed: Shamaz Savani MANAGING DIRECTOR Joseph K. Muiruri DIRECTOR