
Recomendados
Recomendados
Más contenido relacionado
La actualidad más candente
La actualidad más candente (20)
Similar a Criteria exemplary20 pointsaccomplished17 pointsdevelopin
Similar a Criteria exemplary20 pointsaccomplished17 pointsdevelopin (20)
Más de AMMY30
Más de AMMY30 (20)
Último
Último (20)
Criteria exemplary20 pointsaccomplished17 pointsdevelopin
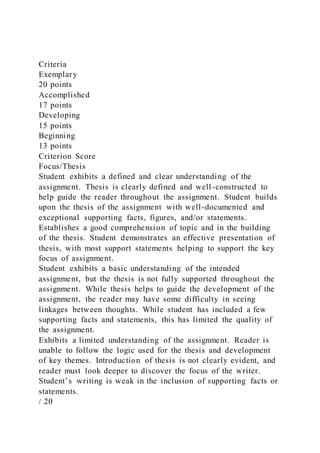
- 1. Criteria Exemplary 20 points Accomplished 17 points Developing 15 points Beginning 13 points Criterion Score Focus/Thesis Student exhibits a defined and clear understanding of the assignment. Thesis is clearly defined and well-constructed to help guide the reader throughout the assignment. Student builds upon the thesis of the assignment with well-documented and exceptional supporting facts, figures, and/or statements. Establishes a good comprehension of topic and in the building of the thesis. Student demonstrates an effective presentation of thesis, with most support statements helping to support the key focus of assignment. Student exhibits a basic understanding of the intended assignment, but the thesis is not fully supported throughout the assignment. While thesis helps to guide the development of the assignment, the reader may have some difficulty in seeing linkages between thoughts. While student has included a few supporting facts and statements, this has limited the quality of the assignment. Exhibits a limited understanding of the assignment. Reader is unable to follow the logic used for the thesis and development of key themes. Introduction of thesis is not clearly evident, and reader must look deeper to discover the focus of the writer. Student’s writing is weak in the inclusion of supporting facts or statements. / 20
- 2. Content/Subject Knowledge Student demonstrates proficient command of the subject matter in the assignment. Assignment shows an impressive level of depth of student’s ability to relate course content to practical examples and applications. Student provides comprehensive analysis of details, facts, and concepts in a logical sequence. Student exhibits above average usage of subject matter in assignment. Student provides above average ability in relating course content in examples given. Details and facts presented provide an adequate presentation of student’s current level of subject matter knowledge. The assignment reveals that the student has a general, fundamental understanding of the course material. There are areas of some concerning in the linkages provided between facts and supporting statements. Student generally explains concepts, but only meets the minimum requirements in this area. Student tries to explain some concepts, but overlooks critical details. Assignment appears vague or incomplete in various segments. Student presents concepts in isolation, and does not perceive to have a logical sequencing of ideas. / 20 Critical Thinking Skills Student demonstrates a higher-level of critical thinking necessary for 300-400 level work. Learner provides a strategic approach in presenting examples of problem solving or critical thinking, while drawing logical conclusions which are not immediately obvious. Student provides well-supported ideas and reflection with a variety of current and/or world views in the assignment. Student presents a genuine intellectual development of ideas throughout assignment. Student exhibits a good command of critical thinking skills in the presentation of material and supporting statements. Assignment demonstrates the student’s above average use of relating concepts by using a variety of factors. Overall, student provides adequate conclusions, with two or fewer errors. Student takes a common, conventional approach in guiding the
- 3. reader through various linkages and connections presented in assignment. However, student presents a limited perspective on key concepts throughout assignment. Student appears to have problems applying information in a problem-solving manner. Student demonstrates beginning understanding of key concepts, but overlooks critical details. Learner is unable to apply information in a problem-solving fashion. Student presents confusing statements and facts in assignment. No evidence or little semblance of critical thinking skills. / 20 Organization of Ideas/Format Student thoroughly understands and excels in explaining all major points. An original, unique, and/or imaginative approach to overall ideas, concepts, and findings is presented. Overall format of assignment includes an appropriate introduction (or abstract), well- developed paragraphs, and conclusion. Finished assignment demonstrates student’s ability to plan and organize research in a logical sequence. Student uses required number of academic sources or beyond. Student explains the majority of points and concepts in the assignment. Learner demonstrates a good skill level in formatting and organizing material in assignment. Student presents an above average level of preparedness, with a few formatting errors. Assignment contains number of academic sources required in assignment. Learner applies some points and concepts incorrectly. Student uses a variety of formatting styles, with some inconsistencies throughout the paper. Assignment does not have a continuous pattern of logical sequencing. Student uses fewer sources or references than required by assignment. Academic sources are lacking. Assignment reveals formatting errors and a lack of organization. Student presents an incomplete attempt to provide linkages or explanation of key terms. The lack of appropriate references or source materials demonstrates the student’s need for additional help or training in this area. Student needs to review and revise
- 4. the assignment. / 20 Writing Conventions Student demonstrates an excellent command of grammar, as well as presents research in a clear and concise writing style. Presents a thorough and extensive understanding of word usage. Student excels in the selection and development of a well - planned research assignment. Assignment is error-free and reflects student’s ability to prepare a high-quality academic assignment. Student provides an effective display of good writing and grammar. Assignment reflects student’s ability to select appropriate word usage and present an above average presentation of a given topic or issue. Assignment appears to be well written with no more than three-five errors. Student provides a final written product that covers the above-minimal requirements. Assignment reflects basic writing and grammar, but more than five errors. Key terms and concepts are somewhat vague and not completely explained by student. Student uses a basic vocabulary in assignment. Student’s writing ability is average, but demonstrates a basic understanding of the subject matter. Topics, concepts, and ideas are not coherently discussed or expressed in assignments. Student’s writing style is weak and needs improvement, along with numerous proofreading errors. Assignment lacks clarity, consistency, and correctness. Student needs to review and revise assignment. / 20 745 PHYSICAL ACTIVITY
- 5. Effect of Body Composition, Physical Activity, and Aerobic Fitness on the Physical Activity and Fitness Knowledge of At-Risk Inner-City Children Timothy A. Brusseau, Ryan D. Burns, James C. Hannon Abstract SHAPE America has highlighted the importance of developing physically literate children as part of quality physical education pro- gramming. Unfortunately, most children know little about physical activity and health-related fitness. The purpose of this study was to examine the physical activity and fitness content knowledge of at-risk inner-city children and determine if students who accumulate more physical activity, do more PACER laps, and/or have a lower BMI have higher levels of knowledge. Participants included 569 inner -city chil- dren (300 girls, 269 boys) from the Southwest USA who completed the PE Metrics knowledge test, wore a pedometer for 1 school week, completed the PACER test, and had their height and weight measured. Two-way and three-way factorial ANOVA tests were used to exam- ine potential differences between genders, between grades, and among
- 6. tertiles of physical activity and health-related fitness performance on the PE Metrics knowledge test. On average, students scored 38% on the PE Metrics knowledge test. Boys and girls scored similarly, sixth Timothy A. Brusseau is assistant professor, Department of Health, Kinesiology, and Recreation, University of Utah. Ryan D. Burns is postdoctoral research associate, Department of Health, Kinesiology, and Recreation, University of Utah. James C. Hannon is professor, Department of Coaching and Teaching Studies, West Virginia University. Please send author correspondence to [email protected] The Physical Educator Vol. 73 • pp. 745–756 • 2016 https://doi.org/10.18666/TPE-2016-V73-I4-6570 746 Body Composition, Physical Activity, and Aerobic Fitness graders scored lower than fourth and fifth graders, and children who were in the low and high BMI tertiles scored higher than children in the medium tertile (p < 0.05). As school day step counts and PACER laps increased, knowledge scores trended higher. At-risk youth need additional opportunities to learn content knowledge related to physical activity and fitness. Increased physical activity and aerobic fitness were
- 7. related to small increases in knowledge scores. Future interventions should focus on child behavior and knowledge. One of the objectives of physical education programs is to devel- op physically literate children who possess the knowledge and skills to participate in activity for a lifetime (Society of Health and Physical Educators, 2013). Knowledge about physical activity (PA) and physi- cal fitness has been highlighted as important for individuals to be active for a lifetime (Zhu, Safarit, & Cohen, 1999). Studies have sug- gested that children do not have the requisite knowledge needed to adopt healthy behaviors (Desmond, Price, Smith, Smith, & Stewart, 1990; Hopple & Graham, 1995; Keating, Chen, Guan, Harrison, & Dauenhauer, 2009; Liang et al., 1993; Prewitt et al., 2015). More specifically, Kulinna (2004) examined this in an elementary school with the use of health-related knowledge portfolio tasks. The author discovered that the students lacked strong content knowledge; for example, more than 50% of the third to sixth grade students were unable to list four aerobic activities. Brusseau, Kulinna, and Cothran (2011) further examined students’ knowledge using similar portfolio tasks with two American Indian communities. Students
- 8. completed health-related fitness and PA behavior portfolio tasks, and the results indicated that students across all grade levels held many misconcep- tions and misunderstandings of these concepts. Furthermore, re- searchers found that only 7% of third grade students were able to de- scribe why PA is important. More recently, Hodges, Hodges Kulinna, and Lee (2014) found that the average score for over 700 suburban fifth graders was under 50% on the PE Metrics (National Association for Sport and Physical Education [NASPE], 2010) PA and fitness test. The evidence on students’ lack of knowledge is disappointing given that these findings have been evident for 2 decades (Hopple & Graham, 1995). Spiegel and Foulk (2006) suggested that knowledge of PA be- haviors can be the foundation that encourages people to engage in Brusseau, Burns, Hannon 747 more PA throughout their lifetimes. This was found to contain some validity, as other researchers have found that individuals engaging in more activity during leisure time had greater knowledge (Dale,
- 9. Corbin, & Cuddihy, 1998; DiLorenzo, Stucky-Ropp, Vander Wal, & Gotham, 1998). DiLorenzo et al. (1998) discovered that exercise knowledge is one of a few key determinants to students’ PA partici- pation. Furthermore, conceptual-based physical education (CPE), a model that teaches health knowledge in the classroom partnered with PA opportunities, has also been found to influence PA patterns positively during leisure time (Dale et al., 1998). More specifically, they reported that after a yearlong CPE program, secondary students significantly increased their PA levels when compared to students with both traditional PE and control students. Therefore, to date the literature has begun to suggest that if students gain additional knowledge, they often engage in more PA. Despite this, little effort has been made to explore the relationship, if any, between knowledge and body composition or aerobic fitness. Therefore, the purpose of this manuscript was to determine if PA patterns (steps counts), aer- obic fitness (PACER), or BMI had an effect on the fitness and PA content knowledge of ethnically diverse elementary school children from low-income and inner-city families. It was hypothesized that children who accumulated more steps, had higher PACER
- 10. scores, and lower BMI would score better on the PE Metrics fitness and PA knowledge test. A secondary purpose was to explore differences on PE Metrics performance by grade and gender. Method Participants Participants were 569 (300 girls, 269 boys) fourth to sixth grade students from three inner-city Title 1 schools. Ninety-four percent of participating youth came from low-income (83% free and 11% reduced lunch) families, and the sample was 86% ethnic minority —63% Hispanic, 14% Caucasian, 7% Pacific Islander, 6% Black, 5% Asian, 3% American Indian, and 2% multiracial. Instruments Physical activity and physical fitness knowledge test. SHAPE America endorses the PE Metrics (NASPE, 2010) test, which was 748 Body Composition, Physical Activity, and Aerobic Fitness used to examine PA and physical fitness knowledge in this study. The instrument has been suggested as a valid and reliable assessment
- 11. tool (Dyson & Williams, 2012; Zhu et al., 2011) and has been used in research (Hodges et al., 2014) with this age group. More specifically, the research team used the Standards 3 and 4 fifth grade test that contained 28 multiple-choice questions, of which 15 were randomly selected to fit the time frame for testing the children at the beginning of a physical education class. Pedometers. PA was measured using Yamax DigiWalker CW600 pedometers (Tokyo, Japan). The devices were worn for 5 school days (Monday through Friday) between the hours of 8 a.m. and 3 p.m. Instruments were worn on the hip at the level of the iliac crest above the knees on the right hip. Classroom teachers, physical educators, and members of the research team ensured that the devices were worn the entire school day. The pedometers included a 7-day memory that was used to re- cord steps each day of the school week. Yamax DigiWalker models have been shown to provide an accurate recording of steps within ± 3% of actual steps (Schneider, Crouter, Lukajic, & Bassett, 2003), and have been shown to be a valid measure of free-living PA (Crouter, Schneider, Karbulut, & Bassett, 2003). Health-related fitness. BMI was calculated using standard pro-
- 12. cedures taking a student’s weight in kilograms divided by the square or his or her height in meters. Height was measured to the nearest 0.01 m using a portable stadiometer (Seca 213; Hanover, MD, USA), and weight was measured to the nearest 0.1 kg using a portable med- ical scale (BD-590; Tokyo, Japan). Height and weight were collected in the hallway during each student’s physical education class. Aerobic fitness was measured using the 20-m Progressive Aerobic Cardiovascular Endurance Run (PACER), administered during each student’s physical education class. The PACER was conducted on a marked gymnasium floor with background music provided by a compact disc. Each student was instructed to run from one floor marker to another floor marker across a 20-m distance within an al- lotted time frame. The allotted time given to reach the specified dis- tance incrementally shortened as the test progressed. If the student twice failed to reach the other floor marker, the test was terminated (Meredith & Welk, 2010). The final score was recorded in laps. Brusseau, Burns, Hannon 749 Procedures
- 13. During three consecutive weeks during the winter of 2015, re- search team members worked with physical education teachers to collect PACER scores and height and weight during class. Half the class completed the PACER with one research team member, and the other half played a game with the physical education teacher, with students being called out to have their height and weight measured. Approximately halfway through class, the groups switched stations (no order effect was found between students who tested first and students who tested second). During a separate class, members of the research team administered the knowledge assessment test fol- lowing a specific protocol during which each question and answer was read to the students, with an approximately 20–30-s wait time for each question. Analyses BMI, PACER, and pedometer steps were stratified into tertiles of approximately equal number. The preliminary descriptive analysis included running a 2 × 3 factorial ANOVA test to examine the differ- ences between genders and among grade levels on PA, health- related
- 14. fitness, and the PE Metrics knowledge test scores. The alpha level was adjusted using the Bonferroni method to account for analysis on multiple dependent variables. The primary analysis consisted of a 3 × 3 × 3 factorial ANOVA test to examine differences among tertiles of BMI, PACER, and pedometer steps on the PE Metrics knowledge scores. A Tukey post hoc test was employed for any statistically sig- nificant main effects from the three-way ANOVA. All analyses had an initial alpha level of p ≤ 0.05 and were carried out using STATA (14.0) statistical software package (College Station, TX, USA). Results On average, students scored 38% on the PE Metrics knowledge test. Table 1 highlights the means and standard deviations on the PE Metrics knowledge test (raw score out of 15) by gender, grade level, and tertile groupings for PA and health-related fitness. A statisti- cally significant main effect was found for grade level on knowledge test scores, F(2, 180) = 3.89, p = 0.02. Tukey post hoc tests revealed that children in Grades 4 and 5 scored higher on the knowledge test
- 15. 750 Body Composition, Physical Activity, and Aerobic Fitness compared to children in Grade 6. A statistically significant main ef- fect was also found for BMI on PA knowledge, F(2, 180) = 3.64, p = 0.03. Post hoc tests revealed that children in the high BMI tertile and children in the low BMI tertile scored higher on the PA knowledge test compared to children in the medium BMI tertile. No other main effects were found, but there were trends that children with high- er PACER scores and who accumulated higher step counts scored higher on the PE Metrics knowledge test. Table 1 Knowledge Scores by Gender, Grade, Physical Activity, Aerobic Fitness, and BMI Category Knowledge score SD 95% CI Gender Male 5.69 3.34 5.29, 6.09 Female 5.83 2.84 5.51, 6.15 Combined 5.77 3.06 5.52, 6.02 Grade 4 6.02 2.99 5.59, 6.45 5 6.07 2.99 5.64, 6.50
- 16. 6* 4.34 3.10 3.90, 4.78 School Step Counts High 5.75 2.68 5.37, 6.12 Medium 5.57 2.98 5.15, 5.99 Low 5.22 2.73 4.83, 5.60 PACER Laps High 5.82 3.11 5.38, 6.46 Medium 5.75 3.36 5.27, 6.22 Low 5.41 2.7 5.03, 5.79 BMI High 6.31 3.07 5.87, 6.75 Medium* 4.93 2.93 4.72, 5.14 Low 6.13 3.09 5.91, 6.35 *Significantly different when compared to other groups. Brusseau, Burns, Hannon 751 Discussion Similar to children in previous research (Brusseau, Kulinna, & Cothran, 2011; Kulinna, 2004), the children in this study lacked overall content knowledge. In fact, the average score was 38.5%. These scores are lower than those in the previous study in which PE Metrics was used (Hodges et al., 2014) and indicate lower knowl- edge when compared across other studies (Hopple & Graham, 1995; Kulinna, 2004). These scores are concerning, especially
- 17. considering the lack of PA in low-income inner-city youth (Trost et al., 2013). Although we know that PA decreases with age and grade, we an- ticipated that as students advanced in grade, they would have per- formed better on the knowledge test simply by accumulating more knowledge over time. We found that fourth and fifth graders per- formed similarly on the test and sixth graders scored significantly lower compared to the earlier grades, which we believe might be re- lated to the sixth graders feeling they were “too cool” to take the test and not taking it as seriously as the younger students did. There were no significant differences by gender, which is similar to results in previous research (Brusseau, Kulinna, & Cothran, 2011). This is im- portant because the literature (Harmon, Brusseau, Collier, & Lenz, 2013) makes it clear that inner-city ethnic minority boys at this age are more active than girls. Furthermore, boys outperformed girls on the PACER, which correlates to previous studies of aerobic fitness in at-risk youth (Brusseau, Finkelstein, Kulinna, & Pangrazi, 2014). It appears as if knowledge does not help to alleviate the natural gender
- 18. difference in PA or aerobic fitness, as boys were more active and fit in the current sample (5,194 steps and 40.3 PACER laps for boys; 4,498 steps and 34.4 PACER laps for girls; Δ = 696 steps, Δ = 5.9 laps). Our findings suggest that knowledge is not dependent on either grade or gender. It is important to note that these three schools did not offer any type of health education and that this content (health- related fitness and PA) was not directly covered in academic subjects, al- though science classes did cover material related to the health of the human body. Furthermore, physical education was a traditional model that only met 1 day/week. Because of the time constraints, the physical education paraprofessionals focused exclusively on trying to get children active during class. Another potential issue is that classes were taught by paraprofessionals. Research has started to in- 752 Body Composition, Physical Activity, and Aerobic Fitness dicate that classes taught by nonspecialists result in less PA (Hannon, Destani, McGladrey, Williams, & Hill, 2013) and in more time man- aging children (Hall, Larson, Heinemann, & Brusseau, 2015). It
- 19. ap- pears to be important for schools (especially inner-city schools) to find a way to incorporate content knowledge related to PA and fit- ness. Of importance to our findings were the small (but not signifi - cant) trends that the more active the child, the better he or she per- formed on the knowledge test. We anticipated these findings; how- ever, we would have expected a much larger change score. Out of 15 questions, the difference between the low active group and the high active group was only a half question. These findings contradict the previous explorations, suggesting increased knowledge is related to significantly increased PA (i.e., DiLorenzo et al., 1998). Similar to the step count trends with knowledge, knowledge slightly increased with increases in PACER laps. This change again was small, < .5 question. To our knowledge, this is the first study to look at differences in fitness content knowledge in comparison to actual aerobic fitness. Aerobic fitness is an important compo- nent for the health (Janssen & LeBlanc, 2010) and the cognition (Chaddock-Heyman, Hillman, Cohen, & Kramer, 2014) of children, and we suggest that improved knowledge of this concept can only help with changing the needed behavior.
- 20. Body composition did not relate to increases in knowledge, which differs from the role that body composition has in the litera- ture in which both PA (Brusseau, Kulinna, Tudor-Locke, et al., 2011) and physical fitness (Stratton et al., 2007) improve when children’s BMI decreases. This might be associated with the overall increases in BMI (Ogden, Carroll, Kit, & Flegal, 2012) in youth and the concept that youth can be fat and fit (Hainer, Toplak, & Stich, 2009). Future research needs to replicate our work with children from different ethnic and socioeconomic backgrounds to help make the findings more generalizable. Similarly, it is clear that content knowl- edge needs to be targeted in research and practical programming in schools to address the concerning findings of our work. Brusseau, Burns, Hannon 753 Conclusion In conclusion, at-risk inner-city children in this sample lacked PA and fitness knowledge. Although the lack of knowledge is not new, the low scores compared to those in previous research is espe- cially alarming considering that these children often lack the access
- 21. and opportunity to become physically active, which have been con- sistently shown as barriers to activity (Sallis, Prochaska, & Taylor, 2000). Increased opportunities for PA and improved knowledge should be considered when planning future interventions. References Brusseau, T. A., Finkelstein, T., Kulinna, P. H., & Pangrazi, C. (2014). Health-related fitness of American Indian youth. Research Quarterly for Exercise and Sport, 85, 257–261. https://doi.org/10. 1080/02701367.2014.893050 Brusseau, T. A., Kulinna, P. H., & Cothran, D. J. (2011). Physical activity content knowledge of Native American children. The Physical Educator, 68, 66–77. Brusseau, T. A., Kulinna, P. H., Tudor-Locke, C., Ferry, M., van der Mars, H., & Darst, P. W. (2011). Pedometer-determined segmented physical activity patterns of fourth- and fifth-grade children. Journal of Physical Activity and Health, 8(2), 279. https://doi.org/10.1123/jpah.8.2.279 Chaddock‐ Heyman, L., Hillman, C. H., Cohen, N. J., & Kramer, A. F. (2014). III. The importance of physical activity and aerobic fitness for cognitive control and memory in children. Monographs of the Society for Research in Child Development, 79(4), 25–50. https:// doi.org/10.1111/mono.12129
- 22. Crouter, S. E., Schneider, P. L., Karabulut, M., & Bassett, D. R. (2003). Measuring steps, distance, and energy cost. Medicine & Science in Sports & Exercise, 35, 1455–1460. https://doi.org/10.1249/01. MSS.0000078932.61440.A2 Dale, D., Corbin, C. B., & Cuddihy, T. F. (1998) Can conceptual physical education promote physically active lifestyles? Pediatric Exercise Science, 10, 97–109. https://doi.org/10.1123/pes.10.2.97 Desmond, S. M., Price, J. H., Smith, R. S., Smith, D., & Stewart, P. W. (1990). Urban Black and White adolescents’ physical fitness status and perceptions of exercise. Journal of School Health, 60, 313–314. https://doi.org/10.1111/j.1746-1561.1990.tb05919.x 754 Body Composition, Physical Activity, and Aerobic Fitness Dilorenzo, T. M., Stucky-Ropp, R. C., Vander Wal, J. S., & Gotham, H. J. (1998). Determinants of exercise among children: A lon- gitudinal analysis. Preventive Medicine, 27, 470–477. https://doi. org/10.1006/pmed.1998.0307 Dyson, B. P., & Williams, L. H. (2012). The role of PE Metrics in physical education teacher education. Journal of Physical Education, Recreation, & Dance, 83(5), 29–32. https://doi.org/1
- 23. 0.1080/07303084.2012.10598777 Hainer, V., Toplak, H., & Stich, V. (2009). Fat or fit: What i s more important? Diabetes Care, 32(Suppl. 2), S392–S397. https://doi. org/10.2337/dc09-S346 Hall, A., Larson, J. N., Heinemann, A., & Brusseau, T. A. (2015). Frequency and type of reinstruction strategies used by paraprofessionals and licensed teachers in elementary physical education settings. The Physical Educator, 72, 433–444. Hannon, J. C., Destani, F., McGladrey, B., Williams, S., & Hill, G. (2013). Physical activity levels, lesson contexts, and teacher behaviors in elementary physical education classes taught by paraeducators. International Journal of Elementary Education, 2, 23–26. https://doi.org/10.11648/j.ijeedu.20130203.11 Harmon, J., Brusseau, T. A., Collier, D., & Lenz, E. (2013). Habitual physical activity patterns of inner-city children. Human Movement, 14, 305–309. https://doi.org/10.2478/humo-2013- 0036 Hodges, M., Hodges Kulinna, P., & Lee, C. (2014). Teaching healthy behaviour knowledge in primary school physical education. Biomedical Human Kinetics, 6(1), 33–39. https://doi.org/10.2478/ bhk-2014-0006 Hopple C., & Graham, G. (1995). What children think, feel, and
- 24. know about physical fitness testing. Journal of Teaching in Physical Education, 14, 408–417. https://doi.org/10.1123/jtpe.14.4.408 Janssen, I., & LeBlanc, A. G. (2010). Systematic review of the health benefits of physical activity and fitness in school-aged children and youth. International Journal of Behavioral Nutrition and Physical Activity, 7. https://doi.org/10.1186/1479-5868-7-40 Keating, X. D., Chen, L., Guan, J., Harrison, L., & Dauenhauer, B. (2009). Urban minority 9th grade pupils’ health-related fitness knowledge. Research Quarterly for Exercise and Sport, 80, 747– 755. https://doi.org/10.1080/02701367.2009.10599616 Brusseau, Burns, Hannon 755 Kulinna, P. H. (2004). Physical activity and fitness knowledge: How much 1–6 grade pupils know? International Journal of Physical Education, 41, 111–121. Liang, M. T., Dombrowski, H. T., Allen, T. W., Chang, C. O., Andriulli, J., Bastianelli, M., & Norris, S. D. (1993). Do medical pupils’ knowledge and attitudes about health and exercise affect their physical fitness? Journal of American Osteopathic Association, 93, 1020–1024. Meredith, M. D., & Welk, G. J. (2010). Fitnessgram/Actvitygram test administration manual (4th ed.). Champaign, IL: Human Kinetics.
- 25. National Association for Sport and Physical Education. (2010). PE Metrics: Assessing national standards 1–6 in elementary school. Reston, VA: Author. Ogden, C. L., Carroll, M. D., Kit, B. K., & Flegal, K. M. (2012). Prevalence of obesity and trends in body mass index among US children and adolescents, 1999–2010. JAMA, 307, 483–490. https://doi.org/10.1001/jama.2012.40 Prewitt, S. L., Hannon, J. C., Colquitt, G., Brusseau, T. A., Newton, M., & Shaw, J. (2015). Effect of personalized system of instruction on health-related fitness knowledge and class time physical activity. The Physical Educator, 72, 23–39. https://doi.org/10.18666/tpe- 2015-v72-i5-6997 Sallis, J. F., Prochaska, J. J., & Taylor, W. C. (2000). A review of correlates of physical activity of children and adolescents. Medicine & Science in Sports & Exercise, 32, 963–975. https:// doi.org/10.1097/00005768-200005000-00014 Schneider, P. L., Crouter, S. E., Lukajic, O., & Bassett, D. R. (2003). Accuracy and reliability of 10 pedometers for measuring steps over a 400-m walk. Medicine & Science in Sports & Exercise, 35, 1779–1784. https://doi.org/10.1249/01.MSS.0000089342.96098. C4 Society of Health and Physical Educators. (2013). National
- 26. standards for K–12 physical education. Reston, VA: Author. Spiegel, S. A., & Foulk, D. (2006) Reducing overweight through a multidisciplinary school-based intervention. Obesity, 14, 88–96. https://doi.org/10.1038/oby.2006.11 756 Body Composition, Physical Activity, and Aerobic Fitness Stratton, G., Canoy, D., Boddy, L. M., Taylor, S. R., Hackett, A. F., & Buchan, I. E. (2007). Cardiorespiratory fitness and body mass index of 9–11-year-old English children: A serial cross- sectional study from 1998 to 2004. International Journal of Obesity, 31, 1172–1178. https://doi.org/10.1038/sj.ijo.0803562 Trost, S. G., McCoy, T. A., Vander Veur, S. S., Mallya, G., Duffy, M. L., & Foster, G. D. (2013). Physical activity patterns of inner-city elementary schoolchildren. Medicine & Science in Sports & Exercise, 45, 470–474. https://doi.org/10.1249/ MSS.0b013e318275e40b Zhu, W., Rink, J., Placek, J. H., Graber, K. C., Fox, C., Fisette, J. L., . . . Raynes, D. (2011). PE Metrics: Background, testing theory, and methods. Measurement in Physical Education and Exercise Science, 15(2), 87–99. https://doi.org/10.1080/109136 7X.2011.568363 Zhu, W., Safarit, M., & Cohen, A. (1999). The national health- related
- 27. physical fitness knowledge test: FitSmart test user manual (High school ed.). Champaign, IL: Human Kinetics. Copyright of Physical Educator is the property of Sagamore Publishing and its content may not be copied or emailed to multiple sites or posted to a listserv without the copyright holder's express written permission. However, users may print, download, or email articles for individual use.