
Recomendados
Recomendados
Más contenido relacionado
La actualidad más candente
La actualidad más candente (18)
Similar a Greece youth unemployment
Similar a Greece youth unemployment (20)
Más de Brave Skills
Más de Brave Skills (15)
Último
Último (20)
Greece youth unemployment
- 1. Youth Unemployment in Greece: Measuring the Challenge David N.F. Bell Division of Economics Stirling Management School, University of Stirling, IZA and CPC David G. Blanchflower Bruce V. Rauner Professor of Economics, Department of Economics, Dartmouth College, Division of Economics, Stirling Management School, University of Stirling, Peterson Institute for International Economics, IZA, CESifo and NBER Paper presented at the Stavros Niarchos Foundation conference: Recharging the Youth: an international conference on the global youth unemployment crisis and the need for collective action New York, April 3 & 4 2014 Abstract An historically high level of youth unemployment presents Greece with a huge social and economic challenge. This paper analyses various dimensions of this challenge. We argue that, though the conventional definition of “youth” is the 16-24 age group, there is a strong case for considering 25-29 year olds as sharing common problems with conventionally defined youth. There are also grounds for examining why females seem to fare worse than males in the Greek labor market. The negative effects of the recession on Greek well-being has affected all age groups. Keywords Unemployment, Youth, Labor Market, Well-being, Happiness, Life Satisfaction, Great Recession
- 2. 1 1. Introduction Youth unemployment is one of the principal economic and social problems of this decade. It has grown rapidly since the onset of the Great Recession. In a European context its growth has been concentrated in Southern Europe and particularly in Greece and Spain where more than half of young people in the labor force are unemployed (Table 1). At the time of writing the average youth unemployment rate in the European Union is 23.4% and 24.0% in the Eurozone but over 50% in Spain (54.6%) and Greece (59.0%). In total there are 5.56 million people under the age of twenty five in Europe who are unemployed. Of these 16% are in Spain and the UK, 13% are France and 12% are in Italy; only 3% or 173,000 are in Greece; 2.3% are in Portugal (130,000). Youth unemployment has been the subject of three major NBER studies by Freeman and Wise (1984), Freeman and Rogers (2000) and Blanchflower and Freeman (2004), where major figures in Labor Economics have given their views on how the youth labor market works and what to do about youth unemployment. The most important finding from these studies is that long spells of unemployment when you are young creates permanent scars rather than temporary blemishes. Bell and Blanchflower (2011a, 2011b) find similar results in the UK in the current recession. Has anything changed since those studies? Youth joblessness has been a problem in many countries for several decades. It has been the subject of a wide range of policy interventions. Yet the accumulated wealth of policy experience failed to prevent a rapid rise in youth unemployment during the so-called “Great Recession”. The rise was especially marked in Ireland, Portugal, Spain and Greece and, as we show below, in the Great Recession it has reached unprecedented levels. This raises serious questions about the relevance of past policy lessons to the present predicament of the youth labor market. Should we discount these past lessons, and what can we learn about future policy from recent experience? Changes in educational participation influence the size of the youth labor market, and therefore youth unemployment rates. Thus, voluntary or mandatory increases in educational participation could potentially increase the youth unemployment rate without any increase in the number of young people seeking work. On the other hand, increased educational participation might have no effect on the youth unemployment rate. This is because many students, particularly part- timers, actively participate in the labor market. In addition, the youth unemployment rate does not include those young people who neither participate in the labor market, nor in education. The so-called NEETs (young people not in education, employment or training) are drawn from both unemployed and inactive youth. The worsening labor market performance of youth became apparent in the 1970s. Freeman (1979), Welch (1979) and Berger (1984) argued that its genesis lay with the substantial increase in supply associated with the entry of the baby boomers into the labor market in the 1970s. But instead of improving as cohort size declined, the relative labor market performance of young people worsened during the 1980s and 1990s. Higher unemployment was accompanied by an increase in the wage gap between adults and youths, particularly during the 1980s and early 1990s. There was some recovery in the late 1990s and the early part of this century, but not to the levels of the early 1970s. There are a number of reasons why youth unemployment rates may be higher than adult rates. In
- 3. 2 the internal labor market, youths will generally have less specific human capital relevant to the particular firm for whom they work and also less general work skills. Even without a formal last-in first-out (LIFO) policy, firms may take the view that the future benefit of further investment in young workers is outweighed by its current costs. Further, liquidity concerns cause firms to seek layoffs among younger workers first, particularly where statutory redundancy payments are seniority weighted, as is the case in most countries In the external labor market, young workers may be less efficient in job search activities than adults. Younger workers are likely to have fewer contacts and less experience of finding work, placing them at a relative disadvantage compared to adults. They may also find themselves in an experience trap, where employers select workers with experience, and as a result labor market entrants are never hired and so cannot increase their own experience. On the supply side, youths are less likely to have significant financial commitments than their elders. And their parents may be willing to support them should they not find work. Such factors may create an incentive to restrict their job search activity, leading to higher rates of unemployment. Whether the cause is on the demand or the supply side, the outcome is that youths experience considerably higher rates of unemployment than adults. Active Labor Market Programmes (ALMPs) In response to the substantial increases in youth unemployment during the 1980s and early 1990s, there was a significant increase in policy initiatives targeted at unemployment in general and youth unemployment in particular. These culminated in the OECD Jobs Study (1994), which argued that policies to improve the working of the labor market were critical for reducing high levels of youth unemployment. It suggested that: “A progressive shift of resources is needed from passive income support to active measures. Active labor market policies improve access to the labor market and jobs; develop job-related skills; and promote more efficient labor markets.” (OECD Jobs Study 1994) With OECD encouragement, many member countries introduced a range of active labor market policies (ALMPs). These were extensively evaluated to determine their labor market effects. In this context, “evaluation” tends to mean comparisons between those “treated” by a particular intervention and a comparable “control” group that are not so “treated”. Such evaluations can be described as partial equilibrium in the sense that they focus on a narrow range of outcomes (e.g. difference in the probability of finding full-time employment between the treated and untreated) in distinct sub-populations of the labor force. On the other hand, models that take a broader macroeconomic perspective tend to be insufficiently disaggregated to capture the general equilibrium impacts of ALMPs. Even these partial equilibrium evaluations of ALMP impact have not shown them to be an unqualified success. Heckman and Smith (1999a, 1999b) examined the US Job Training Partnership Act (JTPA), which provided job-training services for economically disadvantaged adults and youth, dislocated workers and those facing significant employment barriers. They found that the estimates of the returns to training were sensitive to a) the set of training centers included in the evaluation b) how outliers in the earnings data are handled c) the construction of
- 4. 3 the earnings data d) control group substitution d) treatment group drop out. Even after these adjustments they conclude that their results for youth “fit comfortably into the pattern of several decades of research that finds very limited earnings effects for the types of services offered by JTPA”. In 1996, when asked by the Economist how much training schemes in the US help their clientele, Jim Heckman replied that ‘zero is not a bad number’ (Economist, 6th April, 1996). Grubb (1999) is slightly more positive when reviewing US education and training programs for disadvantaged youths. He argues that successful programs embody some combination of the following characteristics: i) close links with the local labor market, targeting jobs with relatively high wages, strong employment growth and opportunities for advancement; ii) a mix of academic education, occupational skills and on-the-job training; iii) opportunities to enter further education, to further develop skills and competencies; iv) support services, focused on the needs of clients and their families; and v) constant redesign of the program to learn from past experience. Auspos et al. (1999) conclude that European ALMPs have not produced earnings gains for participants, but argue that smaller targeted schemes aimed at disadvantaged groups are more effective in raising employment than broad-based training programs, particularly when used in conjunction with job search interventions. Successful programs tend to be costly and may be difficult to expand broadly. Bergemann, and van den Berg (2006) argue that training programs are more effective for women than men in Europe. Focussing on youth, Calmfors et al. (2002) summarize the Swedish experience of ALMPs by arguing that youth programs have caused substantial displacement effects but the gains for participants are uncertain. One of the major UK ALMPs is the New Deal for Young People (NDYP). It was established in 1998 and was aimed at those aged 18 to 24. All those in this age group that have been on Job Seekers Allowance (JSA) for more than six months enter the “Gateway” in which they are given extensive advice on how to find employment. Participation is compulsory; every eligible individual who refuses to cooperate faces a loss of entitlement to benefits. Blundell et al. (2001) show that the NDYP raises the probability of entering employment, by around 5 per cent in the short run. Although these effects are relatively small, Van Reenen (2004) calculates that the marginal social benefit of the programme exceeds its marginal social cost. Blundell et al (2004) also found that the impact of the program significantly raised transitions to employment by about 5 percent but argue that this effect may fall in the longer run. These positive effects are relatively small. However, this is one of the largest scale ALMPs with more than 2 million people entering employment via NDYP, during its existence. Card, Kluve and Weber (2009) carry out a meta-analysis of ALMPs. They examine 199 programmes drawn from 97 studies over the period 1995 to 2007. The programmes themselves are heterogeneous covering classroom and work experience, job search assistance, subsidized public and private employment programs. In the short run, the number of programs with a significantly positive outcome only exceeds those with a significantly negative outcome by a small margin. Over longer time horizons, the balance is more in favor of positive outcomes.
- 5. 4 There are also significant differences between countries in the types of programs, which succeed or fail. There is no upward trend over time in positive outcomes. The evaluations contain little information on costs, making it difficult to establish how affordable large-scale expansion of successful programs might be. The Card et al. study supports Grubb and Martin’s (OECD 2001) conclusion that, “one of the most disappointing conclusions from the evaluation literature is that almost all evaluations show that special measures are not effective for disadvantaged youths.” In 2011, the EU launched the Youth Opportunities Initiative. This was added to in December 2012 by the Youth Employment Package. This was supplemented in early 2013 with specific measures focused on helping Leitz. The youth employment package proposed a youth guarantee which the council recommended to the member states in April 2013. Specifically, the recommendation was that the member states of the European Union should "ensure that all young people under the age of 25 receive good quality offer of employment, continued education, apprenticeship or a traineeship with enough period of four months of becoming unemployed were leaving formal education." (Council of the European Union, 2013). The Council created the Youth Employment Initiative through which €6 billion will be made available to NUTS 2 regions with an youth unemployment rate above 25% in 2012. These monies have to be distributed between 2014 and 2016. The Youth Guarantee is intended to provide young people with a job, training or education over a defined period. The entitlement is generally given by public institutions such as the public employment service, sometimes acting in concert with private or third sector organisations. The role of the public employment service varies by country within Europe. In many countries, private employment agencies have an increasing role alongside the public employment service. As Kluve (2010) notes, depending on the incentive is that they face, private sector agencies are likely to focus on particular groups within the unemployed. In practice, this tends to mean that they see their market as primarily being those that are relatively easy to place, which means that the public agencies are left with the more difficult cases, which are often characterised by social and health problems. Success with such groups will depend on the professionalisation and training of PES staff. Greece is intending to implement a national youth action plan using €517 million, with the aim of benefiting up to 350,000 young people. Measures under the plan include a temporary hiring program for unemployed persons below the age of 35 in community-based work programmes. In July 2013 it introduced a youth internship and employment voucher program under the youth action plan aimed at supporting occasional training and internships for a six-month period for 45,000 people up to the age of 29. €1.2 billion is being allocated to help small and medium-sized companies meet liquidity requirements and so assist with the expansion of youth employment. It is too early to say whether any of these schemes are working or are likely to make any significant inroads into the youth unemployment problem if the main failure is a lack of aggregate demand. General conclusions on ALMPs seem to be that: Evaluations show that successful programs, which enhance the probability of finding employment, tend to target particular groups, devoting substantial resources per client and keeping the focus close to the jobs market.
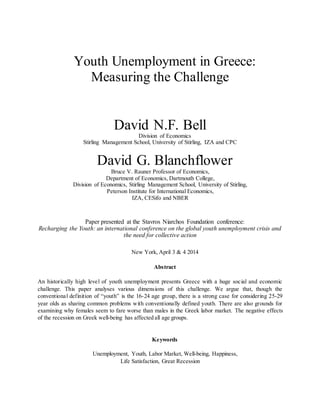
- 6. 5 Many evaluation studies show more favorable outcomes for females than for males. Positive ALMP evaluations tended to occur during periods of buoyant labor demand. Problems of deadweight loss increase when there is excess supply of labor. The effects of scaling up ALMPs that have positive labor market outcomes are uncertain. ALMPs aimed at younger people are less successful than those which target older people. Little is known about the general equilibrium effects of ALMPs. ALMPs are unlikely to work when there are no jobs available. The focus on ALMPs preceded the so-called “Great Recession”, which was associated with the financial collapse of late 2007. Most countries experienced a sharp fall in output beginning in early 2008. The demand for labor fell and unemployment increased. We show below that youth unemployment increased more rapidly than the overall level of unemployment as the recession deepened. We find very little evidence from around the world that ALMPs work well in recession: it is extremely unlikely that they will be successful, with positive rates of return, in a country where the overall unemployment rate is 28.0%. So we need to look for viable alternatives. 2. Greek youth unemployment in context; comparisons with seven other countries – France, Germany, Ireland, Portugal, Spain, Sweden and the UK. In this section we lay out some key facts on youth unemployment in Greece and place them in context. We do this from both a time-series and cross-sectional perspective. Specifically, we use aggregate data from Eurostat publications and micro-data from the 2005-2012 European Labor Force Survey to examine trends in unemployment, both in Greece itself and also in comparison with a selection of other European states. For these comparisons, we have selected Spain and Portugal as Southern European countries that, like Greece, have experienced serious monetary disturbances as well as labor market dislocation. We include the Republic of Ireland for the same reason. Though having a stable macroeconomic framework in recent years, Sweden has experienced persistently high levels of youth unemployment, especially relative to adult rates, and is included for this reason. Finally, we include the three largest countries in Europe, Germany, the UK and France to give a perspective on unemployment trends in the European Union as a whole. The conventional measure of “youth” is the age group 16-24. However, there is a strong case for arguing that the labor market experience of “young adults” aged 25-29 in 2014 is quite similar to that of youth during the Great Recession. This is appropriate because these individuals in their late twenties were 19-23 in 2008 when the recession hit. Where we can, we also include information for this age group. The age group differences are captured in Figure 1 and Figure 2, which show unemployment rates and employment to population ratios, respectively, for 15-19, 20-24 and 25-29 year olds. These capture the extent of the unemployment problem and the weakness of the Greek labor market for young people. The unemployment rates for youth in
- 7. 6 particular have captured worldwide attention and are deemed to be a potential cause of social instability. However, Figures 1 and 2 also show that the Greek labor market is not working well for 25-29 year olds. Though the increase between 2005 and 2012 in the unemployment rate of this group (22 per cent) was smaller than that of 20-24 year olds (29 per cent) and of 15-19 year olds (32 per cent), the 25-29 age group experienced the largest fall in the employment to population ratio over the period: a larger proportion of this age group became unemployed or inactive between 2005 and 2012 compared to 15-19 years olds and 20-24 year olds. Figures 1 and 2 focus on differences in labor market outcomes by age group. Table 2 contains the information which explains how differences in rates relate to the absolute numbers of employed, unemployed and inactive by age group. It also introduces the gender dimension, which is an important source of variation in the labor market experience of young people in Greece. Thus the top panel of Table 2 shows population, employment and unemployment by 5- year age group and gender for the period 2005 to 2012 in thousands. The bottom panel shows equivalent activity rates, employment to population ratios, and unemployment rates based on these numbers. Though 15-19 year olds have the highest unemployment rates in 2012 (56% for males, 79% for females), this age group has low, and declining, rates of labor market participation between 2005 and 2012. When levels of participation are low, high unemployment rates can be consistent with relatively small absolute numbers of unemployed people. This is the case for this age group. Employment to population ratios are much higher among those age 25-29, but unemployment rates are lower than among the younger age groups. With Greece, as in most developed countries, inactivity tends to decline with age up to the age of 30 as individuals move from education into the labor market. Absent information on participation, high unemployment rates may give a misleading impression of absolute levels of unemployment. Despite the fact that the unemployment rate for 25-29 year olds was only 57 per cent of that for 15-19 year olds, there were 7.7 unemployed persons aged 25-29 for each unemployed person aged 15-19 in 2012. This suggests that policy focus on the 16-24 year olds may have to be supplemented by measures aimed at 25-29 year olds to have a significant impact on unemployment among young people in Greece. The size of the youth cohort in Greece is declining. Between 2005 and 2012, numbers aged 15- 19 fell by 2.8 per cent. The number in the 20-24 age group fell by 20.5 per cent while those aged 25-29 fell by 13.4 per cent. This is a staggering decline over such a short period. It represents the effects of falling cohort size (as in the relatively immobile 15-19 year olds) and net emigration, which explains the much greater reduction in cohort size among the more mobile 20-29 year olds. It appears that there is going to be a rapid decline in the number of young people through 2020. Figure 3 illustrates, using data from the US Census Bureau where we calculate the size of the 16-24 cohort for each year from 2000 to 2020, using existing data, and assuming zero net migration.1 To this then, we know the number of ten year olds in 2000, so these will be the number of 22 year olds in 2012, and so on. It is apparent in Greece that the size of the youth cohort will be approximately one third smaller in 2020 than it was in 2000. This pattern is not repeated across every country, but is replicated in Spain and Portugal and to a lesser extent in 1 http://www.census.gov/population/international/data/idb/informationGateway.php
- 8. 7 Ireland when the numbers have now started to pick up. There is little change over these years in the size of the youth cohort in France and the United States. The size of youth cohorts, across Eastern Europe, is also in sharp decline. After reaching a peak in 2008, the size of the youth cohort in Germany, Sweden and the UK is now declining, as it is in Western Europe as a whole. Russia and China now have declining cohort sizes. In contrast, in Latin America and North Africa, youth cohort sizes are expanding at a staggering pace. There are surprising differences in population trends by gender. First, whereas numbers of males and females in the population are broadly in balance in the 15-19 and 20-24 categories, as one would expect, there appears to be a growing imbalance between those in the 25-29 age group, with the number of males exceeding females by around 40,000 in 2012. This may be due to higher levels of net emigration by females. In turn, higher emigration rates may be a response to poorer labor outcomes for females. Female activity rates and employment to population ratios are consistently lower, and unemployment rates higher, for females than for males in the Greek labor market. In 2012, the unemployment rate for females aged 15-19 was 23% above that for males, while for those aged 20-24 and 25-29, the equivalent margins were 14% and 5%. Female youth unemployment rates are significantly higher than those for males. In this respect, Greece is an outlier among our selection of nations, as is clear from Figure 4, which shows the ratio of female to male youth unemployment rates in each country for the period 2005 to 2012. It should be noted though that, in contrast to the United States and Canada, where male rates are higher than female rates, in both the EU and the Eurozone, female unemployment rates are higher than male rates; and this seems particularly the case in Southern Europe. In the latest data release from Eurostat female unemployment rates were higher than male in ten countries - Austria; Czech Republic; Greece; Hungary; Italy; Luxembourg; Poland; Portugal, Slovenia and Spain;.2 Though there is clearly a tendency towards convergence of youth unemployment rates by gender between 2015 and 2012, southern European countries typically have female youth unemployment rates that are significantly higher than their male equivalents, with Greece being the most extreme case. The ratio has narrowed since the beginning of the recession, but still exceeds those in our comparator countries. The large number of females among the unemployed may have conditioned the social and political response. The issue of the relative importance of youth unemployment is generally addressed by considering the ratio of the youth unemployment to the adult rate (where adults are usually defined as the age group from age 25 to age 64). Figure 5 shows both the youth unemployment rate and this ratio for each of our eight countries for available time periods. As mentioned previously, there are a variety of reasons why one would expect youth unemployment rates would be higher than adult rates. But there are also very substantial differences between countries in the ratio of youth to adult unemployment, which suggests a significant degree of variation between countries in the circumstances facing new entrants to the labor market compared with incumbents. It is not the case that the countries with the highest youth unemployment rates also have the highest ratios of adult to youth unemployment. In 2012, Sweden (2.9) and the UK (2.6) had somewhat higher ratios than did Greece (2.3). Spain (2.1) and Portugal (2.3) also had relatively low youth to adult unemployment rate ratios. The concern 2 http://epp.eurostat.ec.europa.eu/cache/ITY_PUBLIC/3-28022014-AP/EN/3-28022014-AP-EN.PDF
- 9. 8 is that social unrest can occur, as it has in both the UK and Sweden, where relative youth unemployment rates are especially high. It is OK if everyone is in it together but not if the young seem in much worse situation than everyone else. In the case of Sweden, the unrest occurred especially among immigrants. Students Under ILO definitions, full-time students can be employed or unemployed. Their ability to operate in the labor market is more constrained than their non-student peers. Typically they work part-time during term, or perhaps full-time during vacations. Participation in this labor market tends to focus on meeting short-term living costs, rather than long-term career aspirations. Comparisons of youth unemployment over time or across countries can be influenced by the extent of participation in tertiary education. Participation will be affected both by the supply of places and the opportunity costs of attendance. The interaction between student and labor market status is shown in Table 3, which compares labor market and educational status in Greece for simplicity with the UK in 2012. We present numbers (000s) employed, unemployed and inactive alongside the unemployment and NEET rates for the age group 15-29. We provide these estimates separately for students and non-students. It is apparent that, in Greece, few students are also participating (part-time) in the labor force, whereas this is a major phenomenon in, for example, the UK. Students who work part-time are counted as employed by standard ILO definitions; students who are looking for work are similarly counted as unemployed. Unemployment rates for students are somewhat higher than are those for non-students in both Greece and the UK. However, this has little effect on the overall unemployment rate in Greece, because relatively few students are involved in the labor market. Similar observations can be made about Portugal and Spain which have relatively high student unemployment rate that have little impact on the overall youth unemployment rate because student participation in the labor market is limited. Overall, students account for nearly double the share of employment (24.4%) in northern European countries – Sweden, the UK, Ireland, France and Germany – that they do in the southern countries – Greece, Spain and Portugal (12.5%). Lack of involvement Those Not in Employment, Education or Training (NEETS) Table 3 also provides information on NEETs – those not in employment, education or training. These comprise the unemployed plus inactive non-students. Their number can be calculated and expressed as a share of the population, which gives the NEET “rate” as shown for each country panel in Table 3. NEETs comprise a much larger share of the population in Greece than, for example, in the UK, Germany or France. NEET rates in Greece exceed those in other crisis hit countries such as Spain, Portugal and Ireland. The inactive members of this group present a more difficult policy challenge since they are not actively seeking work, not enhancing their specific or general human capital, and not improving their strategies for engagement with the labor market. The NEET rate in Greece has overtaken many other European economies. Figure 6 plots the percent of NEETS by the three young age groups 15-19; 20-24 for each of our eight countries. The percent for the youngest age group 15-19 in Greece is lower than in both Spain and Ireland, whilst the two older groups have higher percentages than any other country. The NEETs problem in Greece looks to require urgent attention, but tends to be relatively intractable. As mentioned in our discussion of ALMPs, private sector agencies tend to avoid the most hard to
- 10. 9 reach cases, and the public sector may not have the resources to support the level of intervention necessary to match such individuals with employment opportunities. Living in the Parental Home How far are the costs of unemployment or inactivity mitigated by remaining in the parental home? There are substantial differences across Europe in the extent to which parents and children are willing to share accommodation once a child has completed secondary education. Compared with other Europeans, Greeks shows a high willingness to maintain inter-generational households. Table 4 shows the relationship of individuals in the 15-24 age group that are unemployed or inactive to the household reference person before and after 2008 in Greece and the UK. We report the proportion of those aged 15-19; 20-24 and 25-29 who are not living with their parents from 2005 to 2012. We see very little change for the youngest two age groups: all the action is for the older group 25-29. In the UK, the proportion falls slightly from 81% to 80%, but in Greece it falls, from 42% to 32%. So only one out of three 25-29 year olds in Greece live away from their mummy, whereas in the UK four out of five do. In part this is likely to reflect lack of jobs but in part the inflexibility of the housing market. Blanchflower and Oswald (2012) found that the highest home ownership rates in the OECD are in Spain and Greece; unemployment appears to be positively correlated with home ownership rates. Of particular importance here then is the lack of a private rental sector that allows young people to move to where the jobs are. The housing market is a major rigidity impacting the Greek labor market, in that it appears to lower mobility. To explore these issues further, in Table 53 we compare likelihoods of living away from home among those aged 15-29 in Greece and the other seven countries by gender over the period 2005- 2012. The purpose is to investigate whether there were significant differences by age group, gender, employment status and across country in propensity to stay with parents. Assuming that parents do not move to facilitate the employment prospects of the young, the effects of staying at home may be to reduce the costs of unemployment or inactivity on the one hand, but to restrict opportunities for search on the other. We estimated probit regressions where living away from the parental home was the dependent variable. We included two age controls, whether the individual was a NEET, a student, and whether it was in the recession years of 2008-2012 plus a recession*NEET interaction term. We find that, in Greece, and to an even greater extent in Spain and Portugal, the probability of both 18-24 year old, and to a lesser extent 25-29 year olds, living with their parents is hugely higher than in the other five countries including Ireland. For example, in Greece the probability of a 25-29 year old male not living with their parents is 45% (55%) higher than for 15-19 year olds, compared with 20% (28%) in Portugal and 23% (33%) in Spain - with females rates in parentheses. So females are more likely to have left home in these three countries than males. In France, Germany and the UK around 70% of both males and females age 25-29 had left home, so in these countries there was little evidence of substantial gender differences in the home leaving rate. Table 6 explores the issue of why females ages 25- 29 are less likely than males of the same age to be living with their parents. In part this is because females are more likely to be married, although the pattern is broadly consistent across countries. 3 Sweden is not included because all relevant data were not available
- 11. 10 Lack of mobility seems to be a major issue in Greece, presumably in part due to rigidities in the housing market . Duration of Unemployment and underemployment We then turn to other dimensions of the youth unemployment problem. Figure 7 reports the share of the unemployed who have been continuously unemployed for at least a year, which are especially high in Ireland and Greece. We know from Ellwood (1984) that long spells of unemployment while young cause permanent scars rather than the temporary blemishes they cause for other age groups. Interestingly though, Figure 8 shows that the average age of the long-term unemployed is lower in the UK than in any other country, and it is lower in Greece than in France, Spain, Portugal, Sweden or Germany. Figure 9 makes clear that the highest proportion of the long-term unemployed that are female are in Greece. Table 7 shows labor market status by level of education in Greece in the pre-recession period of 2005-8 and then the subsequent recession period 2009-2012 along with changes. We report the proportion employed, unemployed and inactive. Interestingly the middle education group ISCED 4 has the highest proportion unemployed.4 As might be expected the highest education group ISCED 6, has the highest proportion employed and the smallest increase in unemployment. There is no clear gradation, though, in employment by level of qualification. More Greeks are qualified at ISCED 3 (upper secondary education) than any other level. But aside from those with no formal level of education, it accounts for the highest level of inactivity and one of the lowest levels of employment. With the exception of ISCED 6 (degree level), there has been substantial falls in employment at all educational levels during the recession with double digit rises at ISCEDS 0-1, 2 and 4. There have also been some changes in the educational composition of the cohorts through time, with a decline of 2.4 per cent in the ISCED 3 group being more than offset by an increase of 3.1 per cent in ISCED 5. The changes in this distribution indicate some limited improvement in educational standards of this age group. This clearly did not offset the negative impact of the recession on the labor market which affected all levels of education other than degree level.. Table 8 reports the results of estimating a probit equation for Greece only, where the dependent variable is set to one if the individual has been unemployed for at least a year (LTU), and 0 otherwise (employed and <1year unemployed). An unemployment equation is also reported. Separate results are reported for those ages 16-64 and then for youngsters age 16-29. There are nearly a million observations in the larger sample and just under 200,000 in the second. Controls include gender, age, education, whether these are recession years (2009-2012) and whether the respondent is from the Accession countries or some other nationality other than Greek. The recession brought higher unemployment. The main education findings in Table 6 are broadly confirmed; the most educated have the lowest probability of being unemployed or long-term unemployed, as expected. We also find foreigners have lower probabilities of both being unemployed and longer durations. As noted earlier females have higher probabilities of both 4 ISCED (International Standard Classification of Education) levels broadly correspond to: 0 - Pre-primary education; 1- Primary education or first stage of basic education; 2- Lower secondary education or second stage of basic education; 3 - Upper secondary education; 4 - Post-secondary non-tertiary education; 5 - First stage of tertiary education; 6 - Second stage of tertiary education so a higher ISCED number implies more education!
- 12. 11 being unemployed and long durations. Once characteristics are controlled for the age group 25- 29 has lower probability of both LTU and unemployment than either 20-24 year olds or 15-19 year olds. We have seen that there is a huge amount of unemployment in Greece, but there is an additional amount of underemployment. Figure 10 shows that young workers in Greece were hit by a double whammy; they couldn’t find jobs but when they could the jobs would see reductions in hours from 2005-2012 that were especially marked. Figure 11 shows that they desired more hours than they are working and hence are underutilized. This suggests there is a large amount of slack in the Greek labor market both from the unemployed and from the employed who would like to work more hours. 3. The Well-being of Greek Youth How has the well-being of the young in Greece been affected by recession? Are the effects different from previous recessions since the probability of finding a job match is now much lower? i.e. hopelessness. For earlier work on happiness and well-being see Blanchflower (2009); Blanchflower and Oswald (2004.) In Table 9 we report on well-being by country since 2000 using data from the Eurobarometer survey series conducted for the EU Commission. We report responses to a life satisfaction question asked in many but not all surveys: the specific question used is as follows - 'On the whole, are you very satisfied, fairly satisfied, not very satisfied or not at all satisfied with the life you lead?" We code the answers as 4=very satisfied, 3=fairly satisfied, 2=not very satisfied and 1= not at all satisfied. These data have previously been used in Blanchflower, et al, 2013 and Blanchflower (2009). Sample sizes are approximately 1000 per country per year. We report results for the average of the pre recession years of 2000-2007 (pre-recession) and 2008-2012 (post-recession) to ensure adequate sample sizes. We report overall results for the country as a whole and then separately for three age groups 15-24; 25-29 and 30+. The main results are as follows: The happiest countries both pre and post recession are from Northern Europe. In order pre- recession the happiest countries were Denmark (3.60); Netherlands (3.37) and Sweden (3.36). Post-recession the happiest were Denmark (3.65); Netherlands (3.46) and Sweden (3.46) There is evidence that the happiest countries saw increases in their happiness levels over the two time periods, especially in Denmark, Finland and the Netherlands. The least happy countries in the pre-recession period were from Eastern Europe - Bulgaria (2.06); Romania (2.44) and Hungary (2.37). Over the two periods Greece and Portugal (-0.32pts and -0.22pts) followed by Italy and Spain (-0.17pts and -0.16pts respectively) had the most marked declines in happiness. It is notable the happiness levels of the Irish remained unchanged.
- 13. 12 Consistent with Blanchflower and Oswald (2008) who found that happiness was U-shaped in age, the young are especially happy. In terms of the happiness levels of the youngest age group of 15-24 the least happy and most happy countries were broadly the same as overall. Happiness levels of the 15-24 age group fell most in Portugal (-0.27pts), Spain (-0.21pts) and Greece (-0.21pts). High youth unemployment rates in the countries hit hardest by (overly) tight monetary and fiscal policy in the Eurozone have seen the biggest declines in their well-being. On any measure this is bad. Of particular note is the especially sharp fall in happiness for those age 25-29 in Greece (- 0.29pts) Spain (-0.21pts) and Portugal (-0.22pts). So in Greece the older of the two young cohorts experienced a bigger drop in happiness than the youngest cohort. Overall happiness fell most across all age groups in Greece (-.32) than in any other country. 5. Conclusion Our main findings are as follows: There is little evidence from the literature that ALMPs work, especially in a recession where over a quarter of the labor force and over a half of the youth labor force are unemployed. This is unprecedented territory. A big think is required! The age group 25-29 in Greece is probably of greatest concern because numerically their unemployment is much larger than those aged 15-19. The percent of this group who are NEETS is worryingly high. This group is excluded from the usual understanding of youth unemployment but they were the ones who were young when the recession first hit and hence many were unable to make the transition from school to work. There is an issue as to whether this group is experiencing age or cohort effects. Clearly this is an important distinction in relation to the scarring effects of unemployment on this group. The conventional ratio of youth to adult unemployment is not particularly high in Greece (partly due to the effects of 25-29 year olds). This begs the question of whether it is overall lack of demand that is the problem or if there are specific issues in the Greek youth labor market. Youth unemployment was relatively high prior to the recession – in fact the youth/adult unemployment rate ratio in Greece has been trending downwards – unlike most other countries. Student (part-time) employment and unemployment is rare in Greece and much less important than in, say, the UK. They do not significantly affect age-specific unemployment rates. The European Labor Force Survey indicates that numbers in Greece in the 15-29 age group are falling. This is a combination of the effects of declining cohort size and increased emigration, which seems to have been particularly marked among women aged 25-29.
- 14. 13 There are very significant differences in labor market outcomes for males and females in Greece. Female activity rates and employment to population ratios are consistently lower and unemployment rates higher for females than for males in the Greek labor market. Gender differentials in Greece are more marked than in many other EU states. Greek youths are much more likely to live at home than are young people in Northern Europe. A similar pattern is found in Spain and Portugal. This mitigates the costs of unemployment, but may also restrict mobility, leading to longer unemployment durations. Again, there are significant gender differentials, with females aged 25-29 more likely to have moved away from the parental home than males. NEET women are more likely to live away, while NEET men are more likely to live at home than are the employed of the same gender. The Great Recession was associated with fairly minor changes in these probabilities. So there has not been a big “return to Mum” in response to recent economic events. Among European countries, Greece has the highest proportions of the young unemployed that have been without work for more than a year. So scarring effects are likely to be large, especially for those 25-29 who were hit hardest by the 2008 recession shock and failed to make a successful transition from school to work. An extremely high proportion of these young adults continue to live with their parents. The decline in Greek well-being since the beginning of the recession has been the most rapid in Europe. However, it is evenly spread across age groups and not specifically focused on the young. Lack of mobility due to rigidities in the housing market seems to be a major issue in Greece.
- 15. 14 Table 1. Youth unemployment rates, levels and shares (European countries: January 2014) Country Rate (%) Thousands EU Share Country Rate (%) Thousands EU Share EA17 24.0 3,517 Lithuania 21.1 27 0.5% EU28 23.4 5,556 Luxembourg 21.4 3 0.1% Belgium 24.3 99 1.8% Hungary 24.5 77 1.4% Bulgaria 30.0 68 1.2% Malta 15.3 5 0.1% Czech Republic 19.1 67 1.2% Netherlands 11.1 156 2.8% Denmark 13.7 60 1.1% Austria 10.5 62 1.1% Germany 7.6 338 6.1% Poland 27.4 397 7.1% Estonia 22.7 16 0.3% Portugal 34.7 130 2.3% Ireland 26.0 54 1.0% Romania 23.6 187 3.4% Greece 59.0 173 3.1% Slovenia 23.3 18 0.3% Spain 54.6 898 16.2% Slovakia 31.3 65 1.2% France 25.4 727 13.1% Finland 19.7 65 1.2% Croatia 49.8 73 1.3% Sweden 22.9 153 2.8% Italy 42.4 690 12.4% United Kingdom 20.0 901 16.2% Cyprus 40.3 16 0.3% Latvia 23.5 22 0.4% Source: Eurostat http://epp.eurostat.ec.europa.eu/cache/ity_public/3-28022014-ap/en/3-28022014-ap-en.pdf
- 16. 15 Table 2: Population, Employment and Unemployment by Year, Age Group and Gender: Greece 2005-2012 (Thousands) Population Employment Unemployment Males Females Males Females Males Females Age 15- 19 20- 24 25- 29 15-19 20- 24 25- 29 15- 19 20- 24 25- 29 15- 19 20- 24 25- 29 15- 19 20- 24 25- 29 15- 19 20- 24 25- 29 Year 2005 281 333 408 281 334 389 26 159 335 13 109 235 8 34 37 11 54 64 2006 287 323 415 289 314 382 27 154 341 13 100 240 9 30 37 9 51 58 2007 281 309 419 287 295 377 27 146 340 13 95 236 6 26 41 8 44 55 2008 273 304 410 285 285 373 23 141 335 13 93 237 6 28 37 7 36 50 2009 270 294 404 278 280 362 22 134 321 11 90 230 6 31 44 8 43 53 2010 273 280 381 267 282 358 16 119 289 9 80 215 9 41 56 8 53 67 2011 280 266 377 270 271 342 13 94 250 5 65 180 12 55 88 11 63 92 2012 275 265 366 271 266 325 11 76 211 4 50 159 14 67 116 15 77 106 Activity Rate (%) EPOP Rate (%) Unemployment Rate (%) 2005 12 58 91 9 49 77 9 48 82 5 33 60 24 18 10 46 33 21 2006 13 57 91 7 48 78 9 48 82 4 32 63 25 16 10 42 34 19 2007 12 56 91 7 47 77 9 47 81 5 32 63 19 15 11 37 31 19 2008 11 56 91 7 45 77 9 46 82 5 33 64 19 17 10 36 28 17 2009 11 56 90 7 48 78 8 46 79 4 32 64 22 19 12 43 33 19 2010 9 57 91 6 47 79 6 43 76 3 28 60 35 25 16 45 40 24 2011 9 56 90 6 47 80 5 35 66 2 24 53 48 37 26 68 49 34 2012 9 54 89 7 48 82 4 29 58 1 19 49 56 47 35 79 61 40
- 17. 16 Table 3: Unemployment, NEET and Educational Status in selected European Countries among those aged 16-29, 2012 (000s) Greece Student Non- student Total Portugal Student Non- student Total Spain Student Non- student Total Employed 32 479 511 Employed 89 652 742 Employed 346 2,120 2,466 Unemployed 36 359 396 Unemployed 57 224 281 Unemployed 372 1,394 1,766 Inactive 729 131 860 Inactive 681 94 776 Inactive 2,674 519 3,193 Total 676 970 1,646 Total 701 970 1,671 Total 3,016 4,033 7,049 Unemployment Rate 53.5% 42.8% 43.6% Unemployment Rate 38.8% 25.5% 27.4% Unemployment Rate 51.8% 39.7% 41.7% NEET Rate 27.8% NEET Rate 17.7% NEET Rate 25.8% Germany Student Non- student Total France Student Non- student Total Sweden Student Non- student Total Employed 2,797 5,423 8,221 Employed 793 4,224 5,017 Employed 229 731 960 Unemployed 127 517 644 Unemployed 92 1,004 1,096 Unemployed 92 110 202 Inactive 4,646 863 5,509 Inactive 4,208 885 5,093 Inactive 582 93 675 Total 7,416 6,803 14,218 Total 5,093 6,113 11,206 Total 819 934 1,753 Unemployment Rate 4.3% 8.7% 7.3% Unemployment Rate 10.4% 19.2% 17.9% Unemployment Rate 28.7% 13.0% 17.4% NEET Rate 9.6% NEET Rate 16.9% NEET Rate 11.0% Ireland Student Non- student Total UK Student Non- student Total Employed 71 315 386 Employed 1,422 5,733 7,154 Unemployed 14 102 116 Unemployed 312 992 1,304 Inactive 299 92 391 Inactive 2,985 1,019 4,004 Total 333 509 842 Total 4,591 7,744 12,335 Unemployment Rate 16.7% 24.5% 23.2% Unemployment Rate 18.0% 14.8% 15.4% 21.7% NEET Rate 16.1%
- 18. 17 Table 4: Proportion of those aged 15-29 with parents not in the same household Ages 15-19 Ages 20-24 Ages 25-29 Greece UK Greece UK UK Total Males Females Total Total Males Females Total Total Males Females Total 2005 7.5 6.3 8.8 7.9 31.0 26.8 35.1 49.9 41.7 31.2 52.6 81.0 2006 6.8 5.6 7.9 7.3 30.1 25.3 35.1 48.6 39.9 29.4 51.3 81.3 2007 6.8 5.6 8.0 7.3 31.6 28.5 34.8 49.7 38.3 29.4 48.1 80.5 2008 6.8 6.0 7.5 8.5 33.6 30.4 37.0 48.6 38.0 30.4 46.2 79.7 2009 7.1 6.0 8.2 8.5 36.1 32.3 40.0 47.4 40.5 33.0 48.9 78.5 2010 6.3 5.2 7.5 8.9 33.0 28.2 37.8 47.2 41.4 32.3 51.1 78.4 2011 6.7 6.0 7.5 8.3 30.5 25.6 35.3 50.1 39.3 31.9 47.4 81.1 2012 6.2 5.4 7.1 8.4 30.0 27.7 32.3 45.7 36.2 30.0 43.3 79.5 Source: European Labor Force Survey Table 5: Dprobit Regression of likelihood of parents not in same household, 2005-2012 Greece UK Portugal Ireland France Spain Germany Males Females Males Females Males Females Males Females Males Females Males Females Males Females Age 20-24 0.383 0.414 0.489 0.509 0.042 0.091 0.343 0.418 0.394 0.415 0.075 0.128 0.439 0.488 Age 25-29 0.445 0.550 0.735 0.724 0.195 0.281 0.589 0.661 0.687 0.666 0.229 0.324 0.696 0.706 Recession 0.009 0.004 0.002o -0.014 -0.005o 0.010 0.117 0.121 -0.004o -0.020 0.001o 0.014 0.029 0.024 NEET -0.118 0.121 -0.044 0.215 -0.060 0.052 -0.078 0.103 -0.160 -0.020 -0.041 0.049 -0.017 0.138 Recession*NEET 0.022 -0.054 -0.014 -0.026 0.029o -0.026 -0.043 -0.033 -0.018 -0.020 0.016 -0.028 -0.041 -0.017o Student 0.139 0.115 0.009 -0.086 -0.107 -0.164 -0.060 -0.088 -0.137 -0.269 -0.104 -0.166 -0.133 -0.223 n = 189007 182334 75991 80788 120182 113201 128675 130803 298121 300694 127726 122139 106057 103613 Pseudo R2 = 0.112 0.131 0.292 0.362 0.144 0.181 0.229 0.273 0.312 0.368 0.174 0.217 0.287 0.368 Notes: excluded category 15-19. Source: ELFS, the symbol o indicates a p value > 0.05
- 19. 18 Table 6. Percent Single by Economic Status Ages 25-29 Between 2009 and 2012 (%): Employed Unemployed Inactive Total Males Greece 83.3 90.6 97.7 86.2 Spain 84.6 88.8 94.9 86.7 Portugal 71.1 82.0 94.6 75.1 Ireland 83.1 87.6 90.4 84.8 Germany 80.7 87.1 93.3 82.9 France 83.4 86.4 90.4 84.3 Sweden 86.3 83.7 91.4 86.7 UK 75.2 88.1 87.6 77.3 Females Greece 73.0 77.7 37.9 66.9 Spain 75.1 73.2 56.7 71.7 Portugal 59.8 62.8 61.5 60.4 Ireland 77.8 79.6 69.2 76.1 Germany 74.8 72.0 52.1 69.9 France 77.2 79.3 60.4 74.3 Sweden 79.9 69.8 66.5 76.7 UK 70.0 79.4 60.9 68.5
- 20. 19 Table 7: Employment, Unemployment and Inactivity in Greece, 2005-08 and 2009-12 by Level of Education Ages 20-29 2005-08 Employed Unemployed Inactive Share No formal education 35.4% 5.6% 59.0% 0.4% ISCED 0-1 50.5% 8.2% 41.4% 7.5% ISCED 2 21.6% 3.7% 74.6% 25.6% ISCED 2 74.1% 17.6% 8.3% 2.2% ISCED 3 38.5% 8.4% 53.1% 41.8% ISCED 4 74.4% 18.0% 7.6% 8.9% ISCED 5 71.1% 16.8% 12.0% 13.5% ISCED 6 80.0% 9.8% 10.2% 0.1% 2009-2012 No formal education 31.4% 17.1% 51.5% 0.7% ISCED 0-1 38.9% 15.6% 45.6% 6.9% ISCED 2 15.2% 5.7% 79.1% 25.7% ISCED 2 62.2% 27.7% 10.1% 2.9% ISCED 3 31.8% 13.5% 54.7% 39.5% ISCED 4 61.9% 29.3% 8.8% 7.5% ISCED 5 62.8% 27.6% 9.6% 16.6% ISCED 6 87.7% 9.9% 2.4% 0.1% Change 2005-08 to 2009-2012 No formal education -4.0% 11.5% -7.5% 0.4% ISCED 0-1 -11.6% 7.4% 4.2% -0.6% ISCED 2 -6.5% 2.0% 4.5% 0.1% ISCED 2 -11.9% 10.1% 1.8% 0.7% ISCED 3 -6.7% 5.1% 1.6% -2.3% ISCED 4 -12.5% 11.3% 1.2% -1.4% ISCED 5 -8.3% 10.7% -2.4% 3.1% ISCED 6 7.7% 0.1% -7.7% 0.0%
- 21. 20 Table 8: Probability of Unemployment and Long-term Unemployment in Greece Aged 16-64 Aged 16-29 Long-term unemployment Unemployment Long-term unemployment Unemployment Coefficient df/dX p value df/dX p value df/dX p value df/dX p value Age 20-24 0.092 0 0.150 0 0.009 0.005 -0.073 0.000 Age 25-29 0.063 0 0.066 0 -0.020 0.000 -0.191 0.000 Age 30-34 0.031 0 0.013 0 Age 35-39 0.018 0 -0.011 0 Age 40-44 0.007 0 -0.029 0 Age 45-49 -0.002 0.14 -0.040 0 Age 50-54 -0.003 0.034 -0.043 0 Age 55-59 -0.009 0 -0.053 0 Age 60-64 -0.020 0 -0.072 0 Recession 0.031 0 0.066 0 0.055 0.000 0.120 0.000 ISCED 1 0.004 0 0.008 0 -0.003 0.344 -0.008 0.077 ISCED 2 0.000 0.804 0.003 0.123 0.013 0.002 0.038 0.000 ISCED 3 -0.001 0.042 -0.003 0 -0.008 0.002 0.004 0.272 ISCED 4 -0.001 0.107 0.001 0.3 -0.011 0.001 0.028 0.000 ISCED 5 -0.023 0 -0.037 0 -0.020 0.000 0.032 0.000 ISCED 6 -0.027 0 -0.055 0 -0.043 0.029 -0.069 0.022 Other EU -0.024 0 -0.016 0 -0.061 0.000 -0.064 0.000 Accession States -0.013 0 0.009 0 -0.043 0.000 -0.051 0.000 Other nationality -0.012 0 -0.003 0.275 -0.038 0.000 -0.042 0.000 Female 0.044 0 0.068 0 0.073 0.000 0.111 0.000 n = 993578 993578 188286 188286 Pseudo R2 = 0.066 0.082 0.038 0.055 obs. P 0.059 0.116 0.109 0.235 pred P 0.048 0.098 0.101 0.222 Notes. In equation 1, the dependent variable is 1 if unemployed for at least a year, zero if employed or unemployed for less than a year. In equation 2, the dependent variable is 1 if unemployed, zero if employed. Equations 3 and 4 follow the same rules respectively, but the dataset is restricted to those aged 16-29. ISCED (International Standard Classification of Education) levels broadly correspond to: 0 - Pre-primary education; 1- Primary education or first stage of basic education; 2- Lower secondary education or second stage of basic education; 3 - Upper secondary education; 4 - Post-secondary non-tertiary education; 5 - First stage of tertiary education; 6 - Second stage of tertiary education so a higher ISCED number implies more education! Omitted categories – Age 15-19, ISCED 0, Greek
- 22. 21 Table 9: Well-being score by country and age group 2000-07 and 2008-12 2000-07 2008-2012 Changes 2000-2007 to 2008-2012 Age Group Age Group Age Group 15-24 25-29 30+ All 15-24 25-29 30+ All 15-24 25-29 30+ All Austria 3.16 3.11 3.08 3.10 3.16 3.08 3.01 3.03 0 -0.03 -0.07 -0.07 Belgium 3.12 3.09 3.08 3.09 3.29 3.17 3.15 3.17 0.17 0.08 0.07 0.08 Bulgaria 2.43 2.21 1.99 2.06 2.62 2.43 2.15 2.22 0.19 0.22 0.16 0.16 Denmark 3.61 3.61 3.6 3.60 3.65 3.63 3.65 3.65 0.04 0.02 0.05 0.05 Finland 3.24 3.24 3.15 3.17 3.39 3.38 3.27 3.29 0.15 0.14 0.12 0.12 France 3.02 3.00 2.90 2.93 3.14 2.97 2.92 2.95 0.12 -0.03 0.02 0.02 Germany 2.90 2.89 2.90 2.90 3.1 3.00 3.01 3.02 0.2 0.11 0.11 0.12 Greece 2.89 2.8 2.59 2.66 2.68 2.51 2.27 2.34 -0.21 -0.29 -0.32 -0.32 Hungary 2.74 2.65 2.39 2.44 2.64 2.49 2.32 2.36 -0.1 -0.16 -0.07 -0.08 Ireland 3.25 3.21 3.25 3.24 3.23 3.15 3.24 3.23 -0.02 -0.06 -0.01 -0.01 Italy 2.96 2.91 2.84 2.87 2.83 2.75 2.69 2.7 -0.13 -0.16 -0.15 -0.17 Luxembourg 3.29 3.3 3.34 3.33 3.35 3.28 3.38 3.37 0.06 -0.02 0.04 0.04 Netherlands 3.4 3.39 3.37 3.37 3.55 3.53 3.45 3.46 0.15 0.14 0.08 0.09 Poland 3.12 3.0 2.70 2.79 3.09 3.02 2.78 2.83 -0.03 0.02 0.08 0.04 Portugal 2.87 2.77 2.50 2.58 2.6 2.55 2.3 2.36 -0.27 -0.22 -0.2 -0.22 Romania 2.68 2.58 2.29 2.37 2.68 2.47 2.26 2.34 0 -0.11 -0.03 -0.03 Slovakia 2.84 2.81 2.60 2.64 3.03 2.91 2.73 2.77 0.19 0.1 0.13 0.13 Spain 3.15 3.09 3.01 3.04 3.07 2.88 2.85 2.88 -0.08 -0.21 -0.16 -0.16 Sweden 3.36 3.37 3.36 3.36 3.52 3.42 3.45 3.46 0.16 0.05 0.09 0.1 UK 3.19 3.16 3.2 3.19 3.33 3.22 3.26 3.26 0.14 0.06 0.06 0.07 Source: Eurobarometer Surveys, 2000-2008
- 23. 22 Figure 1: Unemployment Rates by Age Group: Greece 2005-2012 Source: Eurostat Figure 2: Employment as a Share of Population Ratios (E/POP) by Age Group: Greece 2005-2012 0% 10% 20% 30% 40% 50% 60% 70% 2005 2006 2007 2008 2009 2010 2011 2012 Ages 15-19 Ages 20-24 Ages 25-29 0% 10% 20% 30% 40% 50% 60% 70% 80% 2005 2006 2007 2008 2009 2010 2011 2012 EmploymenttoPopulationRatio Ages 15-19 Ages 20-24 Ages 25-29
- 24. 23 Figure 3: Ratio of Youth Unemployment Rates by Gender Source: Labor Force Survey 0% 50% 100% 150% 200% 250% 2005 2006 2007 2008 2009 2010 2011 2012 RatioofFemaletoMaleYouthUnemploymentRates Greece UK Sweden Portugal Ireland France Spain Germany
- 25. 24 Figure 4: Size of Youth Cohort by Country: 2000-2020 Greece France Spain Sweden Germany UK Portugal Ireland 60 70 80 90 100 110 120 2000 2002 2004 2006 2008 2010 2012 2014 2016 2018 2020 60 70 80 90 100 110 120 2000 2002 2004 2006 2008 2010 2012 2014 2016 2018 2020 50 60 70 80 90 100 110 120 2000 2002 2004 2006 2008 2010 2012 2014 2016 2018 2020 60 70 80 90 100 110 120 2000 2002 2004 2006 2008 2010 2012 2014 2016 2018 2020 60 70 80 90 100 110 120 2000 2002 2004 2006 2008 2010 2012 2014 2016 2018 2020 60 70 80 90 100 110 120 2000 2002 2004 2006 2008 2010 2012 2014 2016 2018 2020 60 70 80 90 100 110 120 2000 2002 2004 2006 2008 2010 2012 2014 2016 2018 2020 60 70 80 90 100 110 120 2000 2002 2004 2006 2008 2010 2012 2014 2016 2018 2020
- 26. 25 China USA WesternEurope Russia Latin America NorthAfrica 60 70 80 90 100 110 120 2000 2002 2004 2006 2008 2010 2012 2014 2016 2018 2020 60 70 80 90 100 110 120 2000 2002 2004 2006 2008 2010 2012 2014 2016 2018 2020 60 70 80 90 100 110 120 2000 2002 2004 2006 2008 2010 2012 2014 2016 2018 2020 60 70 80 90 100 110 120 2000 2002 2004 2006 2008 2010 2012 2014 2016 2018 2020 90 100 110 120 130 2000 2002 2004 2006 2008 2010 2012 2014 2016 2018 2020 90 100 110 120 130 140 2000 2002 2004 2006 2008 2010 2012 2014 2016 2018 2020
- 27. 26 Figure 5: Youth Unemployment Rates and Ratios Greece France Spain Sweden Germany UK 0.0 10.0 20.0 30.0 40.0 50.0 60.0 2.0 2.2 2.4 2.6 2.8 3.0 3.2 3.4 1983 1985 1987 1989 1991 1993 1995 1997 1999 2001 2003 2005 2007 2009 2011 15-24/25-64 ratio (LHS) Youth unemployment rate (RHS) 15.0 17.0 19.0 21.0 23.0 25.0 27.0 29.0 1.9 2.0 2.1 2.2 2.3 2.4 2.5 2.6 1983 1985 1987 1989 1991 1993 1995 1997 1999 2001 2003 2005 2007 2009 2011 15-24/25-64 ratio (LHS) Youth unemployment rate (RHS) 0.0 10.0 20.0 30.0 40.0 50.0 60.0 1.7 1.8 1.9 2.0 2.1 2.2 2.3 1972 1974 1976 1978 1980 1982 1984 1986 1988 1990 1992 1994 1996 1998 2000 2002 2004 2006 2008 2010 2012 15-24/25-64 ratio (LHS) Youth unemployment rate (RHS) 0.0 5.0 10.0 15.0 20.0 25.0 30.0 1.5 1.7 1.9 2.1 2.3 2.5 2.7 2.9 3.1 3.3 15-24/25-64 ratio (LHS) Youth unemployment rate (RHS) 0.0 2.0 4.0 6.0 8.0 10.0 12.0 14.0 16.0 0.6 0.7 0.8 0.9 1.0 1.1 1.2 1.3 1.4 1.5 1.6 1970 1972 1974 1976 1978 1980 1982 1984 1986 1988 1990 1992 1994 1996 1998 2000 2002 2004 2006 2008 2010 2012 15-24/25-64 ratio (LHS) Youth unemployment rate (RHS) 5.0 7.0 9.0 11.0 13.0 15.0 17.0 19.0 21.0 23.0 1.3 1.5 1.7 1.9 2.1 2.3 2.5 2.7 2.9 1984 1985 1986 1987 1988 1989 1990 1991 1992 1993 1994 1995 1996 1997 1998 1999 2000 2001 2002 2003 2004 2005 2006 2007 2008 2009 2010 2011 2012 15-24/25-64 ratio (LHS) Youth unemployment rate (RHS)
- 28. 27 Portugal Ireland Source: OECD 0.0 5.0 10.0 15.0 20.0 25.0 30.0 35.0 40.0 1.8 1.9 2.0 2.1 2.2 2.3 2.4 2.5 2.6 1974 1976 1978 1980 1982 1984 1986 1988 1990 1992 1994 1996 1998 2000 2002 2004 2006 2008 2010 2012 15-24/25-64 ratio (LHS) Youth unemployment rate (RHS) 0 5 10 15 20 25 30 35 0.0 0.5 1.0 1.5 2.0 2.5 1984 1985 1986 1987 1988 1989 1990 1991 1992 1993 1994 1995 1996 1997 1998 1999 2000 2001 2002 2003 2004 2005 2006 2007 2008 2009 2010 2011 2012 15-24/25-64 ratio (LHS) Youth unemployment rate (RHS)
- 29. 28 Figure 6: Percent NEET (Not in Employment, Education or Training) by Country and Age Group 2013 Source: Eurostat 0 5 10 15 20 25 30 35 40 Sweden Germany United Kingdom Portugal France European Union Ireland Spain Greece PercentNEET Age 15-19 Age 20-24 Age 25-29
- 30. 29 Figure 7: Share of Unemployed Out of Work for More than One Year Source: European Labor Force Survey 0% 10% 20% 30% 40% 50% 60% 2005 2006 2007 2008 2009 2010 2011 2012 PercentofUnemployedwithduration>12months Germany Spain France Greece Ireland Portugal Sweden UK
- 31. 30 Figure 8: Average Age of Long-Term Unemployed 2008-2012 Source: European Labor Force Survey Figure 9: Percent Females Among Long-Term Unemployed Source: European Labor Force Survey 0 5 10 15 20 25 30 35 40 45 50 UK IE GR FR ES PT SE DE AverageAgeofLong-Term Unemployed 0% 10% 20% 30% 40% 50% 60% IE UK SE DE FR ES PT GR PercentFemalesamonglong-term unemployed
- 32. 31 Figure 10: Actual Weekly Hours by Age Group 2005-2012, Greece Figure 11: Desired Weekly Hours by Age Group 2005-2012, Greece 32 33 34 35 36 37 38 39 40 41 42 15-19 20-24 25-29 30-34 35-39 40-44 45-49 50-54 55-59 60-64 65-69 70-74 HoursPerWeek Age Group 2005 2007 2009 2011 2012 33 34 35 36 37 38 39 40 41 42 43 15-19 20-24 25-29 30-34 35-39 40-44 45-49 50-54 55-59 60-64 65-69 70-74 DesiredHoursPerWeek Age Group 2005 2007 2009 2011 2012
- 33. 32 References Auspos P, Riccio J and White M (1999), `A review of US and European literature on the microeconomic effects of labor market programmes for young people’, Employment Service, Research and Development Report no 20, July 1999, Sheffield: The Employment Service. Bell, D.N.F and Blanchflower D.G. (2011a), 'UK underemployment in the Great Recession', National Institute Economic Review, January, 215, R23-33. Bell, D.N.F and Blanchflower D.G. (2011b), 'Youth unemployment in Europe and the United States', Nordic Economic Policy Review, number 1, 2011, pp. 11-38 Berger, M.C., (1989) ‘Demographic Cycles, Cohort Size, and Earnings’, Demography, 26, No 2, May, pp. 311-321 Bergemann, A. and van den Berg, G.J. (2006), ‘Active Labor Market Policy effects for women in Europe: a survey’, IZA Discussion Paper 2365 Blanchflower, D.G. (2009), ‘International evidence on well-being’, in Measuring the Subjective Well-Being of Nations: National Accounts of Time Use and Well-Being edited by Alan B. Krueger, NBER and University of Chicago Press Blanchflower, D.G., David N.F. Bell, Alberto Montagnoli, and Mirko Moro (2013), 'The effects of macroeconomic shocks on well-being', presented at Boston Fed conference on Fulfilling the full-employment mandate. Blanchflower, D.G. and R.B. Freeman, (2000), Youth Employment and Joblessness in Advanced Countries, eds, University of Chicago Press and NBER, Chicago, Illinois. Blanchflower, D.G., and A.J. Oswald (2013), 'Does high home ownership impair the labor market?,' Peterson Institute Working Paper, #13, May. Blanchflower, D.G., and A.J. Oswald (2008), ‘Is well-being U-shaped over the life cycle?’, Social Science and Medicine, , 66(6), pp. 1733-1749 Blanchflower, D.G., and A.J. Oswald (2004), 'Well-being over time in Britain and the USA', Journal of Public Economics, 88, pp. 1359-1386. Blundell , R., Dias, M.C., Meghir , C., Van Reenen, J. (2001) 'Evaluating The Employment Impact Of A Mandatory Job Search Assistance Program', Institute For Fiscal Studies, WP01/20 Blundell, R., Dias, M.C. Meghir, C. and Van Reenen, J. (2004), 'Evaluating the employment impact of a mandatory job search program', Journal of the European Economic Association, June, 2(4), pp. 569–606.
- 34. 33 Calmfors, L., Forslund, A. and Hemström, M. (2002), ‘Does Active Labor Market Policy work? Lessons from the Swedish Experiences’, Institute for International Economic Studies, Stockholm University. Card, D., Kluve, J. and Weber, A., (2009) “Active Labor Market Policy Evaluations: A Meta- Analysis”, Economic Journal, 120, F452-F477. Ellwood, D. (1982), 'Teenage unemployment: permanent scars or temporary blemishes?' in The Youth Labor Market Problem: Its Nature, Causes and Consequences, edited by Richard B. Freeman and David A. Wise, pp. 349-390. Chicago: University of Chicago Press. Freeman, R.B., (1979) ‘The Effect of Demographic Factors on Age Earnings Profiles', Journal of human resources, 14, No 3, pp. 289-318 Freeman, R.B. and J. Rogers, (2000), 'Area economic conditions and the labor market outcomes of young men in the 1990s expansion’, in Cherry, R. and Rodgers, W. M. (editors), Prosperity for All: The Economic Boom and African Americans, Russell Sage Foundation, New York Freeman, R.B. and Wise, D.A. (1982), 'The youth labor market problem: its nature causes and consequences:' in Freeman, R. B. and D. A. Wise, (editors), The Youth Labor Market Problem: Its Nature, Causes, and Consequences, University of Chicago Press and NBER. Grubb, W.N. (1999), ‘Lessons from education and training for youth: five precepts, in preparing youth for the 21st Century: the transition from education to the labor market’, OECD, Paris. Grubb, D. and J. Martin (2001) ‘What works and for whom: a review of OECD countries’ experiences with active labor market policies’, OECD Office of Labor Market Policy Evaluation Working Paper 2001:14 Heckman, J.J. and J.A. Smith (1999a), ‘The pre-programme earnings dip and the determinants of participation in a social programme. Implications for simple evaluation strategies’, Economic Journal, July, 109, pp. 313-348. Heckman, J.J. and J.A. Smith (1999b), ‘The sensitivity of experimental impact estimates: evidence from the National JTPA Study’ in Youth Employment and Joblessness in Advanced Countries, edited by David G. Blanchflower and Richard B. Freeman, University of Chicago Press and NBER, Chicago, Illinois. OECD (1994), The OECD Jobs Study: Facts, Analysis, Strategies, OECD, Paris Welch, F., (1979) ‘Effects of Cohort Size on Earnings: the Baby Boom Babies’ Financial Bust ’, Journal of Political Economy, 87, 5, PP. S65-S97