SlideShare una empresa de Scribd logo
1 de 1
Figure 2. Principle component one vs. two six navigational sites.
Bonferroni-corrected probabilities were insignificant. Pike Island
Pool, Willow Island Pool, and Greenup Pool are located in the
upper Ohio River valley. Markland Pool is located in the glaciated
valley, Newburgh and Uniontown Pool are located in the alluvial
valley.
-10
-8
-6
-4
-2
0
2
4
6
-8 -6 -4 -2 0 2 4 6 8 10
PCA2(dimensionless)
PCA 1 (dimensionless)
Aplodinotus grunniens Mouth Ratios: PCA 1 vs. PCA 2
Pike Island pool
Willow Island pool
Belleview pool
R.C. Byrd pool
Greenup pool
Markland pool
McApline pool
Cannelton pool
Newburgh pool
Uniontown pool
Figure 3. Principle component one vs. two ten navigational sites.
Bonferroni-corrected probabilities showed that p-value < 0.0001.
Pike Island Pool, Willow Island Pool, Belleview pool, R.C Byrd Pool,
and Greenup Pool are located in the upper Ohio River valley.
Markland Pool and McApline Pool are contained in the lower Ohio
River glaciated valley. Cannelton Pool is enclosed in the constricted
valley, Newburgh and Uniontown Pool are located in the lower Ohio
River alluvial valley.
THE EFFECT OF POOL GEOMORPHOLOGY ON FEEDING MORPHOLOGY OF APLODINOTUS
GRUNNIENS AND LEPOMIS MACROCHIRUS IN THE OHIO RIVER, USA.
Adam Gerughty, Division of Environmental Studies and Sustainable Systems , Kentucky State University 400 East Main Street, Frankfort, KY 40601 USA
Dr. Tamara Sluss, Division of Mathematics and Sciences, Kentucky State University 400 East Main Street, Frankfort, KY 40601 USA
Methods
•Specimens for this project were obtained from the Cincinnati Natural History Museum's preserve
ichthyology collection.
•Each specimen was collected by electrofishing during the years of 1967, 1991 1992, and 1993
•Then preserved in a solution of 95% ethanol.
•The pictures were captured with a Nikon D90 digital camera ascertained the pictures.
• Each picture was captured from a distance of 1 meter from the specimen. A. grunniens (n=155) and L.
macrochirus (n=45)
•Each picture was then uploaded into Spot Advance version 4.7 imaging software (Diagnostic Instruments
Inc.).
•11 morphological measurements were recorded.
―Mass
―Maximum Standard Length
―Fork Length
―Maximum Total Length
―Body Depth
―Gape Width of the Mouth
•20 different ratios were created for standardization between individuals.
•The jaw length and gape width of the mouth were standardized.
•These ratios were separated by the individual's navigational pool location and grouped by species of fish.
A. grunniens and L. macrochirus were analyzed separately.
•PCA was preformed using PC-ORD v 4.25.
•Pearson correlations between mouth standardizations and principle components scores for each
navigational pool were used to understand the driving standardization in the plots.
Abstract
The Ohio River is over 1,500 kilometers long with 20 navigational dams segmenting it into navigational pools. This study was conducted to determine the effects of navigational dams on feeding morphology for two predatory fish,
freshwater drum, A. grunniens (n=155) and bluegill, L. macrochirus (n=45) in pools with differing geomorphology using specimens from the Cincinnati Natural History Museum. Feeding parameters such as jaw length and gap width of the
mouth were ascertained using a Nikon D90 digital camera and SPOT Advance for each individual fish. Parameters were then analyzed with principle component analysis by PC-ORD. According to this study, the A. grunniens' morphological
parameters are less similar for individuals in the semi-constricted glaciated valley compared to individuals that inhabit the alluvial valley and upper Ohio River. The L. macrochirus' feeding morphology is more similar between individuals in
the semi-constricted glaciated valley and upper the Ohio River. The influencing morphological measurement was jaw length; A. grunniens jaw length mean was 0.273cm L macrochirus jaw length mean was 0.228cm.
Discussion
L. macrochirus response
In general, we found that L. macrochirus showed no morphological differences between
navigational dam sites, perhaps because the sample size was low. Additional L. macrochirus
would need to be measured to improve statistical power. One possible reason why no
morphological differences were found is because competition in the habitats are at minimal
(Werner and Hall 1977).
A. grunniens response
The results have shown that there is measurable difference in the A grunniens population.
Individuals habiting the McApline navigational pool (glaciated valley) were morphologically
different compared to individuals habiting Newburgh navigational pool (alluvial valley),
Uniontown navigational pool (alluvial valley), and R.C. Byrd Pool (upper Ohio River alluvial valley).
This could indicate there is a difference in habitat and availability of prey. The principal mouth
morphological measurement influencing these differences is jaw length.
Significant morphological measurement
Jaw length is an important factor that helps determine which trophic position and prey size
the fish will utilize, usually reducing competition between individuals. Jaw lengths between life
stages are different so young adults do not compete for all the same food (Sabatés and Saiz
2000). Essentially, fish with small jaw lengths will select small prey while fish with longer jaw
lengths will select bigger prey (Lukoschek and McCormick 2001).
Habitat Differences
Alluvial valleys and glaciated valleys have very different characteristics. Alluvial valleys have
vast floodplains; glaciated valleys have constricted floodplains. It is probable that morphology is
being driven by the availability of terrestrial organisms. A. grunniens in the alluvial valley are
relying on the annual flooding cycle to utilize an area that has an abundant source of food and
nutrients (Junk et. al 1989).
Further Research
Future research needs to be conducted to interpret differences between individuals at
different navigational sites. Stable isotopes and gut content analysis would help to better
understand what A. grunniens and L. macrochirus feed upon. An increase in sample size, study
sites, and species would help to statistically verify differences between sites and the differences
between the glaciated valley and alluvial valleys.
Acknowledgements
This study would not have been possible without the contributions of Dr. Herman Mays and the Cincinnati Museum of
Natural History’s loan of its ichthyology collection. I would also like to thank Thomas Moore College for allowing me to have access
to their ichthyology collection. Special thanks to Dr. Tara Trammell of the University of Louisville for helping with data analysis
through PC-ORD. I am grateful to Dr. Tamara Sluss, my advisor, for her constant support and guidance throughout this study. This
study was supported by Dr. Kazi Javed, head of the Master's in Environmental Studies program at Kentucky State University. This
study was supported by a grant from the Kentucky Water Resource Research Institute. I would like to thank Charles Weibel and
Kentucky State University Aquaculture and Aquatic Sciences for providing matching funds.
Introduction
The Ohio River is North America’s fourth largest river, in terms of discharge (Thorp and Mantovani 2005). The
Ohio River is 1,579 km long and connects with the Mississippi River at Cairo, Illinois. It is the largest tributary
of the Mississippi River, with a drainage basin is 517,998 km2. The Ohio River was formed when the
Monongahela and Allegheny rivers converged in Pennsylvania. This confluence is not the modern day flow
pattern of the Ohio River; part of the river has been modified. Throughout the centuries different glaciers
carved the valleys that the river flows through today (Ray 1974). The Ohio River is classified into two main
sections, the upper Ohio River and the lower Ohio River. . The lower river is further broken down into three
geological sections.
Ohio River Subdivision Valley Floodplain
Upper Ohio (alluvial valley) High valley walls with wide Channel Vast floodplain
Glaciated Valley Narrow Channel with steep banks Narrow limited floodplain
Constricted Valley Deep valley walls with narrow channel Floodplain almost nonexistent
alluvial Valley Extensive bottomlands Vast floodplain
Aplodinotus grunniens
•Habitat: Open warm waters with a muddy benthic
zone
•Food: Young individuals feed primarily on
copepods and cladocerans, while adults feed on
crayfish, fish, and mollusks
•Hunting behaviors: Rely on sight and touch to
feed
Lepomis macrochirus
•Habitat: Prefer warm waters, can be found among
the littoral zone along lakes and rivers
•Food: Young individuals feed on copepods and
cladocerans while adults feed on large insects or the
occasional frog or fish
•Hunting behaviors: Rely on sight to find insects near
the surface
Objective
This study was conducted to compare the mouth morphology of two species of fish between navigational
sites in three different geomorphologic areas on the Ohio River. The two predatory fish selected for this
study were L. macrochirus and A. grunniens. These fish species could be separated by their mouth
morphology measurements such as gape width, head length, and mouth height (Labropoulou and
Eleftheriou 1996). It is possible that because the river continuity has been altered by navigational dams,
individual L. macrochirus and A. grunniens are selecting different prey at different sites. If prey selection has
been altered changes will show in the mouth morphology. Due to the geomorphology of the dams a lack of
floodplain accessibility could lead to a change in individuals' diets.
References
Junk W., Bayley P., and Sparks R. (1989) The Flood Pulse Concept in River-Floodplain System. Canadian Special Publication of
Fisheries and Aquatic Sciences, 106, 110-127.
Lukoschek V. and McCormick M. (2001) Ontogeny of diet changes in a tropical benthic carnivorous fish, Parupeneus barberinus
(Mullidae): relationship between foraging behavior, habitat use, jaw size, and prey selection. Marine Biology, 138, 1099-
1113.
Ray L. (1974) Geomorphology and Quaternary Geology of the Glaciated Ohio River Valley-A Reconnaissance Study. Geological
Survey Professional Paper, 826, 1-75.
Sabatés A. and Saiz E. (2000) Intra- and interspecific variability in prey size and niche breadth of myctophiform fish larvae. Marine
Ecology Progress Series, 201, 261-271
Thorp J. and Mantovani. (2005) Zooplankton of turbid and hydrologically dynamic prairie rivers. Freshwater Biology, 50, 1474-
1491.
Werner R. and Hall D. (1977) Competition and Habitat Shift in two Sunfishes (Centrarchidae). Ecology, 58, 869-876.
Figure 1. Map of the navigational dam sites along the Ohio River. Provided by
the Army Corp. of Engineers
-8
-6
-4
-2
0
2
4
6
-8 -6 -4 -2 0 2 4 6 8
PCA2(dimensionless)
PCA 1 (dimensionless)
Lepomis macrochirus Mouth Ratios: PCA 1 vs. PCA 2
Pike Island pool
Willow Island pool
Greenup pool
Markland pool
Newburgh pool
Uniontown pool
―Eye Diameter
―Jaw Length
―Head Length
―Head Depth
―Snout Length
Standardization L. macrochirus PCA 1 L. macrochirus PCA 2 A. grunniens PCA 1 A. grunniens PCA 2
Jaw length : mass 0.421 0.201 0.5975 -0.14
Jaw length : maximum standard length 0.94 0.221 0.9277 -0.33
Jaw length : fork length 0.9487 0.241 0.93 -0.32
Jaw length : maximum total length 0.9484 0.246 0.9282 -0.32
Jaw length : body depth 0.9463 0.188 0.208 -0.23
Jaw length : head length 0.2188 0.193 0.872 -0.28
Jaw length : eye diameter 0.7323 0.294 0.2274 -0.42
Jaw length : snout length 0.7522 -0.08 0.5732 -0.08
Jaw length : head depth 0.9025 0.172 0.8395 -0.36
Jaw length : gape width of the mouth 0.9455 -0.31 0.9725 0.151
Gape width of the mouth : mass 0.0811 0.273 0.2546 -0.21
Gape width of the mouth : maximum standard length -0.181 0.903 -0.169 -0.91
Gape width of the mouth : fork length -0.184 0.942 -0.189 -0.91
Gape width of the mouth : maximum total length -0.196 0.944 -0.24 -0.89
Gape width of the mouth : body depth 0.0331 0.827 0.0576 -0.26
Gape width of the mouth : head length 0.0467 0.251 -0.47 -0.71
Gape width of the mouth : eye diameter -0.226 0.662 -0.217 -0.39
Gape width of the mouth : snout length -0.481 0.41 -0.607 -0.26
Gape width of the mouth : head depth 0.117 0.703 -0.467 -0.71
Gape width of the mouth : jaw length -0.928 0.291 -0.947 -0.21
Table 1. Pearson correlation coefficients between mouth morphology
standardization and principal components in a PCA of the navigational pool sites for
L. macrochirus and A. grunniens. Significant correlations using Bonferroni-corrected
probabilities are shown in bold text.

Más contenido relacionado

La actualidad más candente

0c9605211e66c2f5be000000
0c9605211e66c2f5be0000000c9605211e66c2f5be000000
0c9605211e66c2f5be000000Thomas Saunders
 
Cooley Preville Snyder Final Draft
Cooley Preville Snyder Final DraftCooley Preville Snyder Final Draft
Cooley Preville Snyder Final DraftOlivia Cooley
 
Final Report NRM 495 FINAL
Final Report NRM 495 FINALFinal Report NRM 495 FINAL
Final Report NRM 495 FINALJared Sartini
 
Sue Ohalloran Lake Superior Citizen Monitoring Presentation
Sue Ohalloran Lake Superior Citizen Monitoring Presentation Sue Ohalloran Lake Superior Citizen Monitoring Presentation
Sue Ohalloran Lake Superior Citizen Monitoring Presentation Lake Superior Binational Forum
 
TUREK SALT MARSH RESTORATION FINAL 12 09 14
TUREK SALT MARSH RESTORATION FINAL 12 09 14TUREK SALT MARSH RESTORATION FINAL 12 09 14
TUREK SALT MARSH RESTORATION FINAL 12 09 14Turek James ("Jim")
 
Regional-Scale Assessment of N2O Emissions within the US Corn Belt: The Impac...
Regional-Scale Assessment of N2O Emissions within the US Corn Belt: The Impac...Regional-Scale Assessment of N2O Emissions within the US Corn Belt: The Impac...
Regional-Scale Assessment of N2O Emissions within the US Corn Belt: The Impac...National Institute of Food and Agriculture
 
Gonczar_Argonne_Research_Paper_Final_ (1)
Gonczar_Argonne_Research_Paper_Final_ (1)Gonczar_Argonne_Research_Paper_Final_ (1)
Gonczar_Argonne_Research_Paper_Final_ (1)Michael Gonczar
 
Ebong groundwater assessment aws
Ebong groundwater assessment awsEbong groundwater assessment aws
Ebong groundwater assessment awsEbong Dickson
 
Examples of ideas for the training
Examples of ideas for the trainingExamples of ideas for the training
Examples of ideas for the trainingAhmed Tarek Fahmy
 
Sedimentation assessment of a small reservoir at afaka forest reserve, kaduna...
Sedimentation assessment of a small reservoir at afaka forest reserve, kaduna...Sedimentation assessment of a small reservoir at afaka forest reserve, kaduna...
Sedimentation assessment of a small reservoir at afaka forest reserve, kaduna...Alexander Decker
 
Wintergreen Pond Management Plan (1)
Wintergreen Pond Management Plan (1)Wintergreen Pond Management Plan (1)
Wintergreen Pond Management Plan (1)John Fitzpatrick
 
Instream legacy phosphorus within an agricultural dominated watershed, wisconsin
Instream legacy phosphorus within an agricultural dominated watershed, wisconsinInstream legacy phosphorus within an agricultural dominated watershed, wisconsin
Instream legacy phosphorus within an agricultural dominated watershed, wisconsinSoil and Water Conservation Society
 
Senior Project Paper (1)
Senior Project Paper (1)Senior Project Paper (1)
Senior Project Paper (1)Kelsey Slayton
 

La actualidad más candente (19)

Valley Water Summit
Valley Water SummitValley Water Summit
Valley Water Summit
 
DE Poster Slide V4
DE Poster Slide V4DE Poster Slide V4
DE Poster Slide V4
 
0c9605211e66c2f5be000000
0c9605211e66c2f5be0000000c9605211e66c2f5be000000
0c9605211e66c2f5be000000
 
Cooley Preville Snyder Final Draft
Cooley Preville Snyder Final DraftCooley Preville Snyder Final Draft
Cooley Preville Snyder Final Draft
 
Reducing nutrients
Reducing nutrientsReducing nutrients
Reducing nutrients
 
Final Report NRM 495 FINAL
Final Report NRM 495 FINALFinal Report NRM 495 FINAL
Final Report NRM 495 FINAL
 
Sue Ohalloran Lake Superior Citizen Monitoring Presentation
Sue Ohalloran Lake Superior Citizen Monitoring Presentation Sue Ohalloran Lake Superior Citizen Monitoring Presentation
Sue Ohalloran Lake Superior Citizen Monitoring Presentation
 
TUREK SALT MARSH RESTORATION FINAL 12 09 14
TUREK SALT MARSH RESTORATION FINAL 12 09 14TUREK SALT MARSH RESTORATION FINAL 12 09 14
TUREK SALT MARSH RESTORATION FINAL 12 09 14
 
Regional-Scale Assessment of N2O Emissions within the US Corn Belt: The Impac...
Regional-Scale Assessment of N2O Emissions within the US Corn Belt: The Impac...Regional-Scale Assessment of N2O Emissions within the US Corn Belt: The Impac...
Regional-Scale Assessment of N2O Emissions within the US Corn Belt: The Impac...
 
Clarisse_Betancourt_Poster_Presentation
Clarisse_Betancourt_Poster_PresentationClarisse_Betancourt_Poster_Presentation
Clarisse_Betancourt_Poster_Presentation
 
Gonczar_Argonne_Research_Paper_Final_ (1)
Gonczar_Argonne_Research_Paper_Final_ (1)Gonczar_Argonne_Research_Paper_Final_ (1)
Gonczar_Argonne_Research_Paper_Final_ (1)
 
Ebong groundwater assessment aws
Ebong groundwater assessment awsEbong groundwater assessment aws
Ebong groundwater assessment aws
 
Examples of ideas for the training
Examples of ideas for the trainingExamples of ideas for the training
Examples of ideas for the training
 
Grimaldo Salvage
Grimaldo SalvageGrimaldo Salvage
Grimaldo Salvage
 
Sedimentation assessment of a small reservoir at afaka forest reserve, kaduna...
Sedimentation assessment of a small reservoir at afaka forest reserve, kaduna...Sedimentation assessment of a small reservoir at afaka forest reserve, kaduna...
Sedimentation assessment of a small reservoir at afaka forest reserve, kaduna...
 
Wintergreen Pond Management Plan (1)
Wintergreen Pond Management Plan (1)Wintergreen Pond Management Plan (1)
Wintergreen Pond Management Plan (1)
 
Instream legacy phosphorus within an agricultural dominated watershed, wisconsin
Instream legacy phosphorus within an agricultural dominated watershed, wisconsinInstream legacy phosphorus within an agricultural dominated watershed, wisconsin
Instream legacy phosphorus within an agricultural dominated watershed, wisconsin
 
Senior Project Paper (1)
Senior Project Paper (1)Senior Project Paper (1)
Senior Project Paper (1)
 
Scottish Seamounts - MASTS
Scottish Seamounts - MASTS Scottish Seamounts - MASTS
Scottish Seamounts - MASTS
 

Destacado (10)

Tim GruarCV
Tim GruarCVTim GruarCV
Tim GruarCV
 
Patricia Pastorek Resume.
Patricia Pastorek Resume.Patricia Pastorek Resume.
Patricia Pastorek Resume.
 
Zz veille stcw
Zz veille stcwZz veille stcw
Zz veille stcw
 
Coincidir
CoincidirCoincidir
Coincidir
 
CV Amr Khalil
CV Amr KhalilCV Amr Khalil
CV Amr Khalil
 
MOVE Week 2015 Report: A mixture of all shapes and sizes that resulted in gre...
MOVE Week 2015 Report: A mixture of all shapes and sizes that resulted in gre...MOVE Week 2015 Report: A mixture of all shapes and sizes that resulted in gre...
MOVE Week 2015 Report: A mixture of all shapes and sizes that resulted in gre...
 
Victimization of Women in "Ode to Psyche"
Victimization of Women in "Ode to Psyche"Victimization of Women in "Ode to Psyche"
Victimization of Women in "Ode to Psyche"
 
aya h metwally
aya h metwallyaya h metwally
aya h metwally
 
Consolidado noveno
Consolidado novenoConsolidado noveno
Consolidado noveno
 
Change Management
Change ManagementChange Management
Change Management
 

Similar a posterlayoutnew

AdamGerughtycapstonerevised
AdamGerughtycapstonerevisedAdamGerughtycapstonerevised
AdamGerughtycapstonerevisedAdam Gerughty
 
FA2014_BIO3800_Monitoring Fish Poster
FA2014_BIO3800_Monitoring Fish PosterFA2014_BIO3800_Monitoring Fish Poster
FA2014_BIO3800_Monitoring Fish PosterConnor Gilmour
 
UW WSM - Practicum final draft
UW WSM - Practicum final draftUW WSM - Practicum final draft
UW WSM - Practicum final draftEthan Huffaker
 
CCW conference: Protecting Susquehanna and impacts on jobs
CCW conference: Protecting Susquehanna and impacts on jobsCCW conference: Protecting Susquehanna and impacts on jobs
CCW conference: Protecting Susquehanna and impacts on jobsClean Water
 
7_PDFsam_FBA_NEWS_70_WINTER_2016
7_PDFsam_FBA_NEWS_70_WINTER_20167_PDFsam_FBA_NEWS_70_WINTER_2016
7_PDFsam_FBA_NEWS_70_WINTER_2016Alex Seeney
 
WSST presentation 2014 Final
WSST presentation 2014  FinalWSST presentation 2014  Final
WSST presentation 2014 FinalCindyByers
 
Belize Poster with current and DO temp.pptx
Belize Poster with current and DO temp.pptxBelize Poster with current and DO temp.pptx
Belize Poster with current and DO temp.pptxShannon Dexter
 
Terrill_Sean_Poster_Final
Terrill_Sean_Poster_FinalTerrill_Sean_Poster_Final
Terrill_Sean_Poster_FinalSean Terrill
 
DY Atagi MSc Thesis Estuarine Use by Juvenile Coho Salmon ubc_1994-0362
DY Atagi MSc Thesis Estuarine Use by Juvenile Coho Salmon ubc_1994-0362DY Atagi MSc Thesis Estuarine Use by Juvenile Coho Salmon ubc_1994-0362
DY Atagi MSc Thesis Estuarine Use by Juvenile Coho Salmon ubc_1994-0362Dana Atagi
 
Growth patterns, sex ratios and fecundity estimates in blue crab (callinectes...
Growth patterns, sex ratios and fecundity estimates in blue crab (callinectes...Growth patterns, sex ratios and fecundity estimates in blue crab (callinectes...
Growth patterns, sex ratios and fecundity estimates in blue crab (callinectes...Alexander Decker
 
River Crew 2016 Poster Draft
River Crew 2016 Poster DraftRiver Crew 2016 Poster Draft
River Crew 2016 Poster DraftOlivia Williams
 
Trace Element and Nutrient Concentrations Across An Anthropogenic Gradient 4t...
Trace Element and Nutrient Concentrations Across An Anthropogenic Gradient 4t...Trace Element and Nutrient Concentrations Across An Anthropogenic Gradient 4t...
Trace Element and Nutrient Concentrations Across An Anthropogenic Gradient 4t...Adrian Alvarez
 
Spawning Behavior of Trout and Utility of Redd Counts
Spawning Behavior of Trout and Utility of Redd CountsSpawning Behavior of Trout and Utility of Redd Counts
Spawning Behavior of Trout and Utility of Redd Countsrobertvierck
 

Similar a posterlayoutnew (20)

AdamGerughtycapstonerevised
AdamGerughtycapstonerevisedAdamGerughtycapstonerevised
AdamGerughtycapstonerevised
 
FA2014_BIO3800_Monitoring Fish Poster
FA2014_BIO3800_Monitoring Fish PosterFA2014_BIO3800_Monitoring Fish Poster
FA2014_BIO3800_Monitoring Fish Poster
 
UW WSM - Practicum final draft
UW WSM - Practicum final draftUW WSM - Practicum final draft
UW WSM - Practicum final draft
 
CCW conference: Protecting Susquehanna and impacts on jobs
CCW conference: Protecting Susquehanna and impacts on jobsCCW conference: Protecting Susquehanna and impacts on jobs
CCW conference: Protecting Susquehanna and impacts on jobs
 
SVAP_Report+_1_
SVAP_Report+_1_SVAP_Report+_1_
SVAP_Report+_1_
 
Yil Me Hu: Winter 2013
Yil Me Hu: Winter 2013Yil Me Hu: Winter 2013
Yil Me Hu: Winter 2013
 
7_PDFsam_FBA_NEWS_70_WINTER_2016
7_PDFsam_FBA_NEWS_70_WINTER_20167_PDFsam_FBA_NEWS_70_WINTER_2016
7_PDFsam_FBA_NEWS_70_WINTER_2016
 
WSST presentation 2014 Final
WSST presentation 2014  FinalWSST presentation 2014  Final
WSST presentation 2014 Final
 
Yil-Me-Hu Winter 2015/2016
Yil-Me-Hu Winter 2015/2016Yil-Me-Hu Winter 2015/2016
Yil-Me-Hu Winter 2015/2016
 
Slides throughout the day (2016 EWMF)
Slides throughout the day (2016 EWMF)Slides throughout the day (2016 EWMF)
Slides throughout the day (2016 EWMF)
 
Moravek_AGUPoster4
Moravek_AGUPoster4Moravek_AGUPoster4
Moravek_AGUPoster4
 
Belize Poster with current and DO temp.pptx
Belize Poster with current and DO temp.pptxBelize Poster with current and DO temp.pptx
Belize Poster with current and DO temp.pptx
 
Terrill_Sean_Poster_Final
Terrill_Sean_Poster_FinalTerrill_Sean_Poster_Final
Terrill_Sean_Poster_Final
 
DY Atagi MSc Thesis Estuarine Use by Juvenile Coho Salmon ubc_1994-0362
DY Atagi MSc Thesis Estuarine Use by Juvenile Coho Salmon ubc_1994-0362DY Atagi MSc Thesis Estuarine Use by Juvenile Coho Salmon ubc_1994-0362
DY Atagi MSc Thesis Estuarine Use by Juvenile Coho Salmon ubc_1994-0362
 
Growth patterns, sex ratios and fecundity estimates in blue crab (callinectes...
Growth patterns, sex ratios and fecundity estimates in blue crab (callinectes...Growth patterns, sex ratios and fecundity estimates in blue crab (callinectes...
Growth patterns, sex ratios and fecundity estimates in blue crab (callinectes...
 
River Crew 2016 Poster Draft
River Crew 2016 Poster DraftRiver Crew 2016 Poster Draft
River Crew 2016 Poster Draft
 
Trace Element and Nutrient Concentrations Across An Anthropogenic Gradient 4t...
Trace Element and Nutrient Concentrations Across An Anthropogenic Gradient 4t...Trace Element and Nutrient Concentrations Across An Anthropogenic Gradient 4t...
Trace Element and Nutrient Concentrations Across An Anthropogenic Gradient 4t...
 
Spawning Behavior of Trout and Utility of Redd Counts
Spawning Behavior of Trout and Utility of Redd CountsSpawning Behavior of Trout and Utility of Redd Counts
Spawning Behavior of Trout and Utility of Redd Counts
 
Yil-Me-Hu, Winter 2014
Yil-Me-Hu, Winter 2014Yil-Me-Hu, Winter 2014
Yil-Me-Hu, Winter 2014
 
Grimaldo_et_al_2004
Grimaldo_et_al_2004Grimaldo_et_al_2004
Grimaldo_et_al_2004
 

posterlayoutnew

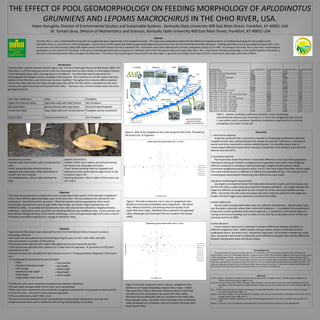
  • 1. Figure 2. Principle component one vs. two six navigational sites. Bonferroni-corrected probabilities were insignificant. Pike Island Pool, Willow Island Pool, and Greenup Pool are located in the upper Ohio River valley. Markland Pool is located in the glaciated valley, Newburgh and Uniontown Pool are located in the alluvial valley. -10 -8 -6 -4 -2 0 2 4 6 -8 -6 -4 -2 0 2 4 6 8 10 PCA2(dimensionless) PCA 1 (dimensionless) Aplodinotus grunniens Mouth Ratios: PCA 1 vs. PCA 2 Pike Island pool Willow Island pool Belleview pool R.C. Byrd pool Greenup pool Markland pool McApline pool Cannelton pool Newburgh pool Uniontown pool Figure 3. Principle component one vs. two ten navigational sites. Bonferroni-corrected probabilities showed that p-value < 0.0001. Pike Island Pool, Willow Island Pool, Belleview pool, R.C Byrd Pool, and Greenup Pool are located in the upper Ohio River valley. Markland Pool and McApline Pool are contained in the lower Ohio River glaciated valley. Cannelton Pool is enclosed in the constricted valley, Newburgh and Uniontown Pool are located in the lower Ohio River alluvial valley. THE EFFECT OF POOL GEOMORPHOLOGY ON FEEDING MORPHOLOGY OF APLODINOTUS GRUNNIENS AND LEPOMIS MACROCHIRUS IN THE OHIO RIVER, USA. Adam Gerughty, Division of Environmental Studies and Sustainable Systems , Kentucky State University 400 East Main Street, Frankfort, KY 40601 USA Dr. Tamara Sluss, Division of Mathematics and Sciences, Kentucky State University 400 East Main Street, Frankfort, KY 40601 USA Methods •Specimens for this project were obtained from the Cincinnati Natural History Museum's preserve ichthyology collection. •Each specimen was collected by electrofishing during the years of 1967, 1991 1992, and 1993 •Then preserved in a solution of 95% ethanol. •The pictures were captured with a Nikon D90 digital camera ascertained the pictures. • Each picture was captured from a distance of 1 meter from the specimen. A. grunniens (n=155) and L. macrochirus (n=45) •Each picture was then uploaded into Spot Advance version 4.7 imaging software (Diagnostic Instruments Inc.). •11 morphological measurements were recorded. ―Mass ―Maximum Standard Length ―Fork Length ―Maximum Total Length ―Body Depth ―Gape Width of the Mouth •20 different ratios were created for standardization between individuals. •The jaw length and gape width of the mouth were standardized. •These ratios were separated by the individual's navigational pool location and grouped by species of fish. A. grunniens and L. macrochirus were analyzed separately. •PCA was preformed using PC-ORD v 4.25. •Pearson correlations between mouth standardizations and principle components scores for each navigational pool were used to understand the driving standardization in the plots. Abstract The Ohio River is over 1,500 kilometers long with 20 navigational dams segmenting it into navigational pools. This study was conducted to determine the effects of navigational dams on feeding morphology for two predatory fish, freshwater drum, A. grunniens (n=155) and bluegill, L. macrochirus (n=45) in pools with differing geomorphology using specimens from the Cincinnati Natural History Museum. Feeding parameters such as jaw length and gap width of the mouth were ascertained using a Nikon D90 digital camera and SPOT Advance for each individual fish. Parameters were then analyzed with principle component analysis by PC-ORD. According to this study, the A. grunniens' morphological parameters are less similar for individuals in the semi-constricted glaciated valley compared to individuals that inhabit the alluvial valley and upper Ohio River. The L. macrochirus' feeding morphology is more similar between individuals in the semi-constricted glaciated valley and upper the Ohio River. The influencing morphological measurement was jaw length; A. grunniens jaw length mean was 0.273cm L macrochirus jaw length mean was 0.228cm. Discussion L. macrochirus response In general, we found that L. macrochirus showed no morphological differences between navigational dam sites, perhaps because the sample size was low. Additional L. macrochirus would need to be measured to improve statistical power. One possible reason why no morphological differences were found is because competition in the habitats are at minimal (Werner and Hall 1977). A. grunniens response The results have shown that there is measurable difference in the A grunniens population. Individuals habiting the McApline navigational pool (glaciated valley) were morphologically different compared to individuals habiting Newburgh navigational pool (alluvial valley), Uniontown navigational pool (alluvial valley), and R.C. Byrd Pool (upper Ohio River alluvial valley). This could indicate there is a difference in habitat and availability of prey. The principal mouth morphological measurement influencing these differences is jaw length. Significant morphological measurement Jaw length is an important factor that helps determine which trophic position and prey size the fish will utilize, usually reducing competition between individuals. Jaw lengths between life stages are different so young adults do not compete for all the same food (Sabatés and Saiz 2000). Essentially, fish with small jaw lengths will select small prey while fish with longer jaw lengths will select bigger prey (Lukoschek and McCormick 2001). Habitat Differences Alluvial valleys and glaciated valleys have very different characteristics. Alluvial valleys have vast floodplains; glaciated valleys have constricted floodplains. It is probable that morphology is being driven by the availability of terrestrial organisms. A. grunniens in the alluvial valley are relying on the annual flooding cycle to utilize an area that has an abundant source of food and nutrients (Junk et. al 1989). Further Research Future research needs to be conducted to interpret differences between individuals at different navigational sites. Stable isotopes and gut content analysis would help to better understand what A. grunniens and L. macrochirus feed upon. An increase in sample size, study sites, and species would help to statistically verify differences between sites and the differences between the glaciated valley and alluvial valleys. Acknowledgements This study would not have been possible without the contributions of Dr. Herman Mays and the Cincinnati Museum of Natural History’s loan of its ichthyology collection. I would also like to thank Thomas Moore College for allowing me to have access to their ichthyology collection. Special thanks to Dr. Tara Trammell of the University of Louisville for helping with data analysis through PC-ORD. I am grateful to Dr. Tamara Sluss, my advisor, for her constant support and guidance throughout this study. This study was supported by Dr. Kazi Javed, head of the Master's in Environmental Studies program at Kentucky State University. This study was supported by a grant from the Kentucky Water Resource Research Institute. I would like to thank Charles Weibel and Kentucky State University Aquaculture and Aquatic Sciences for providing matching funds. Introduction The Ohio River is North America’s fourth largest river, in terms of discharge (Thorp and Mantovani 2005). The Ohio River is 1,579 km long and connects with the Mississippi River at Cairo, Illinois. It is the largest tributary of the Mississippi River, with a drainage basin is 517,998 km2. The Ohio River was formed when the Monongahela and Allegheny rivers converged in Pennsylvania. This confluence is not the modern day flow pattern of the Ohio River; part of the river has been modified. Throughout the centuries different glaciers carved the valleys that the river flows through today (Ray 1974). The Ohio River is classified into two main sections, the upper Ohio River and the lower Ohio River. . The lower river is further broken down into three geological sections. Ohio River Subdivision Valley Floodplain Upper Ohio (alluvial valley) High valley walls with wide Channel Vast floodplain Glaciated Valley Narrow Channel with steep banks Narrow limited floodplain Constricted Valley Deep valley walls with narrow channel Floodplain almost nonexistent alluvial Valley Extensive bottomlands Vast floodplain Aplodinotus grunniens •Habitat: Open warm waters with a muddy benthic zone •Food: Young individuals feed primarily on copepods and cladocerans, while adults feed on crayfish, fish, and mollusks •Hunting behaviors: Rely on sight and touch to feed Lepomis macrochirus •Habitat: Prefer warm waters, can be found among the littoral zone along lakes and rivers •Food: Young individuals feed on copepods and cladocerans while adults feed on large insects or the occasional frog or fish •Hunting behaviors: Rely on sight to find insects near the surface Objective This study was conducted to compare the mouth morphology of two species of fish between navigational sites in three different geomorphologic areas on the Ohio River. The two predatory fish selected for this study were L. macrochirus and A. grunniens. These fish species could be separated by their mouth morphology measurements such as gape width, head length, and mouth height (Labropoulou and Eleftheriou 1996). It is possible that because the river continuity has been altered by navigational dams, individual L. macrochirus and A. grunniens are selecting different prey at different sites. If prey selection has been altered changes will show in the mouth morphology. Due to the geomorphology of the dams a lack of floodplain accessibility could lead to a change in individuals' diets. References Junk W., Bayley P., and Sparks R. (1989) The Flood Pulse Concept in River-Floodplain System. Canadian Special Publication of Fisheries and Aquatic Sciences, 106, 110-127. Lukoschek V. and McCormick M. (2001) Ontogeny of diet changes in a tropical benthic carnivorous fish, Parupeneus barberinus (Mullidae): relationship between foraging behavior, habitat use, jaw size, and prey selection. Marine Biology, 138, 1099- 1113. Ray L. (1974) Geomorphology and Quaternary Geology of the Glaciated Ohio River Valley-A Reconnaissance Study. Geological Survey Professional Paper, 826, 1-75. Sabatés A. and Saiz E. (2000) Intra- and interspecific variability in prey size and niche breadth of myctophiform fish larvae. Marine Ecology Progress Series, 201, 261-271 Thorp J. and Mantovani. (2005) Zooplankton of turbid and hydrologically dynamic prairie rivers. Freshwater Biology, 50, 1474- 1491. Werner R. and Hall D. (1977) Competition and Habitat Shift in two Sunfishes (Centrarchidae). Ecology, 58, 869-876. Figure 1. Map of the navigational dam sites along the Ohio River. Provided by the Army Corp. of Engineers -8 -6 -4 -2 0 2 4 6 -8 -6 -4 -2 0 2 4 6 8 PCA2(dimensionless) PCA 1 (dimensionless) Lepomis macrochirus Mouth Ratios: PCA 1 vs. PCA 2 Pike Island pool Willow Island pool Greenup pool Markland pool Newburgh pool Uniontown pool ―Eye Diameter ―Jaw Length ―Head Length ―Head Depth ―Snout Length Standardization L. macrochirus PCA 1 L. macrochirus PCA 2 A. grunniens PCA 1 A. grunniens PCA 2 Jaw length : mass 0.421 0.201 0.5975 -0.14 Jaw length : maximum standard length 0.94 0.221 0.9277 -0.33 Jaw length : fork length 0.9487 0.241 0.93 -0.32 Jaw length : maximum total length 0.9484 0.246 0.9282 -0.32 Jaw length : body depth 0.9463 0.188 0.208 -0.23 Jaw length : head length 0.2188 0.193 0.872 -0.28 Jaw length : eye diameter 0.7323 0.294 0.2274 -0.42 Jaw length : snout length 0.7522 -0.08 0.5732 -0.08 Jaw length : head depth 0.9025 0.172 0.8395 -0.36 Jaw length : gape width of the mouth 0.9455 -0.31 0.9725 0.151 Gape width of the mouth : mass 0.0811 0.273 0.2546 -0.21 Gape width of the mouth : maximum standard length -0.181 0.903 -0.169 -0.91 Gape width of the mouth : fork length -0.184 0.942 -0.189 -0.91 Gape width of the mouth : maximum total length -0.196 0.944 -0.24 -0.89 Gape width of the mouth : body depth 0.0331 0.827 0.0576 -0.26 Gape width of the mouth : head length 0.0467 0.251 -0.47 -0.71 Gape width of the mouth : eye diameter -0.226 0.662 -0.217 -0.39 Gape width of the mouth : snout length -0.481 0.41 -0.607 -0.26 Gape width of the mouth : head depth 0.117 0.703 -0.467 -0.71 Gape width of the mouth : jaw length -0.928 0.291 -0.947 -0.21 Table 1. Pearson correlation coefficients between mouth morphology standardization and principal components in a PCA of the navigational pool sites for L. macrochirus and A. grunniens. Significant correlations using Bonferroni-corrected probabilities are shown in bold text.