At a Glance: Construction Industry Results
•
2 recomendaciones•373 vistas

Check out construction industry results from the 2015 Aflac WorkForces Report.

Recomendados
Recomendados
Más contenido relacionado
La actualidad más candente
La actualidad más candente (19)
Destacado
Destacado (11)
Similar a At a Glance: Construction Industry Results
Similar a At a Glance: Construction Industry Results (20)
Más de Aflac
Más de Aflac (20)
Último
Último (20)
At a Glance: Construction Industry Results
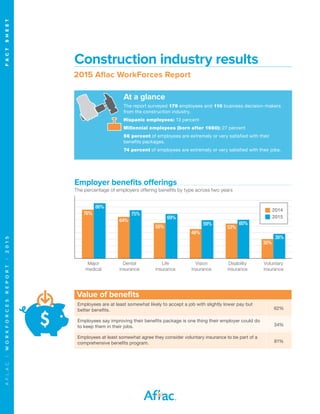
- 1. AFLAC|WORKFORCESREPORT|2015 FACTSHEET Construction industry results 2015 Aflac WorkForces Report At a glance The report surveyed 179 employees and 110 business decision-makers from the construction industry. Hispanic employees: 13 percent Millennial employees (born after 1980): 27 percent 56 percent of employees are extremely or very satisfied with their benefits packages. 74 percent of employees are extremely or very satisfied with their jobs. Value of benefits Employees are at least somewhat likely to accept a job with slightly lower pay but better benefits. 62% Employees say improving their benefits package is one thing their employer could do to keep them in their jobs. 34% Employees at least somewhat agree they consider voluntary insurance to be part of a comprehensive benefits program. 81% Major medical Dental insurance Life insurance Vision insurance Disability insurance Voluntary insurance Employer benefits offerings The percentage of employers offering benefits by type across two years 2014 2015 76% 86% 55% 69% 64% 75% 46% 59% 53% 60% 30% 38%
- 2. AFLAC|WORKFORCESREPORT|2015 FACTSHEET 0 5 10 15 20 25 30 35 Consumer-driven health care The percentage of companies making changes to their benefits programs Plan for 2015 2014 2013 21% 30% 28% 32% 23% 33% 11% 22% 13% 11% 13% 15% 7% 9% 9% 9% 6% 8% Increased copay Increased share of premium Implemented a high-deductible health plan Reduced health plan options Eliminated contributions for spouse/partner coverage* Used a public or private exchange *Family coverage prior to 2015 Reduced hours from full to part time Eliminated or cut back on employee benefits Laid off staff Eliminated or delayed raises Cut back on hiring *Reported in the 2014 Aflac WorkForces Report 0 5 10 15 20 25 13% 15% 20% 17% 16% 28% 15% 27% 23% 23% Expected* Actual Hiring and compensation Actual changes compared to employer projections in 2014
- 3. 4/15N150098A AFLAC|WORKFORCESREPORT|2015 FACTSHEET The 2015 Aflac WorkForces Report is the fifth annual Aflac employee benefits study. The study, conducted in February 2015 by Research Now, captured responses from 1,977 benefits decision-makers and 5,337 employees from across the United States. To learn more about the Aflac WorkForces Report, visit AflacWorkForcesReport.com. This material is intended to provide general information about an evolving topic and does not constitute legal, tax or accounting advice regarding any specific situation. Aflac cannot anticipate all the facts that a particular employer or individual will have to consider in their benefits decision-making process. We strongly encourage readers to discuss their HCR situations with their advisors to determine the actions they need to take or to visit healthcare.gov (which may also be contacted at 1-800-318-2596) for additional information. This article is for informational purposes only and is not intended to be a solicitation. Workforce earnings 5% <$25K 24% $25K- $49.9K 22% $50K- $74.9K 19% $75K- $99.9K 20% $100- 149.9K 9% $150K+ Workforce financial stability 39 percent of employees have less than $1,000 to pay for unexpected out-of-pocket medical expenses; 22 percent of employees have less than $500. 41 percent of employees would need to borrow from a 401(k) or use a credit card to cover unexpected medical costs. 12 percent of employees say high medical costs have negatively impacted their credit scores. 14 percent of employees have been contacted by a collection agency about outstanding medical bills. Most common benefits communication channels Face to face 65% Email 52% Employee-benefit booklet 43%